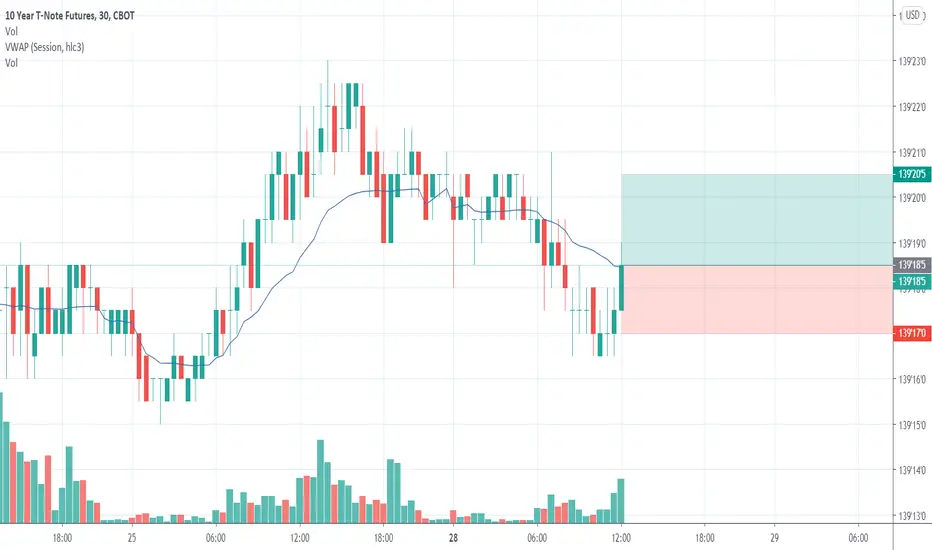
10Y T NOTE FUTURES (ZN1!) SwingBuy Signal
The market may keep going up
Take profit and Stop loss mentioned on the Chart
Please Note: the market can achieve : 139'17'0 , I only close the Trade manually
Zn1

SELL ZN1 in the next RED VOLUMEHello Friends
*****
the ZN1 market is in an uptrend
followed by a green volume increase at the bottom
and wick candle at the top of vwap it means that the market is going to bear
=> it's a sell signal
so you can sell and get out in the next red volume
THANK YOU
ATSELECTION


SELL ZN1 - 10 Year T-Note Futures Hello Friends - welcome back
*****
the Zn market is in an uptrend with more than four green volume
and a high wick candle
the next red volume the market will go down
=> it's a signal of sell
thank you
ATSELECTION

10Y T NOTE FUTURES (ZN1!) Swing BUY Signal
SL and TP Mentioned on the chart
Risk/Reward=1.6 ( make it a good opportunity)

10-year TN futures buy opportunity ZN a large breakout of the VWAP indicator with a strong green candle and a wicked low plus the breakout of the trading range with a large candle that is higher than the other candles this means that the buyers have entered this market and the start bullish trend.
signal buy .


a very important buying opportunity on the ZN 10 Year T-Note FutVWAP breakout with a big green candle it means the buyers have entered the market 10 Year T-Note Futures

10Y T NOTE FUTURES (ZN1!) SwingWe have a Sell signal!
the market may keep going down
Stop loss and Take profit Mentioned on the chart

10 Year T-Notes Futures - ZN1Hello Friends - welcome to another analysis
--------------------
today it is dedicated for an analysis of ZN1
today it is dedicated for an analysis of ZN1 , follow by a high green volume at the bottom it means that it is the start of a pulse , so it goes as a downtrend before breaking the line up
=> this is a sell signal
and as I always say " you should not trade at any time you have to trade at the right time possible "
Thank you

10Y T NOTE FUTURES (ZN1!) Swingwe have a Buy Signal
Good opportunity
Stop loss and Take profit Mentioned on the chart


10 Year T-Note Futures Hello Friends - welcome to another analysis
------
As we see that the ZN1 market is in a downward trend then we notice a larger green volume with the wick candle low
it is the start of an impulse that means that the market will increase
so you can buy ZN1 stocks and earn money
and as I always say " you should not trade at any time you have to trade at the right time possible "
Thank you

10Y T NOTE FUTURES (ZN1!) SwingWe have a Sell Signal
Stop loss and Take profit Mentioned on the chart

10 YEAR T-NOTE FUTURE - the market will go down Hello Friends - thank you for your support with like and comment .
-------------
So, as you can see in the graph the market was in a more or less stable situation = trending rang
after we see a high volume at the bottom followed by a low wick candle this means that the start of an impulse and that the seller attacks the buyer , so therefore the market will go down
=> and as I always say " you should not trade at any time you have to trade at the right time possible "
Thank you

10Y T NOTE FUTURES (ZN1!) SwingThe market will keep going down.
Stop-loss and Take profit Mentioned on the chart.

ZN1! 10 YEAR T-NOTE FUTURESZN1! 10 YEAR T-NOTE FUTURES .
A GOOD SIGNAL TO SELL THE MARKET WILL GO DOWN BY 95% .
DO NOT FORGET TO FOLLOW ME TO BRING YOU ALL NEW.
LIKE FOLLOW THANKS YOU

10Y T NOTE FUTURES (ZN1!) SwingWe have a Buy Signal
Risk/Reward Ratio: 1.14
Take profit: 139'26'0
Stop loss: 139'18'5

10Y T NOTE FUTURES (ZN1!) SwingThe market may keep going down and achieve our target
Probability: 65%
Take profit and Stop loss Mentioned on the chart

10Y T NOTE FUTURES (ZN1!) Swingthe market may keep going up
Stop loss and Take profit in the Chart with a Ratio Risk/reward=1.33
Good opportunity
10Y T NOTE FUTURES (ZN1!) SwingRATIO Risk/Reward : 1.5 with a probability equal: 65%
We have a Buy Signal
SL and TP on the Chart


10Y T NOTE FUTURES (ZN1!) 30MINWe have a Buy Signal
Take Profit and Stop Loss Mentioned On The Chart in my Prediction
