The Nature of Zones — Reversals, Continuations, and the FlowWe’ve all heard trading terms like Major Trend and Major Counter-Trend levels. These are zones where price either breaks through and continues (Trend Levels) or sharply reverses (Counter-Trend Levels). In the crypto world, these levels are often separated by enormous gaps, due to the nature of the space — as I’ve mentioned in a previous idea: Crypto Charts Whisper—Are You Listening?
Let’s get one thing clear from the start. These levels are not just thin lines that traders casually draw across a chart. They are zones. So, as a skilled trader, anytime someone mentions support or resistance, keep in mind: interact with these as zones, not levels.
Why? The answer lies in the nature of the candlestick itself. Most support and resistance areas — 99% of the time — are defined by candlesticks such as inverted hammers, shooting stars, etc. For instance, in an uptrend near its peak, you’ll often spot an inverted hammer with a rejection wick that’s at least 25–50% of the candle’s body. The longer the wick, the stronger the rejection. In that sense, the high and the close of that candle form the zone. And what better tool to use for this than the rectangle?
Now, to slowly return to our main point — many of you might’ve noticed that zones often change their nature, especially resistance zones. If you’re experienced, you already know: price tends to go higher by nature. So when a counter-trend zone gets broken and price pushes above it, it shifts — it becomes a trend zone. Later, if price retests it from above, it often turns into support, and with another reversal, it can shift again — becoming a counter-trend zone once more.
But my point goes deeper than what you’ll hear in lessons or YouTube videos. Like I said in another post — A Follow-up to “Adjustments for Better Readings & VSA vs BTC” — if it’s already out there, it’s probably old news.
A skilled trader keeps an open mind — merging everything into one system. And it's part of this oneness mindset that elite traders follow, which I want to share now.
So I ask you:
What if the idea of trend and counter-trend zones didn’t just apply to major levels?
What if this concept applied everywhere on the chart?
For me, this isn’t just a question anymore — it’s a fact. A fact that made me a better trader. I won’t lie — before I got good at this, I failed over and over. But I never quit. That’s not the point though. The point is to expand your vision and train yourself to react just like the elite do.
Take double or triple tops/bottoms — standard or rounded. These formations also act exactly like trend and counter-trend zones. And they stay relevant well into the future. Every level is tested at least twice, from both directions. Maybe not immediately, but eventually — across multiple time frames.
And just like that, a level becomes a major zone for future use — especially if you trade across multiple time frames. So be careful: if you’re only looking at the 1-hour chart, you might miss something important that’s playing out on the 3-minute. And that can trigger psychological discomfort... leading to FOMO — and all the mistakes that come with it.
Also remember — double and triple tops/bottoms are zones, not exact lines. Many traders lose trades by a single tick, just because they forget that rule.
Let’s go a bit deeper now.
Think about all the small highs and lows that appear between those tops and bottoms on a 3-minute chart.
How can they help you trade better? The answer goes back to my previous idea: Location, Location, Location — Consistency and Alignment.
I get it — staying observant 24/7 is hard. That’s why institutions and big players work in teams, in shifts. They’re never alone. You shouldn’t be either.
There’s a lot more that could be said about these levels and zones — how they reveal future trend behavior, a flow! even without indicators or VSA. It has to do with how specific highs and lows behave at certain points in time... but let’s leave that for now.
For the outro, remember this:
The real edge isn’t in indicators.
It’s in your ability to catch the flow of price,
And to read strength or weakness through the simple structures within the zones Big Players create — whether visible or hidden.
A chart isn’t a single truth.
It’s a battlefield of conflicting zones and mixed signals.
If this mindset resonates with you and you want to go deeper — whether it’s building confidence or spotting hidden signals early — I work with a small circle of traders, sharing TA privately every day. Feel free to reach out.
Until next time, be well and trade wisely.
Zone
EGX30 Neutral Zone AnalysisEGX30 stock is currently in a neutral zone, between the 31,970 resistance line and 31,424.07 support line, reflecting the buyers' and sellers' wait and taking their time for market analysis, especially with the investment atmosphere that is full of unaligned points of view. In case of taking an upward trend, it is expected not to breach the resistance line at 32,464.493 points, but in case of falling, it's expected not to break the support line at 29,989.245.

GBPUSD Week 19 Swing Zone/LevelsHope y'all had a good weekend with your profits.
This week we go into a slight variation of our winning strategy and ask the question:
what if Retracement is not fixed at the Fib levels but dynamic?
And so whilst keeping the zone and primary values of 279/721, we mark 2 levels and the predicted price reaction around them.
As Always price action determines trades

EURUSD - Macro ViewHello TradingView Family / Fellow Traders. This is Richard, also known as theSignalyst.
📈From a macro perspective, EURUSD has been bearish trading within the falling red channel.
Medium-term, EURUSD has been in a correction phase trading within the rising channel in orange.
Moreover, the green zone is a massive monthly resistance.
🏹 Thus, the highlighted red circle is a strong area to look for sell setups as it is the intersection of the upper red and orange trendlines and resistance.
📚 As per my trading style:
As #EURUSD approaches the red circle zone, I will be looking for bearish reversal setups (like a double top pattern, trendline break , and so on...)
📚 Always follow your trading plan regarding entry, risk management, and trade management.
Good luck!
All Strategies Are Good; If Managed Properly!
~Rich
Disclosure: I am part of Trade Nation's Influencer program and receive a monthly fee for using their TradingView charts in my analysis.

AUDUSD Tap Reading/ Trading Math Analysis Reversal Predictions BDear Trader,
Please find attached my analysis of $Subject, which uses mathematical calculations to identify potential reversal times and price levels.
The analysis details projected south and north price targets (horizontal lines on the chart), along with estimated time frames for possible reversals (vertical lines on the chart, accurate to within +/- 1-2 candles). Please note that all times indicated on the chart, including the vertical lines representing potential reversal times, are based on the UTC+4 time zone.
To increase the probability of these analysis, I recommend monitoring the 5-minute and 15-minute charts for the following key reversal candlestick patterns:
Doji’s
Hammer/Inverted Hammer
Double/Triple Bottom/Top
Shooting Star
Morning Star
Hanging Man
I welcome your feedback on this analysis, as it will inform and enhance my future research.
3rd Apr12:05 PM
3rd Apr 4:30 PM
3rd APr 6:10 PM
3rd APr 6:30 PM
3rd Apr 10:25PM
4th Apr 2:10 AM to 2:30 AM
4th 4:30 AM to 5:35 AM
4th 10:30 AM
Regards,
Shunya Trade
⚠️ Disclaimer: This post is educational content and does not constitute investment advice, financial advice, or trading recommendations. The views expressed here are based on technical analysis and are shared solely for informational purposes. The stock market is subject to risks, including capital loss, and readers should exercise due diligence before investing. We do not take responsibility for decisions made based on this content. Consult a certified financial advisor for personalized guidance.

ROSE in Key Accumulation Zone: Reversal on the HorizonLSE:ROSE is trading within a key Accumulation Zone around $0.04, overlapping with a strong demand area that has historically triggered price recoveries.
> $0.035–$0.045 remains a critical demand zone, attracting buyers.
> A bounce from this zone could target resistance levels of $0.07–$0.08.
> RSI is near oversold conditions, hinting at weakening selling pressure.
If ROSE holds above this support, a bullish reversal is likely. A breakdown below could lead to further downside.
DYOR, NFA

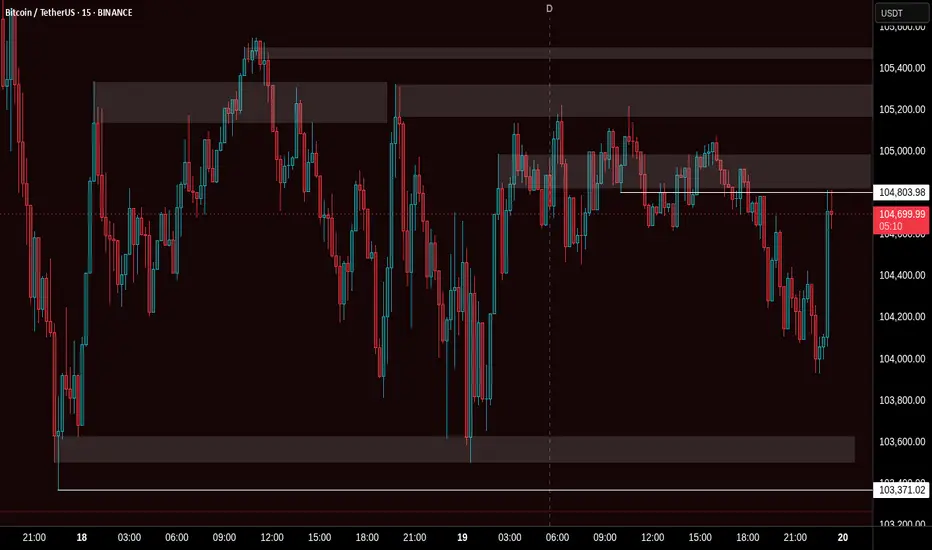
BTCUSDT Fresh Short Setup: Targeting Key Support Zones with SMC Description:
This trade setup presents a Bitcoin short opportunity on the 4H timeframe using the Smart Money Concepts (SMC) framework. After a significant reaction from the supply zone, Bitcoin's price structure aligns with bearish confluences, signaling potential downside. Additionally, external events, such as the recent announcement of China's AI application "DeepSeek," may have amplified market volatility, further supporting the setup.
Trade Setup:
Entry:
Between 103,300 and 104,500
Take-Profit Levels (TP):
101,897
99,825
97,565
95,208
Stop Loss (SL):
Above 105,975
Analysis and Confluences:
Market Structure:
Bitcoin remains in a bearish trend on the 4H timeframe, with consistent lower highs and lower lows.
Supply Zone:
The price is entering the 103.3k–104.5k supply zone, a key resistance area where sellers are expected to dominate.
Fibonacci Confluence:
This zone overlaps with the 0.618–0.786 Fibonacci retracement levels, a high-probability reversal area.
Liquidity Sweeps:
Liquidity above previous highs has been swept, leaving the path clear for potential downside.
Bearish Targets:
The targets align with previous demand zones and liquidity pools at 101,897, 99,825, 97,565, and 95,208.
Trade Plan:
Confirmation: Wait for bearish price action signals or smaller timeframe BOS (Break of Structure) within the supply zone before entering.
Risk Management: Adjust position size to keep risk within acceptable levels. After reaching TP1, move your stop loss to breakeven and secure partial profits.
Final Note: While bearish bias dominates, unexpected macroeconomic events can cause reversals, so use tight risk management.

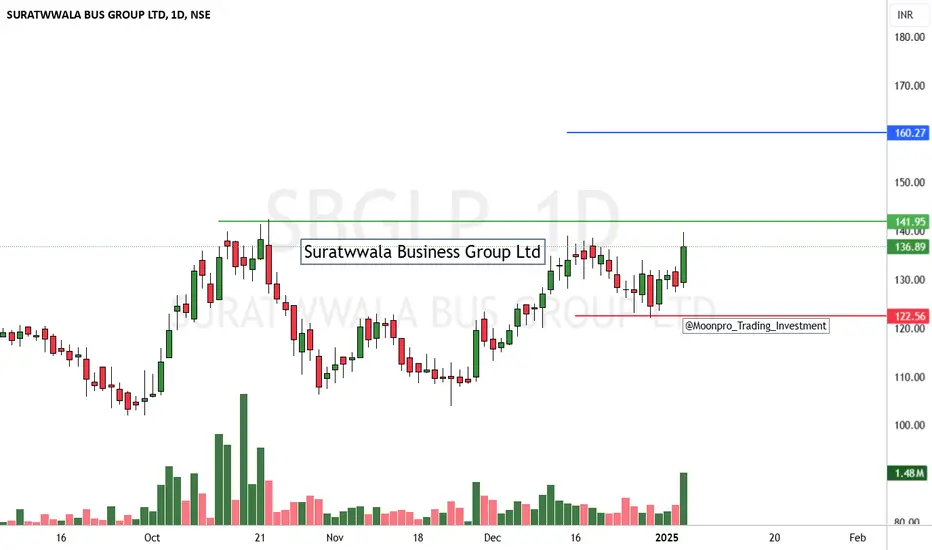
Suratwwala Business Group LtdSuratwwala Business Group Ltd
After the cup, the stock price drifts slightly downward in a consolidation phase (the handle), before breaking out to the upside
stock's price may continue to move in that direction
#XAUUSD STILL IN VAILD ZONE The XAUUSD long zone remains valid as the price holds above a key support level, indicating strong bullish potential. Traders are advised to monitor the price action closely for confirmation signals, ensuring a confident entry into the market for the next potential upward move.
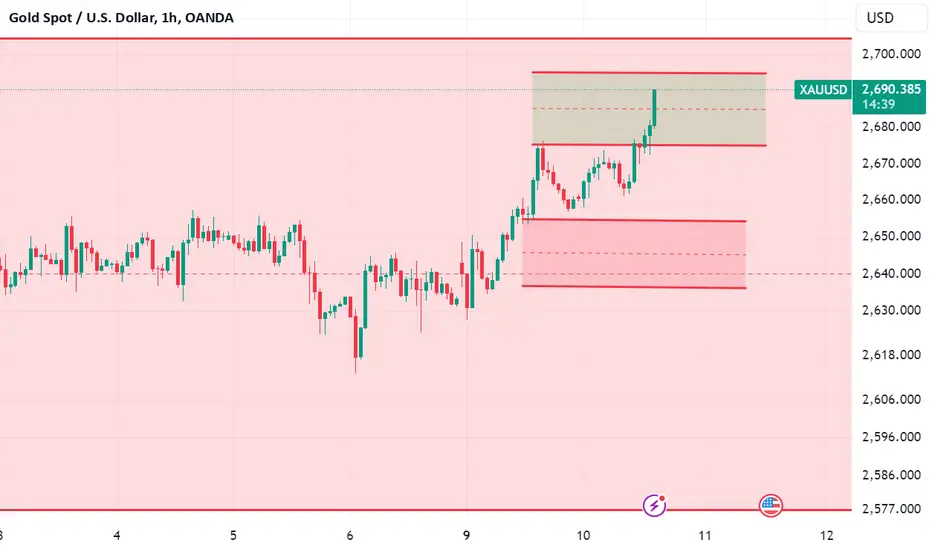
XAUUSD 1HR TIME FRAME HELLO TRADERXAU/USD 1-Hour Chart: A detailed analysis of gold's short-term price movements against the US dollar, showcasing crucial support and resistance levels, recent trends, and potential trading opportunities based on market momentum and price action...

XAUUSD STILL IN RISING TOWARDS RESISTANCE ZONE 2658-2665HLLO TRADER; possible to give good move today, because tomorrow is BANK holiday and friday no news thats why..

Gold Outlook Gold is moving as on its path which is clear for it
As we see the chart chart tells us from daily prespective that yesterday's low is not yet broken gold has taken support from under yesterday low now its showing us rejection over that another confluence is gold has completed 68% fibonachi retracement over its daily chart now we will be seeing it as bullish bais
From 4H to 1H prespective gold has formed triple bottom and we are experiencing a change in volume we can expect a rally upwards in gold although we are still bearish on gold but seems like we are going to change our direction ⬆️

EURUSD Testing Strong Support ZONE Near 1.0700EURUSD Testing Strong support zone near 1.0700
EURUSD is currently testing strong support zone near 1.0680:1.0700.
This area seems poised to push the price up again in the coming days making it a potential shortterm trade opportunity.
The US will release the consumer price index CPI data on wednesday so the market is likely to speculate again .
The US consumer price index YOY For October is expectedto be 2.6 percentage vs 2.4 percentage the previous month.
Energy YOY for October is expected to remain 3.3 percentage.
You mayfind more details in the chart thankyou and Good luck

BTC btc "arrowhead"neutral zone orange line based on past moving averages and current measurement up to november 1st 2024,. Purple lines represent arrowhead fibonacci of price above and below the standard average neutral between support and resistance based from all the way back to october 2024, one year prior. Not a lot of activity above 160%, main range of bitcoin remaining in 78% lower half and over 100% gains upper region.

Gold at Record Highs! Breakout or Imminent Reversal?4-Hour Time Frame Analysis:
Higher Highs (HH) and Higher Lows (HL): The chart displays a clear upward trend with higher highs and higher lows. This indicates a bullish market structure.
Ascending Channel: The price is moving within an ascending channel, showing a steady increase in value.
Key Levels:
1-Hour LQZ / Reversal: 2429.940
4-Hour LQZ / Reversal Point: 2391.394
Potential Take Profit (TP) Levels:
TP 1: 2319.385
TP 2: 2288.085
TP 3: 2267.832
Current Price Action: The price has reached the upper boundary of the ascending channel, suggesting a potential reversal or breakout. Traders should watch for confirmation before taking action.
1-Hour Time Frame Analysis:
Higher High (HH): Similar to the 4-hour chart, the 1-hour chart also shows a higher high, indicating a bullish trend continuation.
Ascending Channel: The price is respecting the ascending channel, reinforcing the bullish sentiment.
Key Levels:
1-Hour LQZ / Reversal: 2429.940
4-Hour LQZ / Reversal Point: 2391.394
Current Price Action: The price is at the top of the ascending channel. Traders should look for signs of a reversal or a breakout above this level to gauge further price movements.
15-Minute Time Frame Analysis:
Ascending Channel: The 15-minute chart shows a detailed view of the ascending channel with the price closely following this structure.
Key Levels:
1-Hour LQZ / Reversal: 2429.940
4-Hour LQZ / Reversal Point: 2391.394
Current Price Action: The price is currently at the top of the channel, suggesting a potential short-term reversal or continuation depending on the breakout direction.
Summary:
Bullish Trend: All three time frames show a clear bullish trend with higher highs and higher lows.
Ascending Channel: The price is moving within an ascending channel on all time frames, which supports the bullish outlook.
Key Reversal Zones: Pay attention to the 1-hour and 4-hour LQZ / Reversal points at 2429.940 and 2391.394 respectively.
Potential Reversal: The price is currently at the upper boundary of the ascending channel on all time frames. This indicates a potential reversal if the price fails to break out. Traders should wait for confirmation before entering trades..

Ultimate Trading Strategy: Reaction to Supply and Demand Levels!🔍 Identifying Potential Buy or Sell Zones: In this step, you need to identify the zones that are likely to react and wait for the price to potentially reach them. ⏳📊
🌟 With the reaction to the first area, a buy trade is activated. 🌟
📝 Confirmations:
📉 Reaction to the expected area – Watch for a price movement hitting our anticipated zone!
🛠️ Formation of a combined hammer pattern – Look out for this powerful reversal signal!
📈 Formation of a bullish engulfing pattern – A strong indicator of upward momentum!
🔍 Trading Tips:
💡 High-risk stop-loss location:
👉 Place it below the candlestick pattern. At least twice the spread to ensure you're covered! 📏🔒
💡 Lower-risk stop-loss location:
👉 Place it below the expected area. Again, at least twice the spread for extra safety! 📏🔒
💰 Take-profit strategy:
👉 Base it on risk management mathematics, such as risk-reward ratios of 2, 4, and 6.
👉 Alternatively, observe reactions to past market areas, especially near important market highs and lows. 📊📈
🎯 Entry point strategies:
👉 Enter at the close of the confirmation candle.
👉 Or, set a limit order around 50% of the confirmation candle for a bigger volume opportunity! 📉📈
🌟 Buying in Two Phases: A Smart and Exciting Strategy! 🌟
🔹 Phase One:
When you reach a profit of twice the risk, exit the trade. Why? Because the Asian high has been hunted and the candlestick formed has a long upper shadow. 🌄💹
💡 Analysis:
The price hasn’t reached other zones yet and has risen in reaction to the first expected zone. Therefore, we expect a pullback and continued upward movement. 💪📈 So, I’ll place a second buy trade. 🚀💵
🔍 Confirmations for the Second Buy Trade:
A double bottom has formed, marked with an X. ❌❌
A small hammer candlestick has swept the double bottom. 🔨
A long positive shadow candlestick has swept the bottom and reacted to a small order block on the left. 🌟
💡 Tips for the Second Buy Trade:
Enter at the close of the long-shadowed doji candlestick or place a stop limit order above the long-shadowed doji candlestick. 📉📈
The stop loss should be below this candlestick. 📏🔒
🔹 Phase Two:
Next, the price has reached an expected reaction zone from where we expected a price drop. 🌐💡
🔍 Confirmations for the Sell Trade:
Reaction to the expected zone. 🔍
An inverse hammer candlestick reacting to the zone. 🔨
💡 Tips for the Sell Trade:
The entry point should be in a candlestick with a negative signal indicating a price drop. This hammer candlestick can indicate a decline. 📉🔻
The target can be a reward of 2 or the last price bottom. 🎯💰
The stop loss should preferably be behind the expected zone. 📏🔒
🔥 Important Points!!:
Since the price hasn’t deeply penetrated the zones, there’s a chance it might go higher or even mitigate this zone twice, ultimately turning it into a pullback for a further price rise. 🚀📈
Continuing on, the price reached the upper zone area.
We expected a price drop from this zone, but it reached at 03:15,
which is outside our trading session. However, we could have traded on it.
🔍 Sell Confirmations:
The price has reached the expected zone.
An inverse hammer candlestick pattern.
💡 Interesting Fact:
If you had placed a limit order around the midpoint of the previous two zones,
you would have profited by now. So, for this zone, you can also place
a limit order around 50% of it.
Continuing further, other zones have formed below that could be useful
for new trades.
✨ Successful Sell Trade Achieved, Reaching a Reward of 4 Times the Risk.
📉 During the session continuation, the trend line was broken, triggering an upward price pullback.
🔹 Now, at the beginning of the session, we have a new zone, likely a selling order placement area. We're taking the risk on this zone. This time, we can place the trade around 50% of it. 🚀💼
🔥 Alright, what's your take now? 🔥
🌟 Is the price reacting to this level or not? 🌟
🚀📈 or 📉💥
Where are the upper zones located?
What do you think? 🤔💬

Will COTI find a way out?Hello. Today we are looking at COTI cryptocurrencies. Recently we saw a strong upward move, which was caused by fundamental information. At this point, we can see a clear corrective structure with a clear entry zone. The entry condition is the breakout of the low of wave A and low RSI on the H4-D1 intervals. We should look for a candle formation in the zone. The target for this trade will be a new top. This is a SPOT and leverage zone.
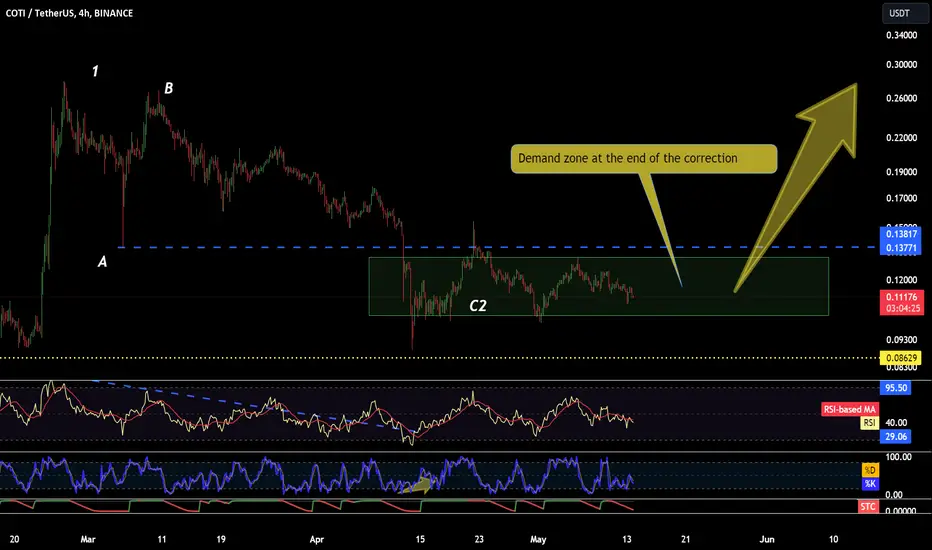
COTI - Zone UPHello. Today we are looking at COTI cryptocurrencies. Recently we saw a strong upward move, which was caused by fundamental information. At this point, we can see a clear corrective structure with a clear entry zone. The entry condition is the breakout of the low of wave A and low RSI on the H4-D1 intervals. We should look for a candle formation in the zone. The target for this trade will be a new top. This is a SPOT and leverage zone.

BTC1! - HARD TO BUY AT THE TOP? - BUY AT THE RED LINE - WEEKLYBTC Future price is ranging at the top of his historical price range zone.
We feel that there is a potential for the price to just leave earth and go beyond easily and at the same time deception can occur with possibility to see the price squeeze down buyers before going in its potential historical run up to new highs.
This is when DCA or Entry could potentially be done at the RED LINE zone. Long Entry to not miss history!
Who still believe that it could go to zero? here fundamental analysis is necessary depending on how regulation is going to evolve in the next years....

HOTUSDT - LONG or SHORT breakout ? HOTUSDT is currently consolidating around its support zone of 0.00185 and we can expect the consolidation to continue for next few days.
We have both LONG and SHORT opportunity here depending on whether the price breaks the support zone or bounce backs after consolidating at the support zone.
We will share more details about the trade once the price moves. Stay tuned for more updates.
Like and follow us for more similar ideas.
Cheers!
GreenCrypto

COTI - A short trade#COTI/USDT #Analysis
Description
---------------------------------------------------------------
+ COTI price has broke out from the support zone and heading towards the next support
+ This is a clear indication of the continuing bearish trend.
+ I see a good opportunity for short trade here.
---------------------------------------------------------------
VectorAlgo Trade Details
------------------------------
Entry Price: 0.1833
Stop Loss: 0.2169
------------------------------
Target 1: 0.1622
Target 2: 0.1416
------------------------------
Timeframe: 4H
Capital Risk: 1-2% of trading capital
Leverage: 5-10x
---------------------------------------------------------------
Enhance, Trade, Grow
---------------------------------------------------------------
Feel free to share your thoughts and insights.
Don't forget to like and follow us for more trading ideas and discussions.
Best Regards,
VectorAlgo

LIT - A trade opportunity with a profit potential of +730 %#LIT/USDT Analysis
Description
---------------------------------------------------------------
+ LIT has formed a promising saucer pattern, typically regarded as a bullish indicator.
+ Currently, the price is lingering near the resistance zone, suggesting a potential breakout in the near future.
+ I've identified a compelling trade opportunity with a profit potential of +730% (leveraged at 10x). I'm initiating the trade at the current price, allocating a small margin of 0.25% of the trading capital.
---------------------------------------------------------------
VectorAlgo Trade Details
------------------------------
Entry Price:1.267
Stop Loss: 0.992
------------------------------
Target 1: 1.371
Target 2: 1.524
Target 3: 1.787
Target 4: 2.203
------------------------------
Timeframe: 1D
Capital: 1-2% of trading capital
Leverage: 10-15x
---------------------------------------------------------------
Enhance, Trade, Grow
---------------------------------------------------------------
Feel free to share your thoughts and insights.
Don't forget to like and follow us for more trading ideas and discussions.
Best Regards,
VectorAlgo

OP - Breakout waiting to happenBINANCE:OPUSDT (1DH CHART) Technical Analysis Update
OP is currently trading at $3.777 and showing overall bullish sentiment and waiting to breakout from the resistance zone.
Breakout from the resistance zone will definitely fuel to bull run of the OP. OP is also one of the fundamentally strong coin so we cannot go wrong with the LONG entry for this coin while we wait for bull run continue.
Entry level: $ 4.292 (candle close above this)
Stop loss level: $ 3.697
Target 1: $ 4.597
Target 2: $ 5.061
Target 3: $ 5.571
Target 4: $ 6.610
Target 5: 6.792
Max Leverage: 2x
Don't forget to keep stop loss.
Follow Our TradingView Account for More Technical Analysis Updates, | Like, Share and Comment Your thoughts.
Cheers
GreenCrypto
