EURJPY point of revers?
OANDA:EURJPY constantly pushing in last periods, currently on this point expecting trend revers and short bearish push.
SUP zone: 173.200
RES zone: 170.500, 169.700
Zonetrading

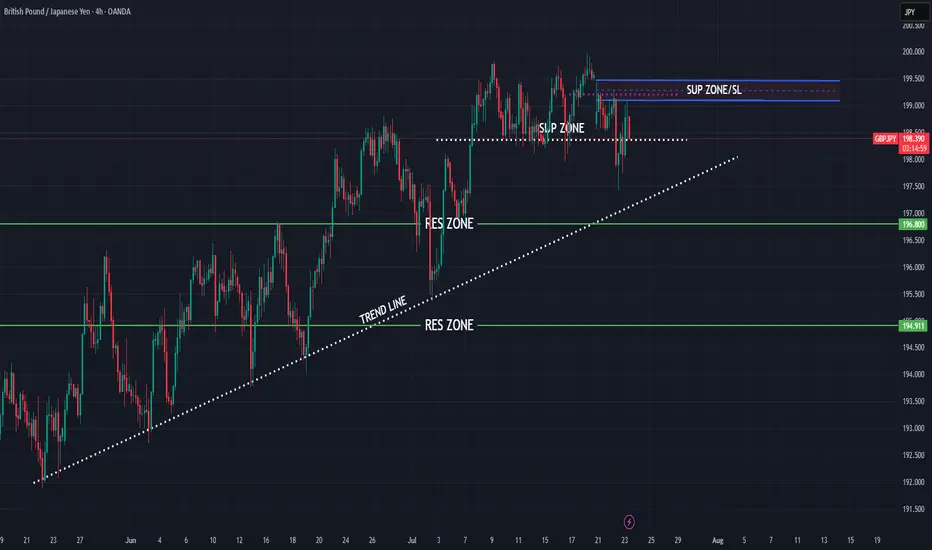
GBPJPY bearish expectations
OANDA:GBPJPY long time bullish trend we are have, currently price in zone, changes on this point expecting
SUP zone: 199.100
RES zone: 196.800, 194.900
CADCHF new view, still bullish expectations
OANDA:CADCHF first analysis till TP1 (attached), having thoughts we are not see to much here and expecting higher bullish push than in previous analysis.
We are have break of zone, price is start pushing, at end its revers on first res zone (0.60600), in meantime DESCENDING CHANNEL is be created, on 22.Jun is be breaked, currently price is break and ASCENDING TRIANGL.
SUP zone: 0.59600
RES zone: 0.60800, 0.61200

GBPCAD new bearish push expecting
OANDA:GBPCAD price break zone, currently in BEARISH PENNANT, after todays BOC event here for expect bearish push
SUP zone: 1.85800
RES zone: 1.84200, 1.83800

EURJPY higher bearish expectations from here
OANDA:EURJPY analysis before this one, is be closed, i am note will share new analysis on EJ soon.
ASCENDING CHANNEL visible, price in zone currently, after ISM events today, we are not see break of res zone 164.250, which for me having positive imact on bearish expectations here.
Trend line is breaekd and soon exxpecting to see and break of ASCEDING CHANNEL and higher bearish fall continuation.
SUP zone: 164.250
RES zone: 161.750, 160.900

CADJPY higher bullish for expect
OANDA:CADJPY price is make push on trend line and ROUNDED BOTTOM pattern is be created on trend line, with zone inside, which are also breaked.
Here for next week, bullish continuation to expect.
SUP zone: 104.250
RES zone: 106.000, 106.350

EURNZD new bearish expected
OANDA:EURNZD in last period price is have upside-downsides moves, price is make again bounce on strong zone (1.91000), yesterday we are have and RBNZ, how looks from here we wil lcan expect higher bearish trend.
SUP zone: 1.91000
RES zone: 1.85000, 1.83500

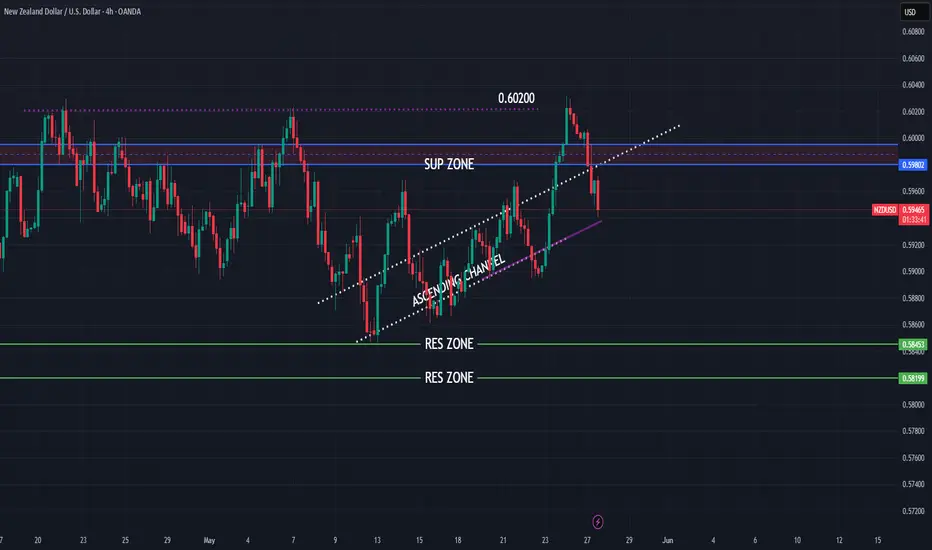
NZDUSD higher falls expecting
OANDA:NZDUSD ASCENDING CHANNEL visible, we are have break of same on 23.5, price is start pushing but on first res zone (0.60200), price is start making reverse.
Currently again in ASCENDING CHANNEL expectations for this week are to see break and bearish push.
SUP zone: 0.59800
RES zone: 0.58450, 0.58200
EURCHF both scenarios possibles
OANDA:EURCHF UPDATE from first analysis (attached) we are have upside - downside moves, new trend line is created, sup zone is created (violet line) and we can see also long zone.
If we see break of 0.94000 we will be higly possible in bullish move, break of sup zone (violet line) we will can see bearish move.
Currently still giving higher chances for bearish trend, but lets see some stronger moves.
SUP zone: 0.93850
RES zone: 0.92750, 0.92550

Trade the Angle, Not the Chop: Angle of MA ExplainedNot all moving averages are created equal. While most traders rely on the slope of a moving average to gauge trend direction, the Angle of Moving Average script by Mango2Juice takes it a step further—literally measuring the angle of the MA to help filter out sideways markets and highlight trending conditions.
Let’s explore how this tool works, how we use it at Xuantify, and how it can sharpen your trend-following strategy.
🔍 What Is the Angle of Moving Average?
This indicator calculates the angle of a moving average (default: EMA 20) to determine whether the market is trending or ranging. It introduces a No Trade Zone , visually marked in gray, to signal when the angle is too flat—suggesting the market is consolidating.
Key Features:
Measures the slope of the moving average
Highlights ranging zones with a gray color
Helps filter out low-momentum conditions
Customizable MA type and length
🧠 How We Use It at Xuantify
We use the Angle of Moving Average as a trend filter —not a signal generator.
1. Trend Confirmation
We only take trades in the direction of a steep enough angle. If the MA is flat or in the gray zone, we stay out.
2. Entry Timing
We combine this with structure tools (like BOS/CHOCH) to time entries after the angle confirms a trend is underway.
🎨 Visual Cues That Matter
The script uses color to show when the market is:
Trending : Clear slope, colored line
Ranging : Flat slope, gray line (No Trade Zone)
This makes it easy to:
Avoid choppy markets
Focus on momentum-driven setups
Stay aligned with the dominant trend
⚙️ Settings That Matter
You can customize:
MA Type : EMA, SMA, etc.
MA Length : Default is 20
Angle Sensitivity : Adjust to define what counts as “flat”
⚙️ Higher timeframe alignment
You can look at HTFs for better and stronger entry and exit points.
Below a 1H and 4H chart where the 4H clearly adds strong buying power for a good long entry point.
🔗 Best Combinations with This Indicator
We pair the Angle of MA with:
Structure Tools – BOS/CHOCH for trend context
MACD 4C – For momentum confirmation
Volume Profile – To validate breakout strength
Fair Value Gaps (FVGs) – For sniper entries
⚠️ What to Watch Out For
This is a filter , not a signal. It won’t tell you when to enter or exit—it tells you when not to trade . Use it with price action and structure for best results.
🚀 Final Thoughts
If you’re tired of getting chopped up in sideways markets, the Angle of Moving Average is a simple but powerful filter. It helps you stay out of low-probability trades and focus on trending opportunities.
Try it, tweak it, and see how it fits into your system.

AUDNZD both scenarios possibles
OANDA:AUDNZD first analysis till target (attached), here is update and new view on AUDNZD.
We having trend line which is breaked, we having and H&S on top of trend, which also is breaked, price is after make bearish push, but in last period is stop progressing, its make few bouncens on sup zone 1.08230.
In case we see strong bearish push - break of 1.08350 we will have high chance to see higher bearish trend, in case we having break of top sup zone 1.09100 (violet line) we will having bullish confirm.
Personal more bullish, but lets wait for confirms.
Targets:
BULL: 1.10200, 1.10500
BEAR: 1.07800, 1.07500

EURGBP new fall expecting
OANDA:EURGBP whats next, we are have break of DESCENDING TRIANGL, then its be created DESCENDING CHANNEL, which also is be breaked, now we have breaked and trend line.
Price currently is in zone. Expectations are to see break of zone and higher bearish fall.
SUP zone: 0.84600
RES zone: 0.83500, 0.83200

EURCAD no3 view, bearish continuation still to expect
OANDA:EURCAD last two analysis on EURCAD doing, going good, will be attached, having now one more update and new view.
Price at end is break RAISING WEDGE and BEARISH FLAG, pushing strong bearish, strong volumem and momentum is gathered and still here having strong bearish expectations.
SUP zone: 1.57200
RES zone: 1.53000, 1.51600

EURCAD update and new view on EC
OANDA:EURCAD in first view (attached) we are have at end break of zone and also break of trend line, price is start pushing bearish.
Now RAISING WEDGE pattern is visible, looks like strong momentum is gathered and from here expecting one more fall.
SUP zone: 1.57100
RES zone: 1.54600, 1.54000

EURUSD update and new bearish view
FX:EURUSD one more view on EU, we can see long zone and break of same how currently looks, two bounce on sup zone 1.13500, price now pushing till crucial zone 1.12700, if we see break here we will have confirm.
Currently how everything looks, its expected to see stronger fall here.
SUP zone: 1.14000
RES zone: 1.11700, 1.11200

EURNZD expected higher fall for new week
OANDA:EURNZD strong bearish candle on 9.April, bearish momentum, price is break and crucial zone there, in last periods we are have three times bounce on now strong zone.
For new week here stilll expecting to see bearishnes
SUP zone: 1.91550
RES zone: 1.87600, 1.86000

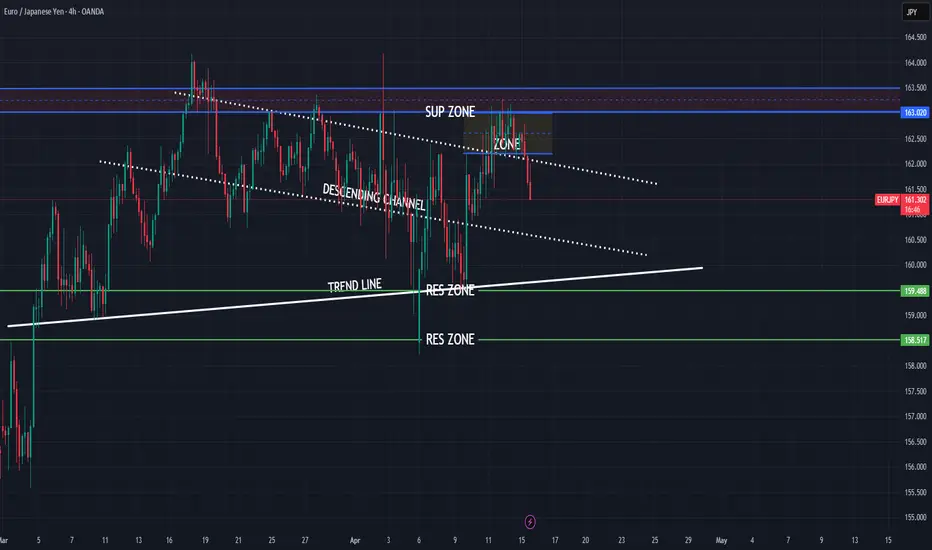
EURJPY strong bearish expectations
OANDA:EURJPY strong bullish expectations i am have, but things will not go like expected..
Currently price in DESCENDING CHANNEL, in moment we are have break of same, but price is make revers in zone and pushing now bearish.
Here now exepcting fall till trend line.
SUP zone: 163.000
RES ozne: 159.500, 158.500
CADCHF bullish view for this week
OANDA:CADCHF price action visible, price is make push on bottom trend line from PA, currently bouncing on sup zone 4h TF and from here exepcting for this week bullish continuation
SUP zone: 0.59200
RES zone: 0.60600, 0.61200

EURJPY still bullish view
OANDA:EURJPY first analysis attached, in new analysis, we have new structures created (BULLISH FLAG, ZONE, TREND LINE), both pairs dominant in market, personally here still bullish i am.
SUP zone: 160.350
RES zone: 163.400, 164.100

BTC — Bulls in Full Control | Next Stop $87K+?Bitcoin just smashed through the resistance around $84,300, and the bullish momentum is 🔥
Now we’re heading straight into the next key zone at $87,000–$88,765, which lines up perfectly with previous supply.
If bulls keep this pace — a clean push toward 87K looks very real in the coming sessions.
Entry: $84,500 – $85,500
TP: $86,800 – $87,000
SL: $83,500
More thoughts in my profile @93balaclava
Personally I trade on a platform that offers low fees and strong execution. DM me if you're interested.

NeiroETH — Strong Rebound Zone Hit. Big Move Loading?We just tapped into a major demand zone at 0.01532–0.01607, and the reaction was immediate — strong bounce straight off the level.
From here, I’m looking for at least a recovery into the mid-range of the descending channel, with potential for much more.
Main target — a breakout above the local ATH at 0.01993.
More thoughts in my profile @93balaclava
Personally I trade on a platform that offers low fees and strong execution. DM me if you're curious.

Trading A Divergence Trade (Breakdown) with Pivots and LiquidityTrading divergences was always a problem for me in the past. I did the same thing you did and got it wrong every time. I was trading divergences when i saw them instead of realizing a divergence is a flip of support and resistance levels. I just needed to know where they are.
In this video:
Internal vs External Pivot divergence confirmation:
You can have two types of pivots on your chart. One for long term and one for short term.
Using them to confirm short and long term price action is intuitive as youll be able to see the market squeezing on the short term while knowing where your long term price structure exists.
Price action to Divergence Confirmation:
A divergence on a short term pivot is an indication of short term loss of trend or reversal.
If the short term has no divergence but the long term does, you are about to end up with some pretty large price moves.
Youll be confirming the divergence by looking for highs, lows, and closes moving the wrong way from current price action.
This video will give you a method you can use to draw out your support zone / resistance zone / divergence zone and use them to your advantage.
The "Divergence Zone" that you draw out is the very reason why so many people fail at divergences.
Bare in mind that when you have a divergence, support and resistance are on the WRONG sides as their normally are so you'll learn here how to find those zones as well.
Then in the end of the video ill show you how to use lower timeframes to confirm the new move of the market.
Thanks, everyone. For coming through to the CoffeeShop.

NZDUSD bullish starting?
OANDA:NZDUSD from start of February sentiment is bullish.
In week before we are have strong events like RBA, TRUMP SPEAK, NONFARM.., we all are expect NZD and AUD domination but at end in zone we are see changes and strong fall.
After all of this now from here expecting new bullish starting.
SUP zone: 0.55200
RES zone: 0.57400, 0.58200
