AUDJPY SHORT TERM SHORTTHE PRICE IS AT A ZONE ITS MOST LIKELY TO REVERSE .IT HAS REACHED A TRENDLINE FOR A RETEST
Zonetrading

EURNZD PERSISTANCETHIS IS DIFFERENT ,LOWER LOWS,LOWER HIGHS ,PRICE IS CONSOLIDATING ,WE ANTICIPATE A BREAKOUT,WHICH WAY,BULLISH STANDS OUT BECAUSE EVER SINCE A FAKE BULLISH BREAKOUT THE MARKET STARTED ACTING AS ABOVE DESCRIBED BUT IT WAS KINDA OF MAKING A BULLISH MOVE

NEWZEALAND HERE WE COMEZONES AND TRENDLINES ,THIS ASSET IS AT A LOWER ZONE ITS MOST LIKELY TO RISE BULLS ARE BUSY PREPARING TO LAUNCH OFF WE JUST HAVE TO WAIT FOR A YEAR AND HALF TO SEE THE RESULTS FOR THIS IS AN INVESTMENT ,ITS A LONF TRADE

EUR/USD Consolidation or Breakout?There's a couple ways to play this setup depending on how price progresses.
I've drawn out the zone where price has been stuck in yellow. If we see more rejection at the top of the zone we can look for a consolidation trade and sell back towards the middle and bottom of the zone.
If we break up and above our zone then we can look to enter a buy on either the breakout and close or a breakout and retest of the top of the zone.
In that scenario I've drawn out some partial profit targets on our way to a previous price structure high I'd aim for.
If these scenarios fail to play out I will look to re-evaluate and this setup may become invalidated.


GBPNZD 31/11/2019
Hello Traders! Witaj!
We play with Smartmoney concepts, that means that we focus mostly on price action to determine what will happen in future.
As we all know, price is moved by BIG players: Banks, Institutional traders, HFT bots (we call them all of them SmartMoney).
They can't play as we do, cause of a HUGE lot sizes, so cause of that they need to SELL to BUY and BUY to SELL for positioning them self in the best possible spot.
If u were learn about trading from free and accessible knowledge, u probably heard about BUYing LOW and SELLing HIGH?
So SmartMoney must BUY LOWER and SELL HIGHER :)
We as retail traders are just a small fish in this ocean, so we need to catch the waves which are created by SmartMoney.
CHARTS AGENDA:
BITCOIN - MONEY POCKET
ARROWS ARE ABOVE AND BELOW OF EQUAL HIGHS AND LOWS
BLUE LINES - ENTRIES
MARKED LINES - PREVIOUS ENTRY POINT
BLUE BOX - GAP's
COLOR BOXES - FOCUS POINT TO REACT
Don't forget to like if it was helpful to you. We appreciate likes and comments.
Jesli podobal Ci sie material zostaw like:) Masz pytania - pisz smialo :)
Thank you,
Dzieki za uwage :)
GOD BLESS U ALL!

POTENTIAL REVERSAL OPPORTUNITY price reached important zone, previously this pair reversed from this zone five times, am waiting for good signal to go short.


BAC over extended and feds coming!BAC pushing up into zone. Looking to follow this one this week and see if we get rejected. FEDs will be a catalyst. Might wait til wed after announcement unless solid tell is present. Love the options chains and liquidity on this stock!

EUR/USD 1 hour entry with close below lowEarlier today I published analysis on the daily chart for this pair. After looking into it, I may enter on the 1 hour if there's a close below the 1.1016 area (dashed line), and try to ride it down to the green demand zone. Once it gets to the recent low area, I will start to really watch it and tighten my SL, as it could reverse in here as well ... You never know!

Waiting for the 1.21322 supportIf support holds price should move up to 1.2178
If support fails price should move down to 1.20929

NZD/JPY Sell Zone Thank you for checking out my Trade Idea on this Pair!
Very Strong Supply Zone on Hourly Time Frame
Set S/L Just above swing High and Target One is @ 1:1
Target Two is roughly 2:1 for now will be adjusted after TP1 is Acheived
Follow me if you are interested in more Trade Set-ups Using my Supply/Demand Price Action Zoning
-XclusiveDad Trading-

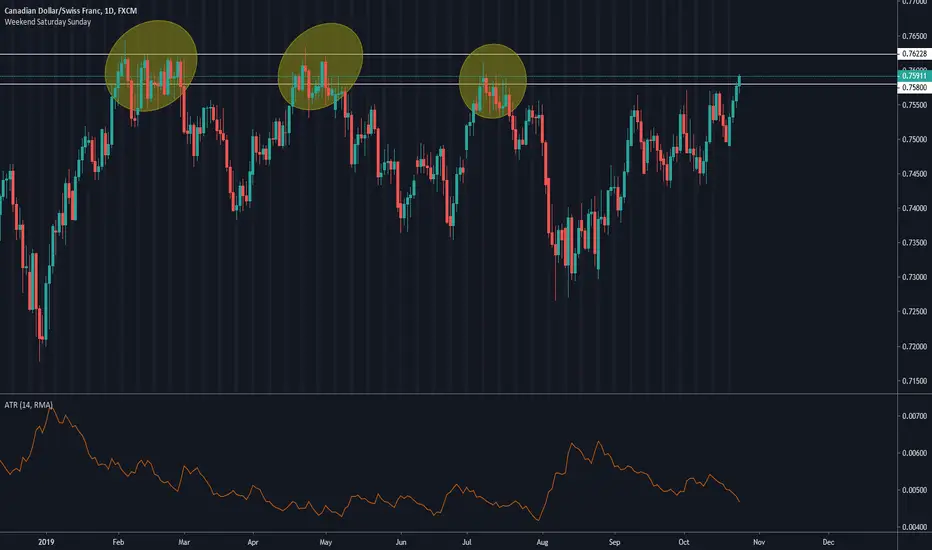
CADCHF Strong resistanceLooking at the H4 chart we see rejection at the same mark as a previous H4 swing high, resting just above this level is a major Daily zone of which we have also tapped and shot out of. I will now be looking for reason to enter short positions into this trade!

DXY Support zone and possible TP area for bullish pull backIn this chart we can see the dollar index finding support at the same area as two previous lows. You may also notice Monday closure perfectly landing on our -0.27 Fibonacci extension, furthering on we spot a daily bullish spinning top Tuesday rejecting the low zone previously mentioned and closing above the fib level! Running from the end of September 2018 we have a trend line, holding price up on multiple occasions. That is until recently, the break of this trend line came in mid June. If price manages to break back through the base of our Fib I would likely be looking for short entries between the 96.75 and 96.85 region. This not only coincides with our trend line but looking left also a decent sized mid range zone.

EURJPY, double bottom and entry into important zoneEURJPY is expected to inch higher as it has travelled up towards a pivotal zone which may create a demand push.

EURAUD Massive daily resistance and rejectionNow EURAUD is a pair I have come to build some what of a love hate relationship with over the past 6 months. Previously taking shorts at a similar level in January before being annihilated by the flash crash. Luckily I did re enter and caught a lovely 500+ pips. Anyway that's besides the point, currently we are back at this huge resistance zone, where we saw daily pinbars back to back. This along with a few other confluences prompted me to enter short position, but hey what do you know we get a lovely news release pushing us up and through the zone leaving a slight fake out. On the 18th June we then saw buyers continuing up before plummeting back down engulfing 3-4 days of previous price action! At the time of writing we have just seen another pinbar printed and left on the daily with a Doji body. This again, along with other confluences has prompted further short entries for myself!

AUDCAD SHORTTHIS PAIR HAS HAD A VERY IMPULSIVE MOVE DOWN HERE ON THE DAYLY CHART. FX:AUDCAD THIS MOVE BROKE BELOW A LEVEL OF SUPPORT THAT HAVE BEEN TESTED MULTIPLE TIMES, AND I WILL BE WAITING FOR A POSSIBLE ENRTY FROM THIS AREA


TRX sells raring to go! updated.The significant pullback has given the bears a good zone to short from, we should see price fall from here...

AUDNZD Fresh supply & demand ZonesWe are seeing that currently, we placed our fresh major supply and demand zones in our trading pair AUDNZD , It has yet tp be breached with price and hence we have an untouched zone, deemed worthy of being a confirmation for a reversal since our extension area. We are currently in a nuetral position with this trading pair and we are looking to go either long or short based off what price action is going to be telling us..
we have the coordinates on each of my zones, in (AQUA) colour so you can see exactly where my zones are...
This will be done with all my supply and demand zone analysis for today only until we exeucte our positions.
Watch and wait for either our supply and or demand zone has been Penetrated with price

