btcusdtBitcoin has officially break the zone that was varrying in for the past days and reading to go up. This zone between 58500 and 59200 is due to a fib retracement from the down trend before. I am looking for an entry after it retraces back to the zone.
Zonetrading

EOSUSDT is just startedHere is EOS analysis with USDT pair, everything is OK.
Please review bellow links, I recommended to buy EOS on 3.7$ as last oppurtunaty.

Trading Zones after pre-market drop (May the 4th be with you!)These zones were created starting with a daily chart . Previous day and overnight values mapped with colored lines. Pivots (blue lines) were established on the 1H chart with woodie points to confirm strong levels with prior volume profiles. Auto-fib levels were also used to confirm next best trade opportunities.
Morning sell off after Jerome Powell speech yesterday...

GBPJPY LONG!!I believe the price will jump and go up.
Entry 151.673
Tp 153.851
Sl Open
*I have already taken this trade and currently we are in the positive
Please trade at your own risk

May Be A Pullback Before A Bullish ContinuationLooks like a correction is happening before we continue the bull run with this pair. I missed the move paying attention due to watching higher volume pairs, But will keep an eye on it this week from here on out. When this pair moves, it MOVES. So here are the TPS I want to see the price complete when it makes a full decision where it's going.
BULL TPS
1.49803
1.50555
1.52001
BEAR TPS
1.48504
1.48060
1.47507
-

opportunity zones and next best trades 4/29These zones were created starting with a daily chart. Previous day and overnight values mapped with colored lines. Pivots were established on the 4H chart with woodie points to confirm strong levels with prior volume profiles. Auto-fib levels were also used to confirm next best trade opportunities.

sp500 mini 4/22 zones and next best trade ideas These zones were created by combining several indicators, as well as Fibonacci and volume profiles.
I started by laying out 3 point spread rectangles on high volume nodes on the volume profile , and then refined those zones based on previous consolidations. I then add overnight/intraday ranges levels, highs and lows. I map out auto-fib retracement levels (as well as reversed auto-fib levels), and 1hr woody pivots on a 1hr timeframe. I switched to standard pivots and mapped those as well. With all of these levels marked, I looked for areas where they were grouped and further refined the rectangles. I also noted where the 34/50 ema cloud vs 5/12 ema cloud are in relation to the zones.
Trade opportunities are marked in orange, looking for pullbacks and breakouts.


Es1 trade zones and next best trades for 4/18 market openThese zones are created with auto fib, pivots, woodie pivots and volume profiles

NZD to drop against the USD?Tough one to call on this due to the big move up in to the sell zone I have marked out.
Few levels of confluence, including the Fib Retracement Golden Zone, possible popular Price rejection based off fixed Range Volume Profile.
I will wait and see what type of structure gets created on lower timeframes and then decide where to enter should an probable opportunity arise, plenty of targets to aim for on both buy and sells on this one.

Finally Good News For PolkaDOT!The price has been respecting an increasing trendline since it has begun the bull run. On 22 February, the price has experienced a very strong rejection of this trendline, and also around 22 march, a rejection is noticed. All this adds confluence to the fact that this trendline has become support. From 20 February till 20 March the price has failed to break a strong support zone (drawn in grey) many times and kept bouncing between 31$ and 37$. Recently we noticed a breakout of this zone where the bullish candles closed above this zone and now the price is testing it which transforms the old resistance zone into a support zone. The price can have a bullish run either soon or until the price touches again the trendline.


GBPCAD DownI see GBPCAD for Sell ? check your analysis and take your risque , & go with the opportunity, Good luck

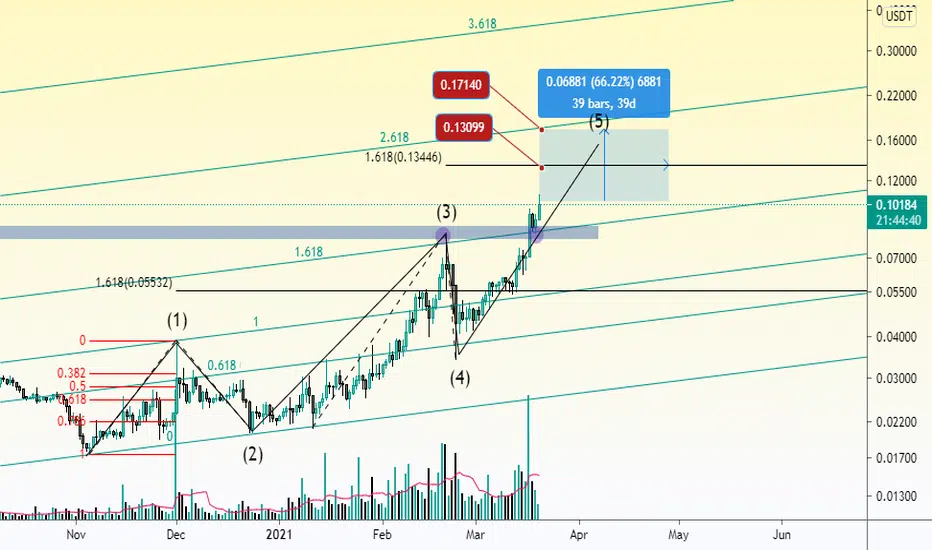
JST is going to complete its 5th Eliot wavesEverything is ready for JST, 30-60% profit can be reached in short-term
ALGOUSDT is absorbing the energy to break out of the barrierIf you have not bought Algo yet, the green zone is the best place to buy

WINGUSDT in the way of our goalsAfter a 150% super profit, WINGUSDT is going to touch 2.618 level. As I said, a storm has been happening.

Long term view of DOTReview our past analysis of Dot which attached to the post. As can be seen, we suggest buying DOT for 42.5$ target as the end of the 3rd wave. The next home for dot can be +100 $. I'm just holding my DOTs.

FILUSDT will reach to 150 $ in 2-6 next weeksThe momentum is super sharp and the next target could be 1.618 Fibonacci channel level in short-term

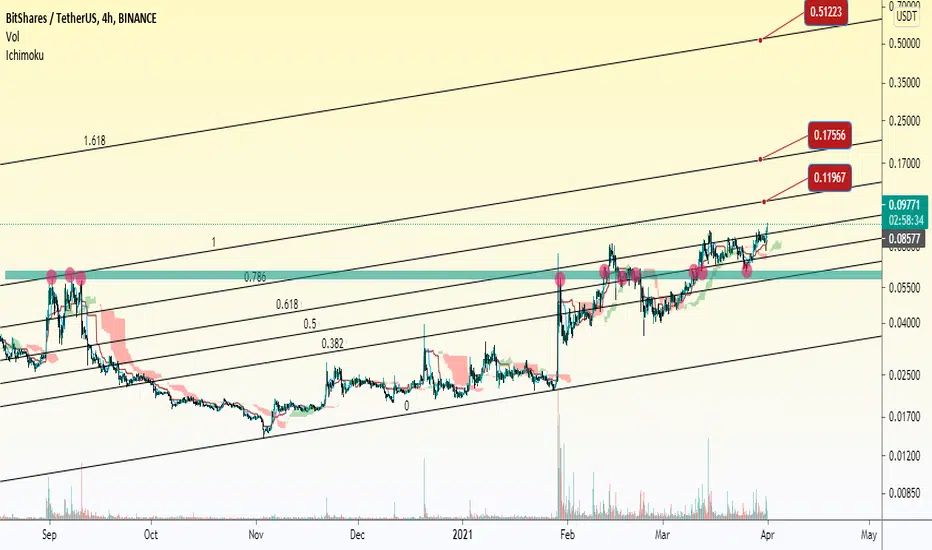
BTSUSDT can go to the moon at midterm- Price is above Ichimoku and its lines
- Fibonacci's levels are ok
- The price is above the green zone as a strong support

KMD is going to touch 2.4 and then 3.2 $!I bought 5% of my wallet capital and will sell at the targets

GBPAUD LONGI see gbpaud aud in up trend , so i take a position for buy , check your analysis and go with it good luck to every one

BTCUSDTVictory of cows against big bears
As you can see in the previous Bitcoin analysis, the trend was well predicted.
The big bear or the powerful resistance zone shown in the chart, by keeping the price below them, has caused the cows to gather and now they have enough power to wash this zone.
*** Very important point ***
If buyers or cows can keep the price of bitcoin above 57,500, we expect bitcoin to climb to the middle of the channel.
But if the big bear can win again against the cows, it will fall to the bottom of the canal.
