ZRO/USDT Breakout Watch – Ready to Rally After Being TrappedZRO is currently in a technically significant phase. After months of relentless selling pressure, the price action is now forming a classic Descending Triangle, and price is testing the upper boundary of this structure. A breakout from this zone could trigger a strong bullish reversal with multi-stage targets ahead.
🧩 Pattern Structure & Price Action:
📐 Descending Triangle (Potential Reversal)
Lower Highs have been forming since November 2024.
Strong horizontal support at $1.90 – $2.00, tested multiple times.
Price volatility is compressing, which often precedes a breakout.
This pattern is often considered bearish, but in this extended downtrend context, it can become a bullish reversal pattern if price breaks out to the upside with strong volume.
📊 Key Zones & Target Levels if Breakout Happens:
1. 🔹 $2.30 – Breakout confirmation zone (trendline break).
2. 🔹 $2.73 – Minor resistance from previous structure.
3. 🔹 $3.31 – Strong psychological and historical resistance.
4. 🔹 $5.02 – Primary breakout target based on pattern height.
5. 🔹 $6.06 – $6.50 – Mid-term extension target based on Fibonacci and prior supply zone.
6. 🔹 $7.17 – $7.56 – Extended bullish target in case of strong rally continuation.
🟢 Bullish Scenario:
If price breaks out with a strong daily close above $2.30 accompanied by volume:
Buyers gain control.
Descending triangle becomes a launchpad for upward momentum.
Gradual rally toward $5 and beyond becomes very likely over the next few weeks.
🔴 Bearish Scenario:
If price fails to break the resistance and instead drops below $1.90:
Price could fall toward $1.60 as near-term support.
If bearish pressure continues, price may test the $1.48 support zone (previous local bottom).
Structure remains bearish until significant buying pressure returns.
🧭 Conclusion:
ZRO is at a critical decision point. A clean breakout from this pattern could be the beginning of a major recovery rally. However, failure to break resistance could lead to another leg of consolidation or downside. This is a high-opportunity setup for traders watching for volume and confirmation.
#ZRO #ZROUSDT #CryptoBreakout #TechnicalAnalysis #AltcoinSeason #CryptoTrading #DescendingTriangle #ReversalPattern #ChartAnalysis
Zrousdtperp
#ZRO/USDT#ZRO
The price is moving within a descending channel on the 1-hour frame, adhering well to it, and is heading for a strong breakout and retest.
We have a bounce from the lower boundary of the descending channel, this support at 1.71.
We have a downtrend on the RSI that is about to be broken and retested, supporting the upside.
There is a major support area in green at 1.70, which represents a strong basis for the upside.
Don't forget a simple thing: ease and capital.
When you reach the first target, save some money and then change your stop-loss order to an entry order.
For inquiries, please leave a comment.
We have a trend to hold above the 100 Moving Average.
Entry price: 1.764
First target: 1.795
Second target: 1.858
Third target: 1.912
Don't forget a simple thing: ease and capital.
When you reach the first target, save some money and then change your stop-loss order to an entry order.
For inquiries, please leave a comment.
Thank you.
#ZRO/USDT#ZRO
The price is moving within a descending channel on the 1-hour frame and is expected to break and continue upward.
We have a trend to stabilize above the 100 moving average once again.
We have a downtrend on the RSI indicator that supports the upward move with a breakout.
We have a support area at the lower boundary of the channel at 1.65, acting as strong support from which the price can rebound.
We have a major support area in green that pushed the price higher at 1.58.
Entry price: 1.69
First target: 1.75
Second target: 1.82
Third target: 1.90
To manage risk, don't forget stop loss and capital management.
When you reach the first target, save some profits and then change your stop order to an entry order.
For inquiries, please comment.
Thank you.
#ZRO/USDT#ZRO
The price is moving within a descending channel on the 1-hour frame, adhering well to it, and is heading towards a strong breakout and retest.
We are experiencing a rebound from the lower boundary of the descending channel, which is support at 2.10.
We are experiencing a downtrend on the RSI indicator that is about to be broken and retested, supporting the upward trend.
We are heading towards stability above the 100 Moving Average.
Entry price: 2.16
First target: 2.21
Second target: 2.23
Third target: 2.26
#ZRO/USDT#ZRO
The price is moving within a descending channel on the 1-hour frame, adhering well to it, and is heading toward a strong breakout and retest.
We are experiencing a rebound from the lower boundary of the descending channel, which is support at 2.34.
We are experiencing a downtrend on the RSI indicator that is about to be broken and retested, supporting the upward trend.
We are heading toward stability above the 100 Moving Average.
Entry price: 2.36
First target: 2.40
Second target: 2.44
Third target: 2.48
ZROUSDT to bounce from weekly supportZROUSDT is currently ranging between weekly resistance WR1 and weekly support WS1.
I expect the price to trade in this range, more around WS1, and then dip into WS1 before boucing towards WR1 zone.
Therefore, any dip into the WS1 zone presents a good long opportunity.
#ZRO/USDT#ZRO
The price is moving within a descending channel on the 1-hour frame, adhering well to it, and is heading toward a strong breakout and retest.
We are seeing a bounce from the lower boundary of the descending channel, which is support at 2.41.
We have a downtrend on the RSI indicator that is about to be broken and retested, supporting the upward trend.
We are looking for stability above the 100 Moving Average.
Entry price: 2.69
First target: 2.82
Second target: 2.98
Third target: 3.17
#ZRO/USDT#ZRO
The price is moving within a descending channel on the 1-hour frame, adhering well to it, and is heading for a strong breakout and retest.
We are experiencing a rebound from the lower boundary of the descending channel, which is support at 2.85
We are experiencing a downtrend on the RSI indicator that is about to be broken and retested, supporting the upward trend.
We are looking for stability above the 100 Moving Average.
Entry price: 2.87
First target: 3.052
Second target: 3.211
Third target: 3.423
#ZRO/USDT#ZRO
The price is moving within a descending channel on the 1-hour frame, adhering well to it, and is heading for a strong breakout and retest.
We are seeing a bounce from the lower boundary of the descending channel, which is support at 2.38.
We have a downtrend on the RSI indicator that is about to be broken and retested, supporting the upward trend.
We are looking for stability above the 100 moving average.
Entry price: 2.46
First target: 2.533
Second target: 2.636
Third target: 2.75
#ZRO/USDT#ZRO
The price is moving in a descending channel on the 1-hour frame and is expected to continue upward.
We have a trend to stabilize above the 100 moving average once again.
We have a downtrend on the RSI indicator, supporting the upward move with a breakout.
We have a support area at the lower boundary of the channel at 2.95.
Entry price: 2.98
First target: 3.04
Second target: 3.10
Third target: 3.19
#ZRO/USDT#ZRO
The price is moving within a descending channel on the 1-hour frame and is expected to break and continue upward.
We have a trend to stabilize above the 100 moving average once again.
We have a downtrend on the RSI indicator that supports the upward move with a breakout.
We have a support area at the lower limit of the channel at 2.284, which acts as strong support from which the price can rebound.
Entry price: 2.92
First target: 2.98
Second target: 3.10
Third target: 3.20
#ZRO/USDT#ZRO
The price is moving within a descending channel on the 1-hour frame and is expected to break and continue upward.
We have a trend to stabilize above the 100 moving average once again.
We have a downtrend on the RSI indicator, which supports the upward move by breaking it upward.
We have a support area at the lower limit of the channel at 2.60, acting as strong support from which the price can rebound.
Entry price: 2.68
First target: 2.72
Second target: 2.77
Third target: 2.84
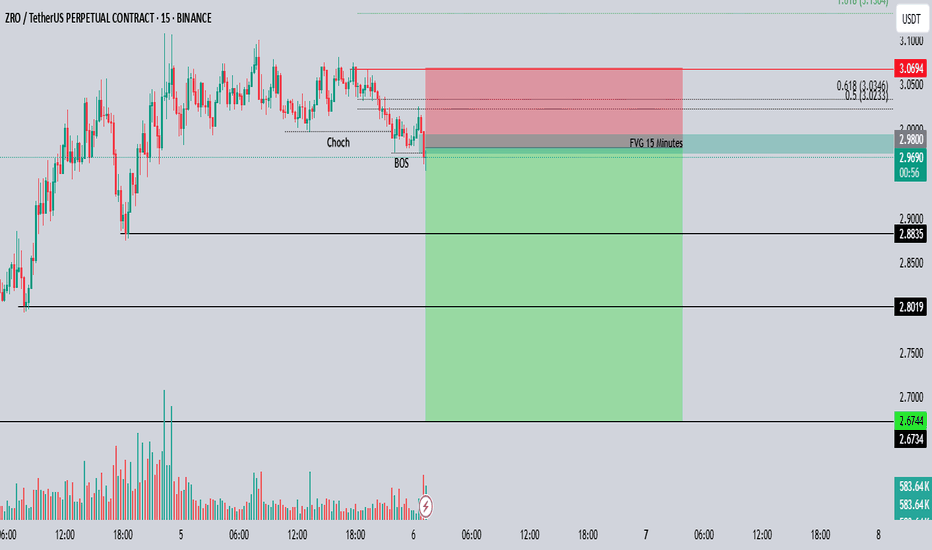
ZROUSDT – Short SetupI'm taking a short position on #ZROUSDT after a Break of Structure (BOS) confirmed a shift in market direction, following a Change of Character (Choch).
Price retraced into the 15-minute Fair Value Gap (FVG) and tapped into the premium zone near the 0.5–0.618 Fibonacci level, offering a good entry for a short setup.
Entry: Around 2.98
Stop Loss: Above 3.07
Target: 2.88 - 2.8 - 2.67
Risk/Reward Ratio: 1:3.4
Waiting for follow-through to the downside. Trade safe and always manage your risk.
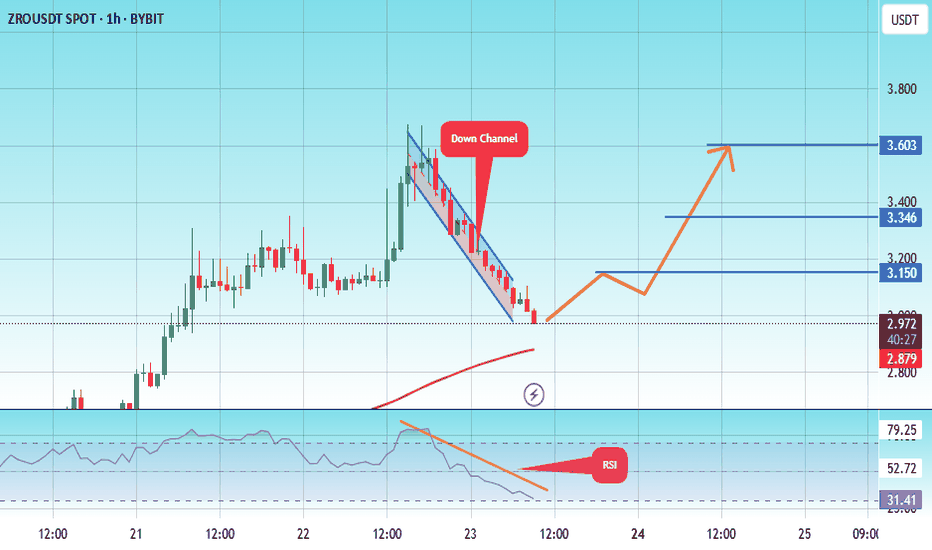
#ZRO/USDT#ZRO
The price is moving within a descending channel on the 1-hour frame, adhering well to it, and is heading for a strong breakout and retest.
We are seeing a bounce from the lower boundary of the descending channel, which is support at 2.93.
We have a downtrend on the RSI indicator that is about to be broken and retested, supporting the upward trend.
We are looking for stability above the 100 Moving Average.
Entry price: 2.98
First target: 3.15
Second target: 3.35
Third target: 3.60
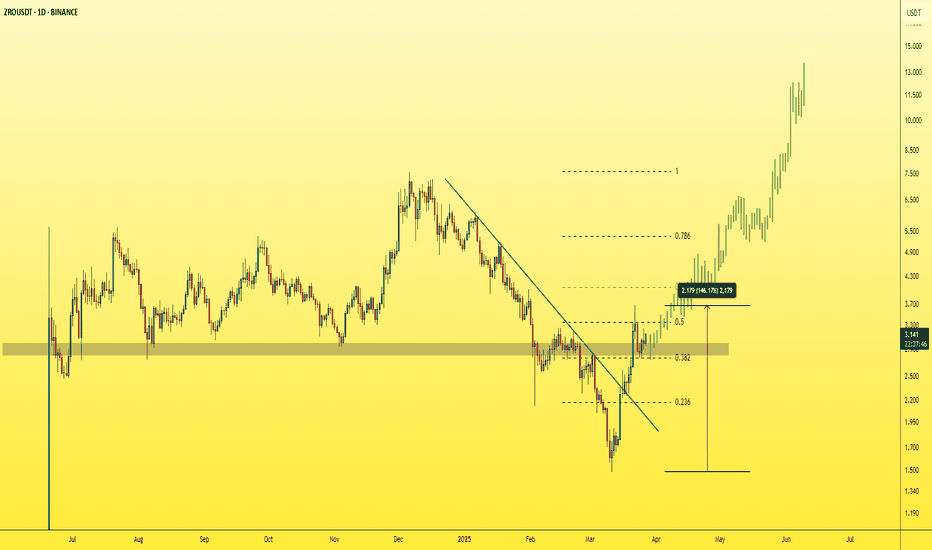
ZROUSDT - The star of this season!The coin has surged 150% in recent days, despite the overall bearish and depressing market.
This is a strong indication of momentum and growing hype around this coin. The daily chart shows stability at a key support level, highlighted in gray.
-It broke a major downtrend line that had been in place for over 3 months and successfully retested it.
-Long-term targets look extremely bullish, with massive upside potential.
-Holding this key support makes it a perfect entry point for buyers.
-Price projection suggests a reverse H&S pattern completion, followed by a breakout and continuation to the upside.
Everything looks perfectly aligned on the chart!
best regards Ceciliones🎯
#ZROUSDT - Target Locked, Course Set!Hey there, everyone! I’m here with a fresh-off-the-press analysis for #ZROUSDT. 🔥
We’ve got a trend breakout on the 15m and 30m charts. To keep it short—taking profits around the 2.12 level and heading out! 🚀
Good luck, legends!
What do you think about my analysis? Drop your thoughts in the comments and let’s discuss!
Manage your risk, stay in the game! 🎯🔥
#AlyAnaliz #TradeSmart #CryptoVision #ZROUSDT
#ZRO/USDT#ZRO
The price is moving in a descending channel on the 1-hour frame and is adhering to it well and is heading to break it upwards strongly and retest it
We have a bounce from the lower limit of the descending channel, this support is at a price of 17.
We have a downtrend on the RSI indicator that is about to break and retest, which supports the rise
We have a trend to stabilize above the moving average 100
Entry price 2.21
First target 2.32
Second target 2.44
Third target 2.54
#ZRO/USDT#ZRO
The price is moving in a descending channel on the 1-hour frame and is adhering to it well and is heading to break it strongly upwards and retest it
We have a bounce from the lower limit of the descending channel, this support is at a price of 2.00
We have a downtrend on the RSI indicator that is about to break and retest, which supports the rise
We have a trend to stabilize above the moving average 100
Entry price 2.02
First target 2.07
Second target 2.12
Third target 2.18
#ZRO/USDT#ZRO
The price is moving in a descending channel on the 1-hour frame and is adhering to it well and is heading to break it strongly upwards and retest it
We have a bounce from the lower limit of the descending channel, this support is at a price of 2.88
We have a downtrend on the RSI indicator that is about to break and retest, which supports the rise
We have a trend to stabilize above the Moving Average 100
Entry price 2.92
First target 3.03
Second target 3.12
Third target 3.23


