ZRX possible head and shoulderslooks like head and shoulders is forming
macd looks to be heading back to the upside
hopefully bitcoin plays ball as its been ruining possible ideas
Zrx

ZRX about to leave accumulation zone.ZRX is clearly ending a long year accumulation range, which will lead to a massive breakout.
Be safe.

ZRX/USD- High Targets This month!One to put on your watch list for the rest of the month.
ZRX has now broken from trend.
Looking for an entry at a few possible levels.
Indicators suggest the need for a pull back before continuation.
Not financial advice, just thoughts and TA
Any thoughts and feedback welcomed.
Bingaz

ZRX/BTC downtrend broken, bull pennant, possible support retestAs we can, ZRX has broken both its short-term and long-term resistance and is currently forming a bull pennant. I am expecting it to make a decent move up and test its current high but it is likely, it won't break and the reason for my thinking there is that it has not retested the symmetrical triangle it broke up from for support which has additional confluence with both 100 & 200 DMA coinciding with it. Although, it is possible that it breaks up from the current pennant and keeps making higher highs, starting a new uptrend, I would rather be cautious..So, if I were in it, I would sell its test towards its current top and take profit there AND THEN see if it breaks its current high or not and based on that make my decision to either re-enter upon breaking current high or WAIT and buy lower when it retests the triangle & the 2 strong MAs for support.
I AM NOT A FINANCIAL ADVISER, DO YOUR OWN RESEARCH!
ZRXUSD Who knows...I'm having a hard time figuring the move on this new triangle.. volume is steady...RSI in the 50's.. up in the air honestly..

ZRX - BTC My AnalysisI am looking short position for bullish on ZRX/BTC I am trying to buy between 0.000035 - 0,000036 BTC Stop Loss : 0,000034
Potencionalny bullish 0,000038
Guys don't forget to Click Like button for appreciate me.
Thank you so much.

$ZRX Huge Upside Potential Gain
Looking at $ZRX (0x) on the daily timeframe
Again just like almost all the other altcoins i'm currently trading, ZRX has been in accumulation for about a yaer and the longer the accumulation period, he higher the price will slingshot up
Accumulation zone is between 3100-3500 both marked out well respected weekly support levels
The price spiked up randomly to our 1st disyribution target at 5400 sats to a T and now back down into the accumulation zone
Great entry along 3550 weekly level, this is a newly found support level after touching our 1st distribution target
I have tight stops at 3550 around 2-3% drawdown, as opposed to a 11-12% drawdown because price still has the possibility of retouching 3100 sats before it goes back up
1st sell target at 5400
2nd sell target at 7915
Please be patient with this coin, again this is on a daily chart and this coin just broke out of a 1-year accumulation period so it's going to take a little bit of time for the trend to reverse. Keep a close eye on this coin if you aren't already
0x is an open protocol for decentralized digital asset exchanges that runs on the Ethereum blockchain as an ERC-20 token
0x protocol essentially is a standard messaging format and suite of smart contracts based on which the transacting entities can exchange digital assets or tokens

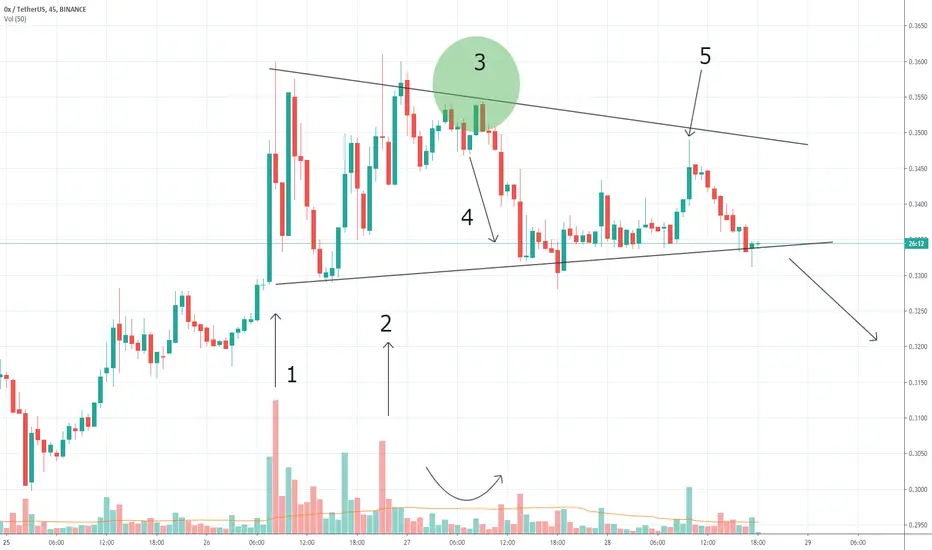
Bearish triangleZrx looks very weak on this 45m chart.
You see 1-2 bars with the maximum volume, I highlighted them with two arrows, they have a maximum above the level of 0.35. However, these extremely high volumes on attempts to rise can mean hidden weakness.
Most likely, hidden professional selling occurred around 0.35 because at point 3 there is trading on very small volumes near the resistance level. This means a weak market and a lack of demand.
Arrow number 4 indicates a surge in volumes amid falling prices - a typical occurrence for selling pressure. Sellers come out of the shadows.
A burst of activity on arrow number 5 indicates a bull trap. This is a fraudulent movement that often occurs on the eve of decline.
Thus, we can most likely say that the chart tells us a bearish story. Several attempts to establish a bullish trend were not successful, therefore, a bearish breakdown of the triangle in this situation looks like the most logical development.

0x ZRX/BTC Triangle Breakout Potential 35% + short term profit0x has been undergoing a consolidation phase over the last 2 weeks after its meteoric rise.
We can observe a clear breakout attempt over the past day, as higher term frame indicators have reset and look to be ready for a new leg up.
It currently just finished a candle close above the 50ema on the 4hr chart, which is a very promising sign for potential continuation.
RSI approaching bullish territory.
Macd cross + first green histogram bar printed on the 8hr.
Daily stoch rsi has all but bottomed out and finally made a cross upwards. Potential points of profit are indicated in green.
All positive signs.
With the rest of the alt coin market going massively bull, this may be ZRX's time to shine and potentially set new highs.
Stop loss indicated in red.
This is not trading advice.

district0x DNT High rollerWELL WELL WELL DO FELL THE HOT AIR COINBASE IS REGULATED IN THE USA SO THEY CAN ONLY TRADE COINS THAT ARE NOT GOING TO GET THEM IN TROUBLE.

ZRX/USDT - sellers dominateLook at the candles sellers dominate. The fuse at the top is a sign of the seller.
It all depends on the BTC. It can change the mood in the market if one candlestick gives up.
ZRX/USD such a triangle looks down.
The indicators show the weakness of the asset.
Break-down support (key level) and move down.
Cancel downwards, going beyond the 0.37$ level.
Push ❤️ if you think this is a useful idea!
Before to trade my ideas make your own analysis.
Thanks for your support!

ZRX / BTC Trade setupZRXBTC is forming an AB=CD pattern which gives us the famous Gartley pattern. (Correction in chart)
- Unless there's a sign of a reversal at 3438 sats i'm short for now.
- Buy at 2929 sats for entry. Target would be either a 38.2 or a 61.8% retrace from the local high.

ZRX(0X) COIN : BITCOIN for BINANCECoin name: ZRXBTC
‼️ Buy Price: Above 4200
🎯 Target 👇
✅4300
✅4400
✅4500
✅4600
🕹 Stop Loss : 4020
Thanks

ZRX Descending Triangle ZRX has a clear descending triangle . The one hour chart shows several key bearish candlestick patters, most recently a hanging man candle stick. There is resistance around 0.36, however looking on the day chart, the RSI is completely maxed out around 80 at the time of writing this. It is certainly possible we retest the 0.50 cent area, on the 1 week chart there is major resistance around 0.55 cents.
Please do not trade based on this information. What do you guys think about ZRX?
Thanks,
- Max K.

ZRX Hits my short term targetWill the breakout continue?
If the spiral breaks which it probably will all hell breaks loose
Breakout is a result of a falling wedge
Moonshot may hit the spiral top

0x Looks Ready, Breaking Above ResistanceThe day started strongly for 0x (ZRXBTC) with a very strong green candle.
Today alone prices have grown by as much as 22% with the potential of going higher.
The downtrend line based on candle close is already being conquered but this signal is only confirmed when the daily candle closes above it.
This is the dotted purple line.
We are very likely to see ZRXBTC growing with good easy in the weeks to come.
Namaste.

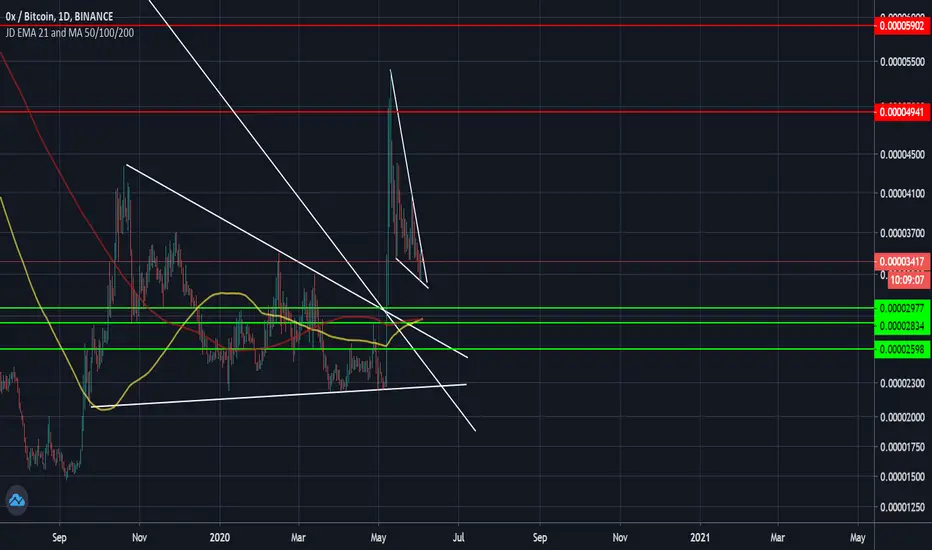
ZRX/BTC 123% Profit within 4 Days with Head & Shoulder Pattern#ZRXBTC 122% Profit Update:
#ZRX now 122% up from our Entry.
Potential H&S worked very well.
I Closed my All position at 4898 Sat.
hope you also booked handsome profit.
Congrats guys you booked huge profit as I told you.
Please Click Like button and share my IDEAS.
Please dont forget to LIKE and Follow me.
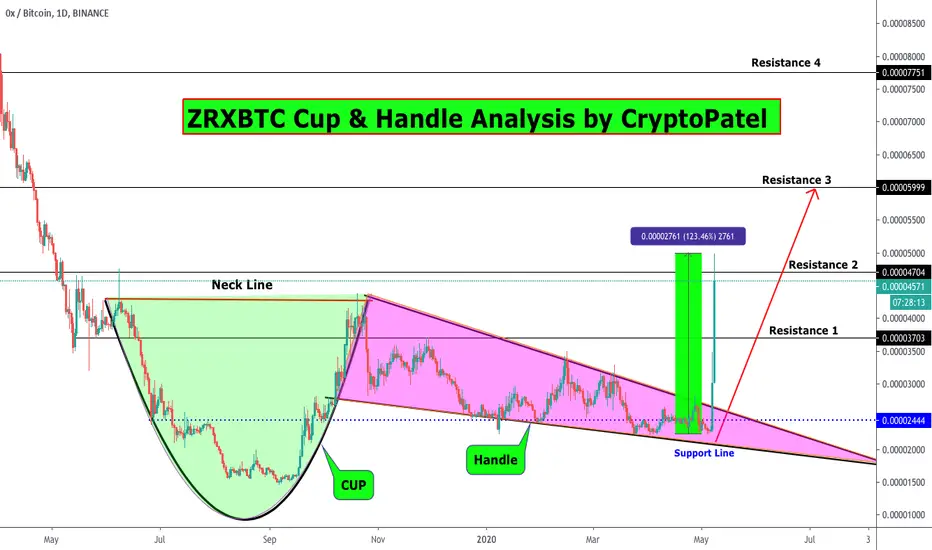

ZRX/BTC Strong Cup & Handle Pattern so 400% potential for me#ZRXBTC Strong Bullish Cup & Handle Pattern TA:
As per chart ZRX/BTC looks very bullish.
#ZRX Looks very Bullish now I am accumulating because Very Strong Cup & Handle Pattern.
I will accumulate every dip and loaded my full bags.
Please track every update on my Twitterr.
but if any candle close bellow 2100 Satoshi then I will exit.
My Entry will be 2100-2300 Sat
Targets: 3703/4704/5990 Sat
Target 1: 3703 Satoshi
Target 2: 4704 Satoshi
Target 3: 5990 Satoshi
Target 4: 7700 Satoshi
Please like and follow me for latest crypto updates.
please please like my ideas guys dont forget to like because your like = I motivate.
Thank you

ZRX/BTC 56% Profit in This Bear Market Now take profit Partially#ZRXBTC Strong Bullish Cup & Handle Pattern TA:
As per chart ZRX/ BTC looks very bullish .
ZRXBTC now went up to 3488 Satoshi.
#ZRX Looks very Bullish I was accumulating Much ZRX at Very Strong Cup & Handle Pattern support.
Now I booked 50% profit from ZRXBTC.
I told you I accumulate every dip and loaded my full bags.
Please track every update on my Twitterr.
My Entry was between 2100-2300 Sat
Targets: 3703/4704/5990 Sat
Target 1: 3703 Satoshi
Target 2: 4704 Satoshi
Target 3: 5990 Satoshi
Target 4: 7700 Satoshi
Please like and follow me for latest crypto updates.
please please Click LIKE button on My ideas guys don't forget to like because your like = I motivate.
Thank you


Possible H&S ??Looking at the day chart, a H&S pattern might be forming. This seems to be supported by a high RSI.
What do you all think?
- Max K.
