There is a possibility for the beginning of an uptrend in ZRXUSDTechnical analysis:
. 0x/US Dollar is in a range bound and the beginning of uptrend is expected.
.The price is above the 21-Day WEMA which acts as a dynamic support.
. The RSI is at 63.
Trading suggestion:
. There is a possibility of temporary retracement to suggested support zone (0.2220 to 0.1710). if so, traders can set orders based on Price Action and expect to reach short-term targets.
Beginning of entry zone (0.2220)
Ending of entry zone (0.1710)
Entry signal:
Signal to enter the market occurs when the price comes to " Buy zone " then forms one of the reversal patterns, whether " Bullish Engulfing ", " Hammer " or " Valley " in other words, NO entry signal when the price comes to the zone BUT after any of reversal patterns is formed in the zone. To learn more about " Entry signal " and the special version of our " Price Action " strategy FOLLOW our lessons :
Take Profits:
TP1= @ 0.29555
TP2= @ 0.36510
TP3= @ 0.46000
TP4= @ 0.55880
TP5= @ 0.69000
TP6= @ 0.81350
TP7= @ 1.01900
TP8= @ 1.22300
TP9= @ 1.88880
TP10= Free
Zrx

There is a possibility for the beginning of an uptrend in ZRXUSDTechnical analysis:
. 0x/US Dollar is in a range bound and the beginning of uptrend is expected.
.The price is above the 21-Day WEMA which acts as a dynamic support.
. The RSI is at 63.
Trading suggestion:
. There is a possibility of temporary retracement to suggested support zone (0.2220 to 0.1710). if so, traders can set orders based on Price Action and expect to reach short-term targets.
Beginning of entry zone (0.2220)
Ending of entry zone (0.1710)
Entry signal:
Signal to enter the market occurs when the price comes to " Buy zone " then forms one of the reversal patterns, whether " Bullish Engulfing ", " Hammer " or " Valley " in other words, NO entry signal when the price comes to the zone BUT after any of reversal patterns is formed in the zone. To learn more about " Entry signal " and the special version of our " Price Action " strategy FOLLOW our lessons :
Take Profits:
TP1= @ 0.29555
TP2= @ 0.36510
TP3= @ 0.46000
TP4= @ 0.55880
TP5= @ 0.69000
TP6= @ 0.81350
TP7= @ 1.01900
TP8= @ 1.22300
TP9= @ 1.88880
TP10= Free


ZRXBTC Strongly Bullish Cup&Handle Pattern#ZRXBTC Cup&Handle:
#ZRX Brokeout Resistance.
if 3 Days candle Also close above Resistance level then I will Strongly Bullish.
Now current Price is 2900 Satoshi.
if big spike coming Then we can expect 50%-100%.
entry also given in Chart.
Stop loss Must use guys.
Because if BTC Dominance Will increase then alt may go down.
So don't Take risk with your fund.
stop loss is very important .
Keep an eye on every updates.
Please like and follow me for latest crypto updates.
Thank you

0x (ZRX) - Signal by EXCAVOZRXBTC After Impulse formed falling wedge and now we break out resistance line.
RSI - growing
I see accumulation zone inside this wedge
Bitcoin dominance goes down and 0x coin with great growth potential and still no pump
Best regards EXCAVO

ZRX/BTC Cup & Handle Pattern Strongly Bullish#ZRXBTC Cup&Handle Pattern:
#ZRX now Strongly bullish and Brokeout Handle Resistance also
Entry: 2619-2800 Sat
Targets: Resistance
SL: 2550 Sat
if any candle close bellow Red trend line then I will Exit.
So I bought at Brokeout Trendline Handle Resistance.
and My Target will be Resistance.
Guys please like and follow me for latest crypto updates .
Thank you

ZRX THE BOTTOM IS IN POTENTIAL 17x PROFITS $$$$$$$$$
Hi I am MartyBoots and I've been trading the markets for 13+ years
zrx has formed a beautiful bottoming pattern , these opportunities don't happen VERY OFTEN to get in on the lows of stocks or coins that have serious potential to move into a bull market . We need to grab these opportunities with both hands .
Do not miss this video because if this pattern plays out then this is the low on ZRX before bull market moon time .
The price action and the moving averages are setting up beautifully. On top of that the indicators are also setting up .
DO NOT BE LEFT BEHIND ON THIS BEAUTIFUL CHART ---- SERIOUS GAINS TO BE MADE
Please dont forget to like my content as it helps my work
Thank you

ZRX RETEST & TIME TO RISE #ZRXBTC
Buy at 0.000026XX
Target 0.0000318
SL 0.0000245
Risk: 4% Risk/Reward: 6

Potential BUY on ZRX/BTC Pretty nice Falling Wedge on 1 D chart
Wait for confirmation around 0.00002633 zone and Let's try Long
1 Target : 0.00003533
2 Target : 0.00004233


$ZRX : Breaking the Falling WedgeNice setup here,
$ZRX breaking up the falling wedge, need some volume
Be careful with $BTC
Not a Financial Advice

ZRX will shoot soon (Probable 35% profit safe play)ZRX recently formed a bear divergence that will continue its descent within the descending wedge shown on the chart.
Soon reaching the 2.618 of the bearish divergence formed in Oct 20th followed by the 1.618 of the recent bear divergence move.
I will keep watching and expect reversal after that to push the coin to exit the falling wedge followed by retest then around 35% fly based of the formed fibs.
Good luck to all!

ZRXBTC 4HZRX coin; on the accumulation process long since. I think we are at the bottom prices, it seems the time is coming.. Break a leg!

ZRX MA SQUEEZYou should put some attention on ZRX.
The direction is still not decided.
A close above 0.0016 ETH will open to a big green wave.
The area around the 4d 50MA was supportive for whole 2018.
The area around the 4d 100MA was resistive for the whole 2019.
We are now in 2020 and price is compressing between the two MA.
Close above 100MA = target 0.0030
Close under 50MA = target 0.0008
Good luck
BIO

$ZRX, Pushing up w/ volume after a quick retest of the ~2500sats$ZRX
Pushing up w/ volume after a quick retest of the ~2500 sats support..
UCTS Buy signal on the 1D chart, crossing above EMA50
As inmmediate target, ~3k sats resistance, If continuation happens from there, ~3.5k/~4.2k
Waiting for retest or R/S flip as entry seems better
#ZRX

ZRX - weekly bullish pennant Looks like a possible wave 1 setup. Expecting correction to last until end of month then continued major breakout of alts into Feb 2020.


ZRXBTC 4HThere is a possibility Head&Shoulder reversal on the falling wedge and looks likely to do Breakout.. And should not be ignored CUP and Bearish Cypher Pattern-probables. Good luck!

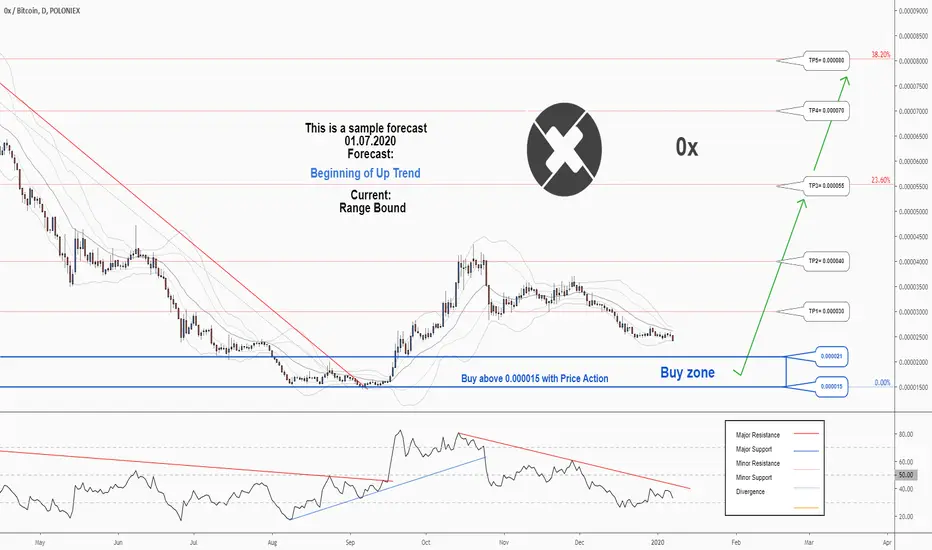
There is a possibility for the beginning of an uptrend in ZRXBTCTechnical analysis:
. 0X/BITCOIN is in a range bound and the beginning of uptrend is expected.
. The price is below the 21-Day WEMA which acts as a dynamic resistance.
. The RSI is at 34.
Trading suggestion:
. There is a possibility of temporary retracement to suggested support zone (0.000021 to 0.000015). if so, traders can set orders based on Price Action and expect to reach short-term targets.
Beginning of entry zone (0.000021)
Ending of entry zone (0.000015)
Entry signal:
Signal to enter the market occurs when the price comes to " Buy zone " then forms one of the reversal patterns, whether " Bullish Engulfing ", " Hammer " or " Valley " in other words, NO entry signal when the price comes to the zone BUT after any of reversal patterns is formed in the zone. To learn more about " Entry signal " and the special version of our " Price Action " strategy FOLLOW our lessons :
Take Profits:
TP1= @ 0.000030
TP2= @ 0.000040
TP3= @ 0.000055
TP4= @ 0.000070
TP5= @ 0.000080
TP6= @ 0.000100
TP7= @ 0.000121
TP8= @ 0.000149
TP9= @ 0.000186
TP10= Free
ZRXBTC Awkward H&SBoth LENDBTC and ZRXBTC have formed an awkward H&S. Lend however has gone on a massive bull run, will the same occur with zrx? It can be observed that zrx has formed an inverted descending scallop, while Lend has formed just a descending scallop.


