There is a possibility for the beginning of an uptrend in ZRXUSDTechnical analysis:
. 0x/US Dollar is in a range bound and the beginning of uptrend is expected.
. The price is below the 21-Day WEMA which acts as a dynamic resistance.
. The RSI is at 56.
Trading suggestion:
. There is a possibility of temporary retracement to suggested support zone (0.203000 to 0.137800). if so, traders can set orders based on Price Action and expect to reach short-term targets.
Beginning of entry zone (0.203000)
Ending of entry zone (0.137800)
Entry signal:
Signal to enter the market occurs when the price comes to " Buy zone " then forms one of the reversal patterns, whether " Bullish Engulfing ", " Hammer " or " Valley " in other words, NO entry signal when the price comes to the zone BUT after any of reversal patterns is formed in the zone. To learn more about " Entry signal " and the special version of our " Price Action " strategy FOLLOW our lessons :
Take Profits:
TP1= @ 0.270000
TP2= @ 0.360000
TP3= @ 0.460000
TP4= @ 0.558800
TP5= @ 0.690000
TP6= @ 0.813500
TP7= @ 1.019000
TP8= @ 1.223000
TP9= Free
Zrx

There is a possibility for the beginning of an uptrend in ZRXUSDTechnical analysis:
. 0x/US Dollar is in a range bound and the beginning of uptrend is expected.
. The price is below the 21-Day WEMA which acts as a dynamic resistance.
. The RSI is at 56.
Trading suggestion:
. There is a possibility of temporary retracement to suggested support zone (0.203000 to 0.137800). if so, traders can set orders based on Price Action and expect to reach short-term targets.
Beginning of entry zone (0.203000)
Ending of entry zone (0.137800)
Entry signal:
Signal to enter the market occurs when the price comes to " Buy zone " then forms one of the reversal patterns, whether " Bullish Engulfing ", " Hammer " or " Valley " in other words, NO entry signal when the price comes to the zone BUT after any of reversal patterns is formed in the zone. To learn more about " Entry signal " and the special version of our " Price Action " strategy FOLLOW our lessons :
Take Profits:
TP1= @ 0.270000
TP2= @ 0.360000
TP3= @ 0.460000
TP4= @ 0.558800
TP5= @ 0.690000
TP6= @ 0.813500
TP7= @ 1.019000
TP8= @ 1.223000
TP9= Free

ZRXBTC Bullish Ascending triangleAscendding triangle is typical of its break out from this formation. Target is Height of ascending formation + there is Fib. Extension 1,01 - 1,238. If ZRX will pushing hard, bullish target can be 1,618 Extension. Targets, Stop Loss, Trend Lines, Fib. Extension in chart :)

ZRX 60% profit?!!!!BINANCE:ZRXUSDT
hello every one
It's been a time since I made a statement due to the volatility of BTC
and being busy on making my own VIP channel...
so as you can see we have a n ascending triangle on zrx
we have huge support between 0.11990 to 0.2050
the RSI is dropping below 50 . I hope for a 30 rsi so we shall see the zrx below 0.2000
I suggest u guys buy below 0.2000
and put a stop loss bellow 0.1940 depending on a risk u wanna take
If u wanna be sure about the bull run u could stay till the zrx passes 0.2347 and have a profit of 30%
but if u wanna be risky and take more profit u could easily buy below 0.2 and we shall have a nice run 0.31 and take a 60 % profit
if u like my trades please like the post
and follow me

ZRX/BTC buy today 2/10/2019Warning (I'm not Pro)
ZRX/BTC may go up for next 2 days Best time to buy.


$ZRX, Retesting ~2450 sats level after crossing it...$ZRX
Retesting ~2450 sats level after crossing it to the upside...
If it hodls/bounce from here flipping it into support then we can aim for a ~3k sats push
Volume rised over the last days
UCTS Buy signal active on the 1D
#ZRX


ZRXUSD likely to fail in breaking down 100 SMAThe priceline of ZRX / US Dollar is likely to form a bullish gartley.
Initial X to A was not able to break 200 simple moving average resistance and now the B to C leg is hitting the 100 SMA resistance and likely to fail in break out.
Volume profile is showing less interest of traders here.
MACD turned weak bullish from strong bullish, but stochastic did not give bear cross sofar so we can wait for stochastic to give bear cross and then short.
I have used Fibonacci sequence to set the targets:
Sell between: 0.212765 to 0.255376
Buy between: 0.194078 to 0.174767
Regards,
Atif Akbar (moon333)

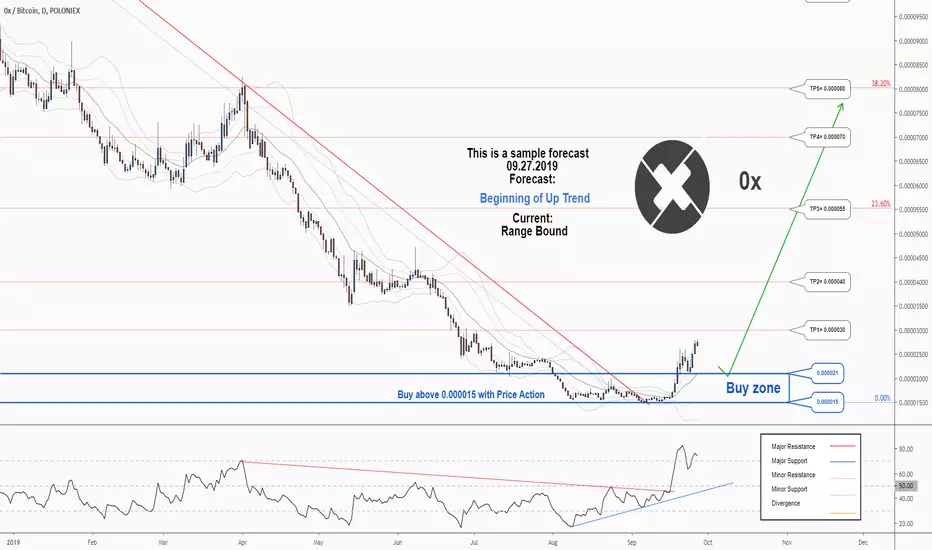
There is a possibility for the beginning of an uptrend in ZRXBTCTechnical analysis:
. 0X/BITCOIN is in a range bound and the beginning of uptrend is expected.
.The price is above the 21-Day WEMA which acts as a dynamic support.
. The RSI is at 77.
The RSI downtrend & The price downtrend in the daily chart are broken, so the probability of the resumption of an uptrend is increased.
Trading suggestion:
. There is a possibility of temporary retracement to suggested support zone (0.000021 to 0.000015). if so, traders can set orders based on Price Action and expect to reach short-term targets.
Beginning of entry zone (0.000021)
Ending of entry zone (0.000015)
Entry signal:
Signal to enter the market occurs when the price comes to " Buy zone " then forms one of the reversal patterns, whether " Bullish Engulfing ", " Hammer " or " Valley " in other words, NO entry signal when the price comes to the zone BUT after any of reversal patterns is formed in the zone. To learn more about " Entry signal " and the special version of our " Price Action " strategy FOLLOW our lessons :
Take Profits:
TP1= @ 0.000030
TP2= @ 0.000040
TP3= @ 0.000055
TP4= @ 0.000070
TP5= @ 0.000080
TP6= @ 0.000100
TP7= @ 0.000121
TP8= @ 0.000149
TP9= @ 0.000186
TP10= Free
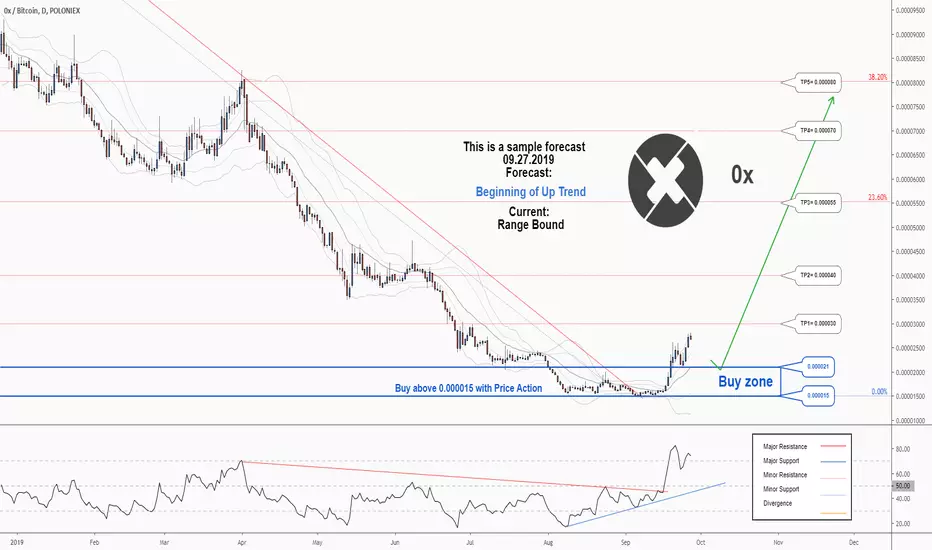

ZRXUSD has formed bullish butterfly | Upto 203% possiblePriceline os Ox / US Dollar has formed a bullish butterfly and entered in potential reversal zone.
RSI is oversold.
Price action is also hitting at the support of lower band of bollinger bands.
Volume profile of complete pattern is showing weak interest of traders within PRZ area.
From here the price action will take bullish divergence soon insha Allah.
I have used Fibonacci sequence to set the targets.
Buy between: 0.1721 to 0.1106
Sell between: 0.2199 to 0.3356
Regards,
Atif Akbar (moon333)


BATBTC: Potential Continuation. Alt Run XRP, ZRX correlation.*Not financial advice*
Previous BAT posts below. Nothing much has changed for long term outlook. There does appear to be upside potentially in the near future due to:
-ZRX, ETH have already completed their double bottom patterns
-BAT AO (momentum) has been diverging for months.
-Volume has finally resurfaced from YTD lows.
-Currently at historic price range lows (check BAT/BTC 1W chart).
Definitely a stop loss trade to manage downside.

$ZRX, Incoming V3.0 launch on september end (opportunity)$ZRX
Incoming V3.0 launch on september end is leading to this asset to make great moves..
Currently 25% up since UCTS Buy signal (at ATL BTC support) on the 12H
Trying to flip this level into support (check 4h)
If succeed (++volume) EMA200 as target matching ~2400 sats
$ZRX

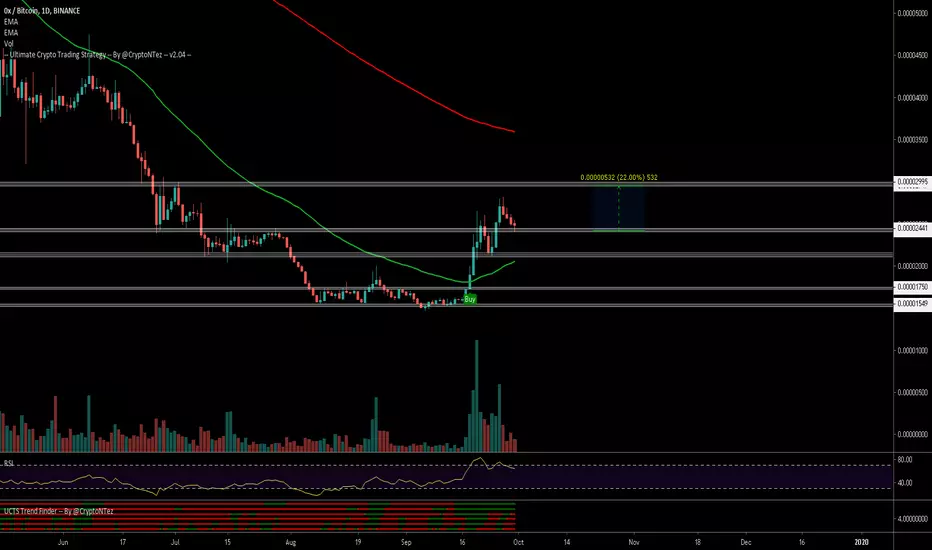
0x Is Growing But Can Easily Do 100%+ MoreWe caught 0x (ZRXBTC) early and we sitting on 40%+ of profits already based on our last chart setup, but additional growth is possible.
ZRXBTC is showing great volume, challenging resistance and moving higher with good momentum.
With a very strong RSI, we can see EMA100 (blue line / 0.00002387) working as resistance... If this level is broken, EMA200 (0.00003710) is next, followed by EMA300 (0.00004730).
If the bulls cannot garner enough momentum, you can expect some retrace followed by additional growth... As usual, PATIENCE IS KEY TO WIN!
Here is the previous chart (click it)...
Thanks a lot for reading.
Namaste.

0x In A Sustained Uptrend (Easy 25%+ Of Profits)0x (ZRXBTC) is now in a sustained uptrend and challenging its next resistance at 0.00001616 marked by EMA100.
On the chart above we can see higher highs and higher lows.
There is also a bullish cross of EMA10 and EMA50.
The RSI is super bullish sitting at 64.92.
The MACD is now on the bull zone and gaining momentum.
This one can move anytime.
The last low can be used as a stop-loss. We use manual stop-loss for safer trades.
Targets are marked on the chart.
Thanks a lot for reading.
Namaste.
____________
This is not financial advice.

zrx(ox)zrx have important pont =0.0000157
case 1( green way ) :if zrx can break and hold 0.0000157 btc then we can expect that zrx will go to 0.00002035
case 2(red way ) :if zrx cant break powerful 0.0000157 then i think 0.00001157 will be very very good to buy and end of correction .
good luck

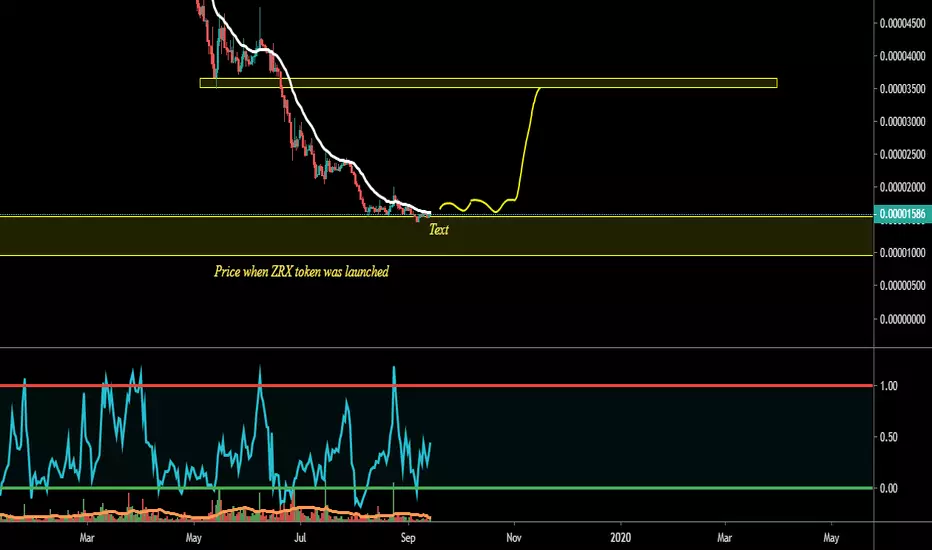
ZRX in accumulation phase ??Now, this coin has broken its all-time low and currently at the price zone when this token was distributed.
It is more than 93% down and if Bitcoin dominance increase this could be the worst performer coin.
ZRX (0X) 1400% Profit Potential ..!!ZRX (0X)
- Currently at Bottom & Holding the Support in Weekly Chart.
- Forming Bullish Pattern As Well (Falling Wedge) in Weekly..
- Indicators Are Turning Bullish & Buyers Coming in Grab it For MIDTERM/LONGTERM Berfore STORM/FOMO.
- It's One of my Favorite Project
What is 0X ??
0x is an open protocol that facilitates the decentralized exchange of Ethereum-based tokens and assets. Developers can use 0x to build their own custom exchange apps with a wide variety of user-facing applications i.e. 0x OTC, a decentralized application that facilitates trustless over-the-counter trading of Ethereum-based tokens.
Please, give us your opinion in the comments!
If you like the idea, please, hit the Like button and subscribe to the profile in order not to miss our updates.
Join Telegram Channel for more analysis - t.me
The information given is never financial advice. Always do your own research
