Looking good!$ZRX Looking good, Falling wedge inside the descending channel??. MACD About to cross, RSI coming strong from oversold levels, Buy signal from the UCTS in the 6h chart. Potential targets on the chart. (EMA50-EMA100) #0x #ZRX
Zrx

ZRX BTC - ZRX reaching logical buy zone - Good opportunityHi Friends
as you see in chart , ZRX psychological cycle of down trend is going to die , Zrx is going to hit panic sell zone again and a slow down will show up ( maybe with clear divergence) , Then ZRX will be ready to break recent trend line in one ( or may be 2 ) hit , So I think we will have great trade opportunity in few days

ZRX/BTC long termI am keen on ZRX and have had some solid trades out of this for a while but overall pretty bearish as i see this walking down further to a level of demand build on the original run up thats been tested one before we a great response.
Using some repeating fractal patterns and some fib levels that keep getting hit with each fractal i can see us walking down to that demand following by a 786 entrancement from the last level of supply.
This will take a while but there should be some solid trading opportunities with in that range on the way up imo.
Will be keeping an eye on ZRX for those trade opportunities to present them self


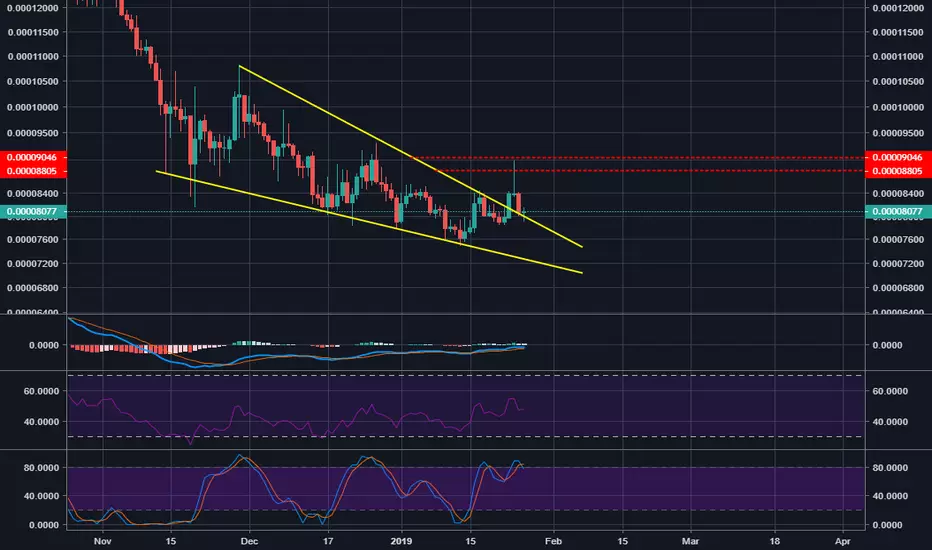
ZRXBTC POLONIEX 12H up to 08FEB19 Trading Analysis (TAZRXBTC 0x / Bitcoin POLONIEX 12H up to 08FEB19 Trading Analysis (TA)
12H Chart, 0x (ZRX) by January 23 (1), was able to break over both the 100/200 days MA signals, along with an ascending movement from 45 RSI to lightely touch the 70 RSI (2) and bounced back until below 30 RSI (3), now the RSI crossed over 40 RSI, the MACD signals pierced below the Histogram heading up, which may indicate a price movement toward the 100/200 - MA (4), which is the optimistic approach, but remember "Trees don't grow until the sky" it can find resistance and make a correction anytime. At this time the Market Cap moved toward 120b. Good Luck!
Gráfico de 12H, 0x (ZRX) hasta el 23 de enero (1), pudo cruzar subiendo las señales MA de 100/200 días, junto con un movimiento ascendente desde 45 RSI para tocar ligeramente el RSI 70 (2) y retroceder hasta abajo de 30 RSI (3), ahora la señal RSI cruzó por encima de 40 RSI, las señales MACD se cruzaron positivamente por debajo del Histograma hacia arriba, lo que puede indicar un movimiento del precio hacia el 100/200 - MA (4), que es el enfoque optimista, pero recuerde que "los árboles no crecen hasta el cielo" pueden encontrar resistencia y hacer una corrección en cualquier momento. En este momento el Market Cap se movió esta mañana hacia los 120b. ¡Buena suerte!
“I believe in analysis and not forecasting.” / "Creo en el análisis y no en el pronóstico".
REMEMBER: I am not a financial adviser nor is any content in this article presented as financial advice. The information provided in this blog post and any other posts that I make and any accompanying material is for informational purposes only. It should not be considered financial or investment advice of any kind. One should consult with a financial or investment professional to determine what may be best for your individual needs. RECUERDE: No soy un asesor financiero y el contenido de este artículo no se presenta como asesoramiento financiero. La información provista en esta publicación de blog y cualquier otra publicación que haga y cualquier material que la acompañe es solo para fines informativos. No debe considerarse asesoramiento financiero o de inversión de ningún tipo. Se debe consultar con un profesional financiero o de inversiones para determinar qué es lo mejor para sus necesidades individuales.

$ZRXUSD forward guidanceThe Cajun thinks he has a bead on a him:) Lots of things can happen but when things line up, we must take notice and not doubt Ketu (astrotalk-aka your gut). We must build the narrative, then test it. I just wish I had full access to trade crypto:)

ZRX Strong BuySetelah Penetrated DTL, Kini ZRX Re-Penetrated Di Area Supply.
Maka ini Adalah Awal Untuk Trend Bullish Bagi ZRX
Tidak Perlu Takut Ketika Sudah MenConfirmasi
Saran Buy :
- Buy Sekarang Di 7000
- Buy Ketika Koreksi Di 6800
TP Minimal : 7300
SL : 6585

ZRXBTC - REVERSAL TENDENCYBuy Price: Green Zone
SL: Red Zone
Profit: Blue zones
Invest Suggestion: 20 Percent
Profit Expectations: 10 - 30 Percent
Looking at the chart of ZRX , we could see all indicators pointing to buy it , like RSI and 13 HMA crossed all HMA's in the 4H chart( indicating a reversal tendency)!
Also, ZRX is near of the a huge support ( orange lines ).
See me previous analysis and how profitable the are!!!
Sell when you get some profit, according the way you trade.
Keep following us and please like this idea.
Any doubts? Send in the comments or in our telegram or Inbox here.
Thanks for visiting.

ZRX 17 CENT incoming! ZRX will mimic the rest of the market. 0.17 will be the heaviest support for ZRX.

ZRX / USD COULD FALL TO .21 SOONZRX on the 1 hour chart is in a downward channel! I was waiting to see if the double bottom support at the red line. The RSI is also showing a repeated trend of bouncing up after reaching the 15 range, which it is close to now. If ZRX sees a large drop to the bottom of the channel soon, we should expect to see a price around .20 - .21!
I am very much a beginner and just want to make observations and learn from them! My simple analysis is for fun and learning, please do not make trading decisions based on my observations - like I said I am just a beginner.
Thanks for reading and please follow and like my work as I grow and learn in the Crypto space!
- Max K.


ZRX looking interesting on the weekly...It's been a while, but ZRX is looking really nice on the weekly. MACD looking to cross soon. The KDJ indicator (from iamaltcoin) works very well on the weekly. I'd be very surprised if we don't see a good return over the next 2 - 3 weeks.
Target 1 - 9700 (confident)
Target 2 - 12700 (not so confident!)
Usual disclaimers apply - I'm very much an amateur who's been out of the market for a while, and always struggled on picking exits, so... not financial advice, and always check to see what BTC is doing before looking at alts.

ZRXBTC 0X #ZRX all set ready to give 70-120% profit.Previously few days we shared #ZRX and did, now again its right around breakout and good posibility to give huge profit in matter of few days.
ALL INDICATORS BULLISH
MIGHT BE A HIGH RETURN CALL
CALL TYPE : #SHORT TERM CALL (MUST HOLD FOR GOOD PROFITS).
EXCHANGE :BINANCE #ZRXBTC (BUY ZONE)
ALWAYS HOLD FOR 2ND AND 3RD WAVE TOO
Buy AROUND : AROUND 7600-7800
TARGETS
Target 1 : 8897
Target 2 : 9087
Target 3 : 9532
Target 4 : 10210-10802++
StopLoss : 7480
WHY BUY #ZRX?
Undervalued now, breakout expected very soon. Have good potential to rock again.
TA POINTS
Increase Buyer Volume & RSI started moving up.
MACD crossover in 15 min chart
4hr chart bullish to given 10-20% profit.
cyclic indicator positive.
#ZRX have strong support at 8000
If breakout occurs, expect an increase to the next resistance zone 9122

ZRX 0x POTENTIAL TREND REVERSAL 0x ZRX showing potential trend reversal, touch new HH (8985), Volume increase, MACD above zero line bullish sign. RSI above 45 point line. Strong support at 7700. Resistance at 9000.

ZRXUSD - JUST BUY IT AND PROFITBuy Price: Green Zone
SL: Red Zone
Profit: Blue zones
Invest Suggestion: 20 Percent
Profit Expectations: 10 - 50 Percent
Looking at the chart of ZRX , we could see all indicators pointing to buy it , like MACD lines, the HMA crossed(13 will cross 34) and the volume!
Pivot Reversal strategy ( it have 4.5 profit factor in ZRX) is indicating an entry too!
Also, ZRX is near of the historical low, so we have a great support to trade ( on Binance ).
See me previous analysis and how profitable the are!!!
Sell when you get some profit, according the way you trade.
Keep following us and please like this idea.
Any doubts? Send in the comments or in our telegram or Inbox here.
Thanks for visiting.


