0x ZRX Price Targets and Stop LossZRX/USDT
Entry Range: $0.51 - 0.566
Price Target 1: $0.60
Price Target 2: $0.81
Price Target 3: $1.07
Stop Loss: $0.44
ZRXUSD

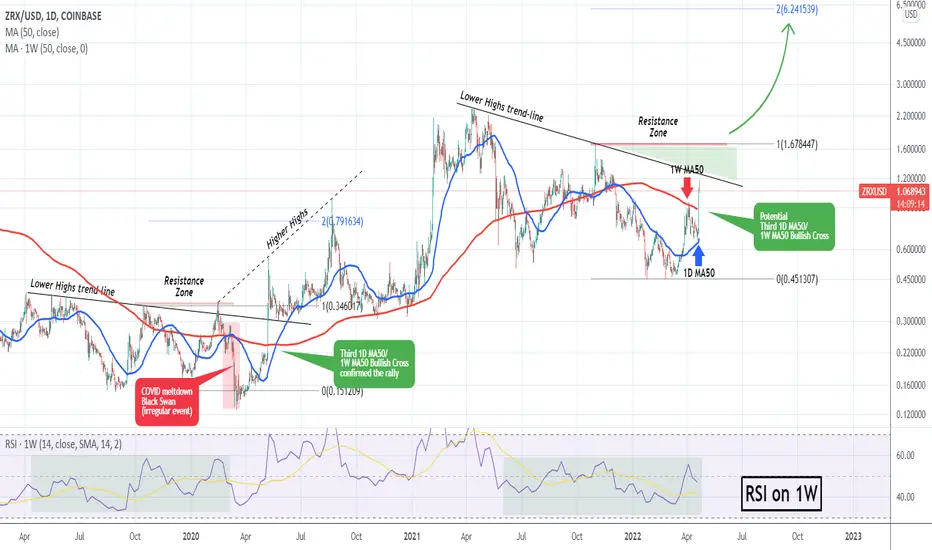
ZRXUSD About to break its Bear Cycle. Potential target $6.000x (ZRXUSD) made an impressive price jump yesterday after making contact and rebounding on the 1D MA50 (blue trend-line). This chart is on the 1D time-frame but the RSI below is on the 1W while also the 1W MA50 (red trend-line) is displayed.
As show, the Bear Cycle since the April 10 2021 High has been dictated by a Lower Highs trend-line. Right now the price is close to making contact with that level for the first time since October 31 2021. This is a similar pattern with that of April 2019 - February 2020. Excluding the Black Swan event of the COVID market crash in March 2020, when the price broke above the Lower Highs, the market gave a confirmed signal of a new rally.
Notice how the third Bullish Cross between the 1D MA50 and the 1W MA50 gave a confirmed signal. On the current Cycle, if those two cross again, it will also be the third time. Technically the last confirmation will come when ZRX breaks above the Resistance Zone, which is made of the last Lower High. A rally towards the 2.0 Fibonacci extension would be the technical target.
--------------------------------------------------------------------------------------------------------
Please like, subscribe and share your ideas and charts with the community!
--------------------------------------------------------------------------------------------------------
Symmetrical Triangle on the ZRXUSDTBased on technical factors there is a long position in :
📊 ZRXUSDT
🔵 Long Now 0.7350
🧯 Stop loss 0.6480
🏹 Target 1 0.8090
🏹 Target 2 0.9490
🏹 Target 3 1.0390
💸Capital : 1%
We hope it is profitable for you ❤️
Please support our activity with your likes👍 and comments📝

💡Don't miss the great buy opportunity in ZRXUSD @0xProjectTrading suggestion:
". There is a possibility of temporary retracement to the suggested support line (0.6878).
. if so, traders can set orders based on Price Action and expect to reach short-term targets."
Technical analysis:
. ZRXUSD is in an uptrend, and the continuation of the uptrend is expected.
. The price is above the 21-Day WEMA, which acts as a dynamic support.
. The RSI is at 71.
Take Profits:
TP1= @ 0.7853
TP2= @ 0.8387
TP3= @ 0.8827
TP4= @ 0.9669
TP5= @ 1.0402
SL= Break below S2
❤️ If you find this helpful and want more FREE forecasts in TradingView
. . . . . Please show your support back,
. . . . . . . . Hit the 👍 LIKE button,
. . . . . . . . . . Drop some feedback below in the comment!
❤️ Your support is very much 🙏 appreciated! ❤️
💎 Want us to help you become a better Forex / Crypto trader ?
Now, It's your turn !
Be sure to leave a comment; let us know how you see this opportunity and forecast.
Trade well, ❤️
ForecastCity English Support Team ❤️

💡Don't miss the great buy opportunity in ZRXUSD @0xProjectTrading suggestion:
". There is a possibility of temporary retracement to the suggested support line (0.6878).
. if so, traders can set orders based on Price Action and expect to reach short-term targets."
Technical analysis:
. ZRXUSD is in an uptrend, and the continuation of the uptrend is expected.
. The price is above the 21-Day WEMA, which acts as a dynamic support.
. The RSI is at 71.
Take Profits:
TP1= @ 0.7853
TP2= @ 0.8387
TP3= @ 0.8827
TP4= @ 0.9669
TP5= @ 1.0402
SL= Break below S2
❤️ If you find this helpful and want more FREE forecasts in TradingView
. . . . . Please show your support back,
. . . . . . . . Hit the 👍 LIKE button,
. . . . . . . . . . Drop some feedback below in the comment!
❤️ Your support is very much 🙏 appreciated!❤️
💎 Want us to help you become a better Forex / Crypto trader?
Now, It's your turn!
Be sure to leave a comment; let us know how you see this opportunity and forecast.
Trade well, ❤️
ForecastCity English Support Team ❤️


ZRXUSD Are the rises starting?Possible increases after breaking the level of $ 0.94. For me it is starting to look more and more accessible.

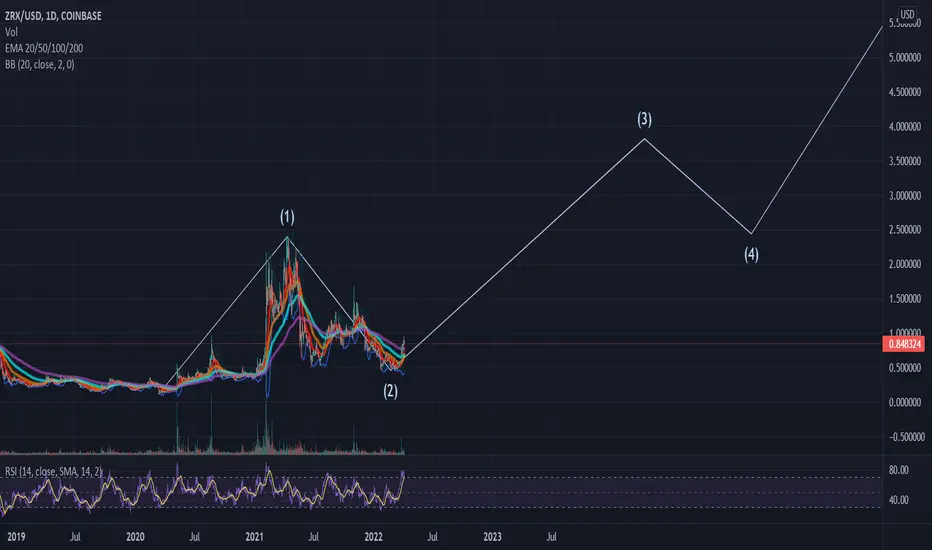
ZRX/USDTesting/tracking elliot wave theory. Please do not trade off idea without S/L. Not financial advice.
Trade on ZRXWhat you see here is a falling wedge with a target of $1.00 with more confluence for a short trade.
Between $0.94 AND $1.00 is where the trade should be made.
Confluence:
- Old POC ( not a naked POC )
- VAL slightly below.
- Daily level
- Target falling wedge
- Fibonacci Time on start/finish falling wedge
- Fibonacci Fan
- And the big one: the golden pocket.
With all those reasons I think it provide a good trade opportunity. This potential reverse zone ( where price is likely to fall ) is not small so you have to wait on confirmation on the smaller timeframe for the perfect entry. ZRX is in a bear trend in the bigger timeframe which helps the trade to succeed.
Target should be below $0.6.
Edit: Fib time label 25 of March should be 25 of April of course.
COINBASE:ZRXUSD

ZRX/USDT - Potential 220% SetupHello Traders!
ZRX completes the previous cycle and completes the fall phase. The new cycle begins with the accumulation phase. The zone of interest of buyers is in the range of $0.305 - $0.480.
For a medium-term trade the first part of purchases should be made in the range between $0.305 - $0.395. And the second one after the price goes over the level of $0.480 with fixation.
The profit taking targets will be price levels
$0.94
$1.16
$1.31
Good luck and watch out for the market
P.S. This is an educational analysis that shall not be considered financial advice

ZRXUSD Falling WedgeThe price is in a falling wedge pattern. As a bullish pattern, we expect it to breakout to the upside. Target is shown in the chart.
No financial advice.

ZRX (0x) Elliott Wave 5 +300%I believe a macro target would be ~$2.35, which is around the previous all time high. There is strong hidden monthly bullish divergence as you can see. This is one of the original Defi coins that has stood the test of time.

spot & hold ZRXbuy and hold ZRX/USDT for 25% profit
Our team has reached this conclusion that spot is nice

ZRXUSDT - SHORTBased on technical factors there is a short position in ZRXUSDT 0x
ZRXUSDT 0x
Score 1️⃣
🔴Short Now or set on Key Level 0.9200
🟢Target 1 0.8650
🟢Target 2 0.8200
🟢Target 3 0.7755
❌Stop loss 0.9450
#K_Level
Every signal has a score from 1 to 5, so accordingly adjust your risk for each signal. The signals with the score of 5 are the most probable ones.
Please support our activity with your likes and comments.

take 20% profit on ZRXOur team thinks ZRX growth is beyond the specified range.
Stop Loss is your best friend.

ZRX VS MANAZRX vs Mana.. The trend may be expected after a break of 1.5$. All the best.
T1: 1.9$
T2: 3.6 $
T3: 5.3$
STOP LOSS: Weekly close below with 0.78$
It's Not financial advice, just an idea.,.

ZRX VS MANAZRX vs Mana.. The trend may be expected after a break of 1.5$. All the best.
T1: 1.9$
T2: 3.6 $
T3: 5.3$
STOP LOSS: Weekly close below with 0.78$
It's Not financial advice, just an idea.

ZRX- MORE UPSIDE -SOONThe trend may be expected after a break of 1.5$. All the best.
T1: 1.3$
T2: 2.2$
T3: 4.72$
STOP LOSS: 0.78$

ZRX/USDT is next to exploadZRX today should finally continue the long-term uptrend. Well, there can be some consolidation during the next 12h, but the price is already very attractive for buyers.

ZRXUSD Resistance Turned SupportOne for the 0x bulls
Multiple ways can be seen to display the transition from resistance to support
WIth a simple horizontal line
Using the 50 day MA
and also using a fibonacci circle which shows a rejection early at 3.618, then this turned to a support later on
Bullish

There is one direction "UP"ZRX broke a downtrend channel in an uptrend (yellow lines)
After yesterday's declines, we tested the resistance line (red), such testing is a bullish signal and confirmation of increases. It is quite a key place because it is connected with the lower limit of the uptrend and the average (orange) trend.
As I can see it now: the ZRX is going to be gaining momentum and at some point it will go very steep. This is confirmed by the Choop index which is close to the values signaling strong movement. Which side the market will decide, but taking into account the sentiment on the market, for me it is 9/1 for increases.
It remains to wait for this moment of a solid breakout.

Which Side will Prevail? ZRXUSD A chart for ZRXUSD
I have identified both possibilities for price action
for the bears, a triple top and a combined rising wedge. Both of these together make a good case for bears
for the bulls, using the MavilimW indicator I have plotted a,b,c, showing a comparison to a previous point in the run up which may repeat
I am siding with the bears generally because the Rising wedge is very indicative of a bearish short term move, which will lead to the breaking of the uptrend line, and movement down the side of the circle.

ZRXUSDT | PARALLEL CHANNEL ?ZRXUSDT | PARALLEL CHANNEL ?
ZRXUSDT is trading in upward parallel channel
It has base support at 0.9038 (fib level)
Trade Plan:
Buy Level: 1.0017 - 1.1154
SL: 0.9038
TP: 1.3216 - 1.4647
