ZRX BREAKING OUT !!ZRX / USDT bullish af
It just broke the resisntace and it is heading to the target.
Potential +28%
Zrxusdt

ZRXUSDT (0x) - POTENTIAL BREAKOUTANALYSIS 🔎
- ZRXUSDT is consolidating in an ascending triangle pattern.
- This is a bullish build up pattern.
- Price testing the ascending triangle's horizontal resistance.
- There's an upward breakout potential.
BUY ENTRY ⬆️
- Breakout above the ascending triangle's horizontal resistance.
TARGETS 🎯
- Fibonacci extension levels.
SETUP INVALIDATION ❌
- Breakdown below the ascending triangle's inclined support.

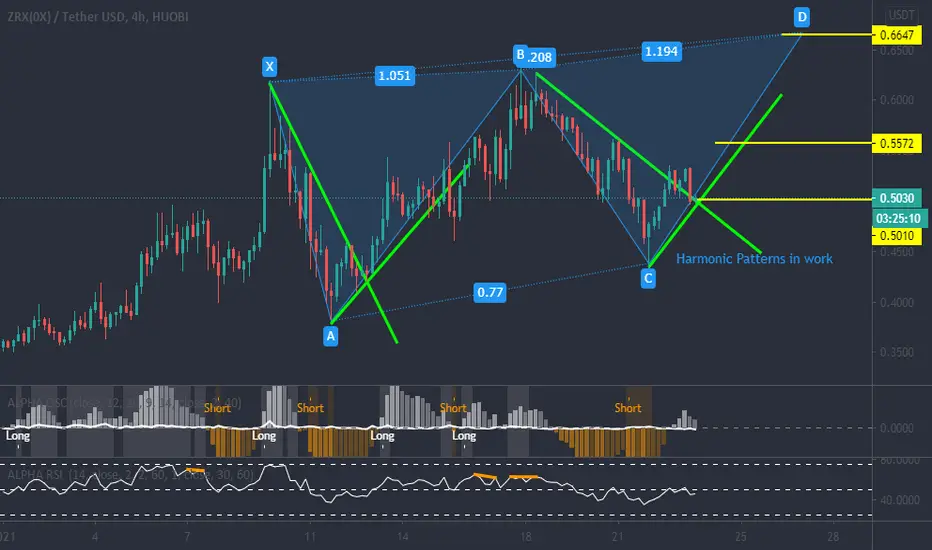
ZRXUSDT XABCD formation in progress?There's a new XABCD formation in progress in ZRX
Down trend seems to be broken and it is in the retest area
Buy : 0.5015
TP1 : 0.5572
TP2 : 0.6116
TP3 : 0.6647 (Kind of skeptical about this one)
SL : 0.4276
Note : BTC is still highly volatile be careful and pull SL if it looks dangerous
ZRXUSDT - POTENTIAL BUY ENTRY ANALYSIS 🔎
- ZRXUSDT is printing an ascending triangle pattern.
- Price bounced off the ascending triangle's inclined support.
- Price also brokeout above the descending trendline resistance.
- We could see a test of the ascending triangle's horizontal resistance.
BUY ENTRY ⬆️
- Breakout above the horizontal resistance level (R1).
TARGET 🎯
- Ascending triangle's horizontal resistance.
SETUP INVALIDATION ❌
- Breakdown below the ascending triangle's inclined support.

SPOT: ZRXUSDT⏳ SPOT
🪙 Coin: ZRXUSDT
📥 Enter: 0.596
🎯 Target: 0.6145
⚠️ Stop Loss: Don’t Panic
Good Luck 🎲
Tell me your ideas. Like and Share 🗣✅

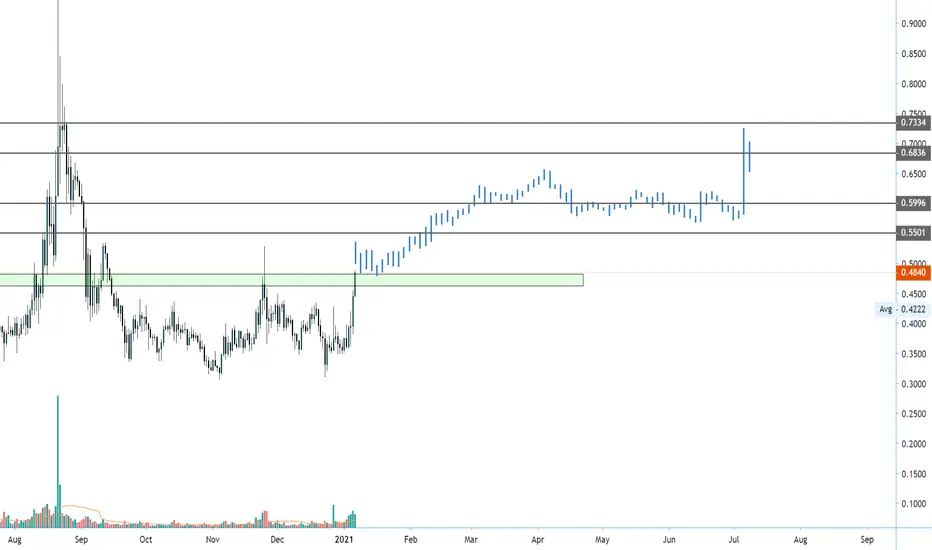
ZRXBTC StatusAfter rejecting from the historical ATL, I think ZRXBTC will move toward the higher resistance level.


ZRXUSDT (0x / Tether) Dailyhi
here we have two specified TPs based on FibRetracment and FibTimebase and Fib Projections so we can see many Fibonacci confluences ate TP zones and can be very optimistic about this pair
probably we should be achieving the TPs in the TP zone box
it is a little big swing trade
please comment you opinions
thanks

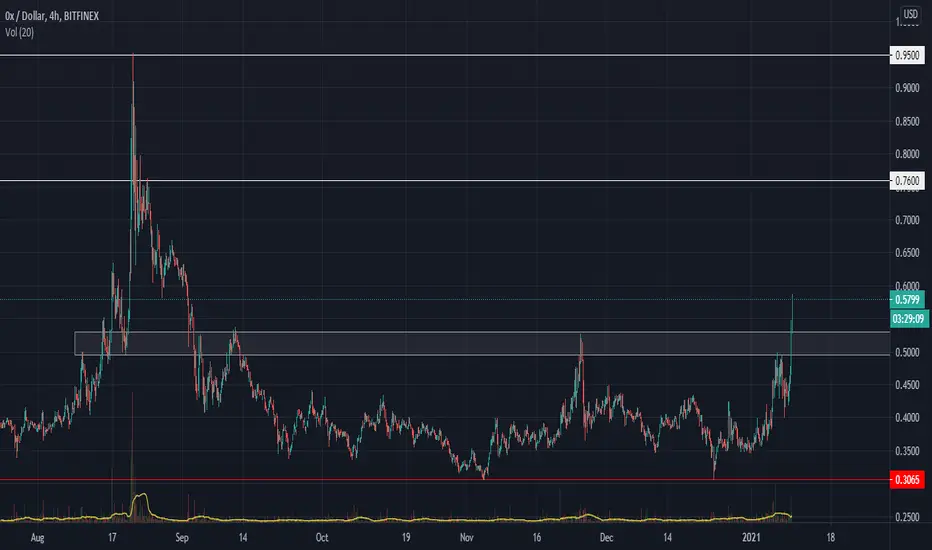
ZRXUSD is aiming the $1 level and bullish pressure is mountingZRXUSD
In daily timeframe we have seen a clear bullish engulfing pattern today. And the candle was so big enough to push the upper side limit which is holding this crypto since May 2020 and ZRXUSD has managed to reach the yearly high around 0.960000 level which is around $1 and felled below the .50 level and started trading within a confined range and it cannot break the 0.55 resistance level.
Today we have seen a clear break out of the upper side immediate resistance. And 0.60 will act as decent resistance for the bull. And after that 0.70,0.80 and 0.90 will come in to light in coming days.
We can see the series of Minor Elliot correction waves are formed within this narrow trading range. During the weekend investors will search for a new lows to buy @ the tip rule.
.30 has clearly acted as good support for the bull since may this bear cannot breach this level. Currently .382 Fibonacci level is also acting as strong resistance and the today upward thrust was capped by the .50 Fibonacci retracement level comes around .740000 level.
On upper side .824000 would be a decent target for the bull as its coincides with .786 Fibonacci level. $1 will be a swing target
All the 02 EMA's (50,100,200) is acting as decent support for the bull.
Ichimoku cloud is still red and the cloud is acting as decent support too
On Bollinger band it has breached the upper side of the band and the band width is widening and its a clear sign of further bullish pressure was mounting.

ZRXUSDT - Potential buy entry 🔼ZRXUSDT brokeout above the descending triangle inclined resistance.
Price action is printing a minor ascending triangle pattern.
Potential breakout.
Buy entry ⬆️ - breakout above the minor ascending triangle resistance.
Target 🎯 - resistance levels.
Setup invalidation ❌ - breakdown below the minor ascending triangle inclined support.

ZRX LONG...BULLISH TRENDOpening long position here on ZRX as accumulation is near to end...It will soon explode


0x (ZRX) - January 1Happy New Year!!!
Dear traders, nice to meet you.
"Like" is a huge force for me.
By "following" you can always get new information quickly.
Thank you for always supporting me.
-------------------------------------------------- -----
We have to see if we can go up along the uptrend line.
You should watch for any movement that deviates from the 0.3260-0.4490 segment.
If it falls from the 0.3260 point, a Stop Loss is required to preserve profit and loss.
If it moves sideways between 0.3260-0.4490, it is expected to create a larger wave with the stored force.
-------------------------------------------------- -------------------------------------------
** All indicators are lagging indicators.
So, it's important to be aware that the indicator moves accordingly with the movement of price and volume.
Just for convenience, we are talking upside down for interpretation of the indicators.
** The wRSI_SR indicator is an indicator created by adding settings and options from the existing Stochastic RSI indicator.
Hence, the interpretation is the same as the conventional Stochastic RSI indicator. (K, D line -> R, S line)
** Check support, resistance, and abbreviation points.
** Support or resistance is based on the closing price of the 1D chart.
** All explanations are for reference only and do not guarantee profit or loss on investment.
Explanation of abbreviations displayed on the chart
R: A point or section of resistance that requires a response to preserve profits
S-L: Stop Loss point or section
S: A point or segment that can be bought for profit generation as a support point or segment
(Short-term Stop Loss can be said to be a point where profits and losses can be preserved or additionally entered through installment transactions. It is a short-term investment perspective.)
GAP refers to the difference in prices that occurred when the stock market, CME, and BAKKT exchanges were closed because they do not trade 24 hours a day.
G1: Closed price
G2: Market price at the time of opening
(Example) Gap (G1-G2)


ZRXUSDT(4HCHART) channel Breakout#ZRXUSDT Technical Analysis Update
Channel Breakout
ZRX/USDT currently trading at $0.4050
LONG ENTRY level: 0.4000 to 0.4140
STOP LOSS: below $0. 3800
Resistance level 1( Target 1): $0.4470
Resistance level 2 (Target 2 ): $0.5130
Max Leverage: 4X
ALWAYS KEEP STOP LOSS...
Follow our Tradingview Account for more Technical Analysis Update, | Like, Share and Comment your thoughts.

ZRXlooking good IMO if W is actually correct then plus .90c incoming. Chances of .30c r still valid as well but then that would be a double bottom and still a W pattern as well IMO.


zrx/usdt
We notice that the candles on the daily timeframe are still above the support. We also note that the trend is still bullish and positive, according to the trend line and according to indicators.
engineeringrobo
Therefore, entering now is considered positive since 2 out of 3 buy signals are still active
Be careful and manage the deal successfully. The emergence of selling signals means that the deal must be sold and stopped, as well as the opening and closing of the candle below the support line and the support turning into resistance
welcome to be a member in our family
www.engineeringrobo.com
