Zs1

Are Soybeans Poised For a Run?Soybeans seem to defy all odds when it comes to rational and can often take things to the extreme, one side or another. This is very sweet when you are on the profitable side of this rational but equally as bitter when you are not.
During the beginning of May, I had a suspicion the market was very oversold and was due for a correction to the upside, but it seemed like the upside move would never come as the market continued to punish them. Finally, on 5/14 they came to life and gave me a good buy signal by busting the downward line of resistance. I estimated there was a 98% chance of a low and now had a move up to jump in on. It did prove to be a great one.
After clearing through $9.20 I foresee resistance around the $9.65. I believe the market will float around in between these two levels until 7/1. This will be after the Acreage report by the USDA which, many in the trade are anticipating will have fewer planted acres of soybeans than originally anticipated back in March. Also, the upward support line will start to squeeze the market into the $9.65 resistance level, I believe if the market does not move up through $9.65 prior to then it will have good technical reasons to then.
I am a bull on soybeans but will not add to my position now unless we retest the lows of $9.20. or break through $9.65.
In other words, I am sitting on my hands and remaining patient.
**Educational purposes only**

Soybean bottomFUD and counter FUD cancel each other.
Food is important, it should be expensive.
Think of the farmers!
Let's fill our bags and run away with sellers money muahahaha.

Soybeans failed to bounce at medianInstead gapped down and have been working on gap fill. I would look for a short position with a stop on the “bull side” of the median.

Soybeans failed to bounce at the pitchfork medianAs the saying goes, a failed bullish move is all the more bearish. Price gapped down at the median. I would try building a short position, with a stop on the other side of the median.

Soybeans: Sell opportunity towards the 0.5 Fibonacci.The price reversed the previous bullish sentiment on 1D and is currently neutral (RSI = 48.853, ADX = 28.377, Highs/Lows = 0.0000). The next long term direction should come after a lower test of (at least) the 0.500 Fibonacci retracement level. With 4H already on Lower Highs (Highs/Lows = -0.0750, B/BP = -1.5520) we have a TP = 8.637.
** If you like our free content follow our profile (www.tradingview.com) to get more daily ideas. **
Comments and likes are greatly appreciated.

Something brewing with agricultureI have noticed agriculture volumes were soaring recently, maybe I am out of touch but those are the numbers I had in mind before:
Soybeans (5B), Corn (2B), Wheat (1B), Cotton (900M), Coffee (600M), Sugar (500M), Cocoa (300M)
And now they are 2 to 5 times higher, what's up? ==> Soybean Futures 10-15 Billion, Corn futures 10-15 Billion, Wheat 4-5 Billion. Those are the CME ones, the ICE sucks hard but I noticed Sugar volume at over 1.25 Bil yesterday for March contract alone. So in total basically 30 to 50 billion usd a day for the 7 big ones.
Then you got all the other ones, I saw live cattle was at like 1.5 billion yesterday (wat?), lean hogs at 500+ million...
Buahahaha even orange juice futures are over 300 million. Orange juice futures, what a meme. Who even trades that?
* Do not look at tradingview volumes they are all wrong.
How it looks on higher TF:
Corn:
Wheat:
Sugar:
Here is what I am looking at immediately:
Trump is trying to shill, buuut doesn't seem to be working.
Wheat is on a massive selloff US business has been lost to France (get rekt).
Investors are counting on a positive trade deal and I think this is why prices have been going up for the past months (same concept as stock market).
I heard artificially inflating prices with hope and presidential tweets worked just great.
I bet Trump has been postponing everything just because dumb investors kept buying in anticipation of that trade deal. No matter how much it gets postponed they just keep buying like little lemmings, and Trump keeps posting the Dow Jones gains since he started his term & what a great president he has been so he clearly has a motive.
Can't blame him, most people are too stupid to figure out any of this, he is just doing what a politician does. Maybe he's one of these "with an IQ of 130 that thinks he is at 170" guys I have been hearing about (Elon Musk too according to Charlie Munger).
What I think is either on positive news investors will take profit (buy the rumor sell the news),
and on bad news. Oh my. All this volume, they're all going to want to sell, right? I do not think we will see a short squeeze, who is shorting this? Nah. Could be wrong but from experience people are not that smart.
I really want to trade this, but this is my advice: just do not touch it. Let's wait for the big burn to pass, and then after we shall trade those.
And remember,
* When prices go up, greedy agri giants (that have traders and actively invest in this) rub their hands and make profits on the back of poor people that can barely afford food (Remember Glencore backlash after stating prices explosion 10 years ago was very profitable)
* When prices go down, the poor little farmer is suffering while governments and big players step on them and make profits (they're protesting and telling every one how angry they are right now because they feel people in power do not have a high opinion of them and that hurts their feelings - really not even kidding - as well as taxes and high gaz prices)
* When prices do not move "nothing ever improves". How do you make price never move anyway?
Prices going down should mean people in civil war countries could get to eat, sit and watch farmers go on a rampage, block roads, burn hundreds of thousands of tons of crops to reduce supply.

10 YEAR TREASURY NOTE LONG TERM BY DANIEL BRUNO, CMTDANIEL BRUNO, CMT
BE SURE TO SEE MY T-NOTE CHART LINKED BELOW
LONG TERM TREND IS DOWN
CURRENTLY AT THE 2/1 GANN,
INFLECTION END OF MARCH AT CROSS OF 2/1 WITH THE 45 DEGREE 1/1

SOYBEANS LONG TERM BY DANIEL BRUNO, CMTDANIEL BRUNO, CMT
I HAVE NOT EVEN LOOKED AT A SOYBEAN CHART IN 13 YEARS
PRICES HAVE RETRACED CONSIDERABLE SINCE THE HUGE RUN UP C. 2007
MONTHLY AND WEEKLY TIME FRAMES ARE BEARISH, HUGE RED ENGULFING IS LAST CANDLE

ZS Soybean fut pointing to positive trade outlook with gap up?ZS Soybean fut pointing to positive trade outlook with gap up

Long SoybeansHi guys ! I post a trading idea for long positions at ZS1! . Recent WASDE report had a price projection for soybeans for 2019 about 900-910. As wee see also in the recent political scene trade war talks at G20 there is a good possibility to go far beyond as from 910. From technical analysis view at the monthly chart is long with target 1056 , RSI is tend to swing to upper levels so I think is a good long signal and ADX now is tending to get a direction which is a further high price. Hope you find it usefull !

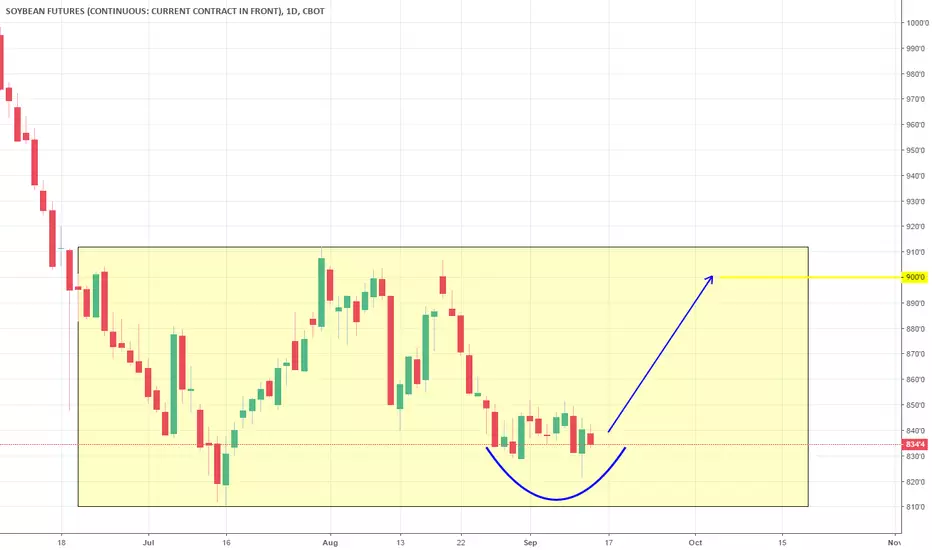
Rectangle Support tested. Reversing towards the Resistance. LongSoybeans (ZS1!) are consolidating (Highs/Lows = 0) near the 1D Rectangle's support (810 - 910). Based on this sideways pattern since late June, the price should now approach the 910 Resistance. We are long, TP = 900.
Soybeans /ZS - Short Premium - Short straddle into high IVRSoybeans are offering a short premium opportunity as price perhaps starts making a bit of a floor. I have sold a straddle at 840 w/ 45 DTE for a maximum profit of $2500. A few things made this an attractive trade such as the high implied volatility and price having reached a key support level where I hope price stays buoyed while I run out the clock and collect options premium. The high implied volatility has allowed me to sell a straddle that has a break even range of $100 or greater than 10% of the total value of the underlying which makes me feel comfortable with the risk/reward of this trade.

SOYBEAN FUTURES Buy ideaSOYBEAN FUTURES Buy idea @Demand ZOne 995.4 - 967.6
Buy Limit: 995.4
Stop Loss: 967.6
Take Profit: 1037

Soybeans ZSN2018 trend analysisMassive H&S structure goes on. Look forward for HS continuation with further downside below 1000.

Mid-term cyclic bullish setup for Soybean oil - ZL CBOT FuturesLook forward for gain starts in early April


SOYBEANS /ZS trend reversal started?soybeans and many other ags have rallied after dumping on the crop report and is possibly making a trend reversal after months of bearish action. I'm looking to pick up a long on a healthy pullback.

Soybean donwtrend continuationI find risk/reward of this trade quite attractive. Sell short at current price with stop above 1000. Fist (small) target @ 976, second target @ 942, third target @ 882.

Time to pick some CornCorn has broken and closed below it's wedge on a weeky time frame. We are looking for pullback triggers to get involved to the short side. Targets are identified and the stop will come from the trigger (on a 60 or 240 min chart)...NO TRIGGER, NO TRADE!

ZS Soybeans futures in continued declineIn the accompanying chart I show a high probability support zone for $ZS_F Soybeans at approx. $835 - 790 zone. If demand signals start flipping and firing, that may be a good place to go long. Meanwhile, in the absence of any real demand, I can't see a turn around. The recent lows look vulnerable.

Soybean (ZS) Testing Downchannel/Descending Wedge ResistanceAfter a two week rally, soybean (ZS) is now bumping into downchannel/descending wedge resistance on the weekly chart, which coincides roughly with the 1000 psychologically key resistance level. Weekly RSI and Stochastics are in rally mode, while the MACD which a few weeks back appeared ready for a negative crossover has strengthened again and is sloping up now.
For my multiple timeframe analysis on ZS, feel free to visit: tradablepatterns.com
Website: tradablepatterns.com
FB: facebook.com
Stocktwits: stocktwits.com
Twitter: twitter.com
Linkedin: www.linkedin.com
YouTube: www.youtube.com
Google+: google.com
Email: info@tradablepatterns.com

The squeeze is comingAbove 998 and the squeeze will have shorts scrambling. A close above this area and we will be looking for triggers long.
