Zw_f
Unlocking the Wheat Matrix: The Code to Dominating CommoditiesUnlocking the Wheat Matrix: The Code to Dominating Commodities
What if I told you there is a way to see the hidden signals of the market? To move not with the herd but ahead of it, where clarity reigns and profits follow. This week, we delve into Wheat (ZW) — a market where the COT strategy reveals its secrets. The choice is yours: read on and learn, or remain blind to the patterns all around you.
Decoding the Setup
Understand this: this is not an invitation to blindly leap into the market. No, we wait. Patience is the cornerstone of mastery. When the technical tools confirm the market’s strength, only then do we act. Now, let’s break down the wheat matrix:
Code 1: Commercial and Small Speculator Positioning
The Commercial COT Index, using a 26-week lookback, reveals that commercials are at an extreme in long positioning. At the same time, the Small Speculator COT Index shows small specs aligning at a similar extreme. In the wheat market, unlike others, we follow the small specs rather than fading them. A deviation from the norm—an anomaly in the matrix.
Code 2: Commercial Extremes in Net Positioning
Commercial entities are nearing their most bullish stance in three years. History whispers a truth: when commercials move like this, the market often follows.
Code 3: Contrarian Signal from Investment Advisors
The masses of investment advisors are overwhelmingly bearish. Against this backdrop, the extreme bullish positioning of commercials sends a powerful contrarian signal. The matrix is showing its hand.
Code 4: Valuation Metrics
Wheat stands undervalued against U.S. Treasuries. When value aligns with positioning, the code becomes clearer.
Code 5: Seasonal Patterns
Seasonal truths tell us that wheat’s true bottom often forms in early January. This aligns perfectly with the cyclical and technical signals currently emerging.
Additional Signs in the Matrix
Spread Divergence: Bullish spread divergence between front and next month contracts.
Accumulation Indicators: Insider Accumulation Index and Williams ProGo confirm accumulation.
Technical Tools: %R is in the buy zone, and Weekly Ultimate Oscillator Divergence further supports the bullish narrative.
Cycles: The Recurring Patterns
44-Month Cycle: A major bottom forms now.
830-Day Cycle: Signals an upward move into March.
151/154-Day Cycles: Align with a cyclical bottom occurring now, projecting strength into March.
The Red Pill of Action
With these signals converging, the urge to act immediately can feel irresistible. Don’t. The matrix requires patience. Let the market reveal its strength. When the time comes, you’ll ride the wave with confidence.
The Path to Mastery
Trading isn’t merely a series of moves; it’s a philosophy. The COT strategy is a key, but only those who seek mastery will unlock its full potential. If you’re ready to see the market for what it truly is, join Tradius Trades. Here, we don’t just navigate the matrix of commodities—we redefine it. Are you ready to free your mind?
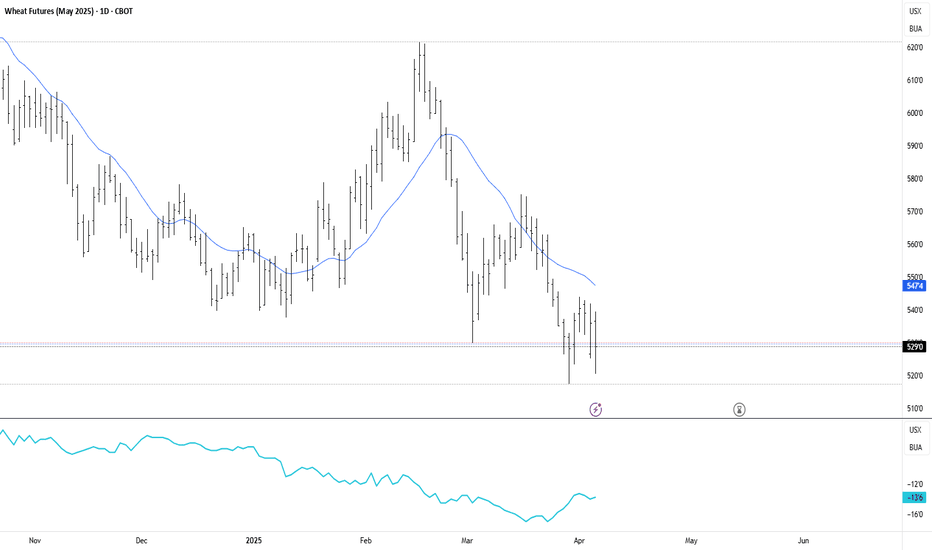
May Wheat futures: Daily trend reversalThis setup can lead to a larger failure of a weekly decline signal, which could cause a major move in $ZW_F. I'm long May futures here, paying close attention to how it develops, if the signal isn't stopped the trade could be held for longer until the chart evolves into a higher timeframe trend potentially, that would be the ideal scenario here.
Best of luck!
Cheers,
Ivan Labrie.
Technical Update Wheat (6.8.22)Wheat
Technicals: July wheat futures have been the laggard of the big-3, treading near the lower end of the last month’s range. Our pivot pocket from 1095-1102 remains intact. This pocket is not only psychologically significant, but also technically significant with the 50-day moving average coming in at 1099 ¾, along with other previously important price points. If wheat can tag along with corn and beans and breakout above that first hurdle, it could take prices back near first resistance, 1142 ¾-1150.
Bias: Neutral
Previous Session Bias: Neutral
Resistance: 1142 ¾-1150***, 1200-1205 ¼**
Pivot: 1095-1102
Support: 1027 ¼-1034 ¼****
Separating the Wheat from the...Corn?We like being long $ZW_F vs. short $ZC_F as both a short-term trade and and longer-term play. Corn has experienced a resurgence thanks to the huge rally in $CL_F prices while wheat have found rock-solid support at $490 per bushel and reclaimed an uptrend line going back to last March. Ratio should be 3:2 in favor of corn contracts.
WHEAT | Weekly Chart A rather logical looking interpretation. There's a reasonable degree of support, whilst we're buying in the lowest percentiles of the last decade. Further, the probability of the downtrend being breached looks increasingly likely. Further, the return distribution of commodities is particularly convex or asymmetric with a long right tail. Thus, we can give the position similar treatment to that which we might a long option trade.


