Government bonds

LMACD of the US02Y has just dipped bellow 0!In the past while rates have been elevated for a period of time things have gone bad for risk markets once the LMACD dipped bellow 0. Could be this time different?
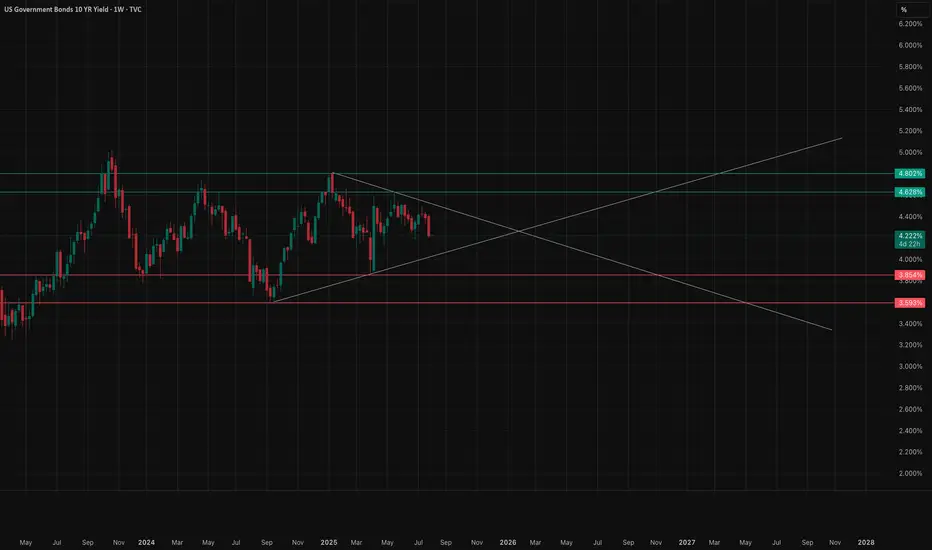
US 10-year yield threatening to breach key supportAfter Friday’s US jobs report, US Treasury yields fell across the curve. This caused the benchmark 10-year yield to retest the area below the 6M resistance level at 4.417% and settle at the 3M support from 4.211%. The mentioned support level has acted as a familiar floor since May this year. Therefo

US 10Y TREASURY: NFP sank yields Although the previous week was full of important US macroeconomic data, including the FOMC meeting, still the weaker than expected NFP data impacted significantly the US Treasuries market. The 10Y US benchmark yields were holding around the 4,3% level during the week, however, weak NFP data pushed y

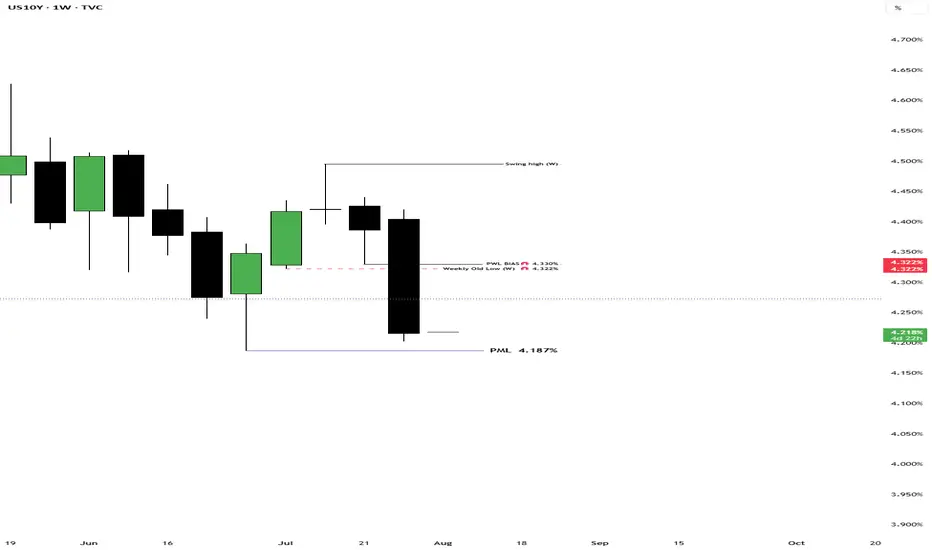
US10Y Technical Analysis & Mortgage Rate Outlook Weekly. Aug. 4US10Y Technical Analysis & Mortgage Rate Outlook
(Based on Weekly Chart & Current Economic Context)
Technical View (Weekly Timeframe)
The US10Y yield is sitting around 4.21%, in the middle of a wide consolidation range that’s been developing since late 2023. This range is bounded by strong resistan
UST 10Y Technical Outlook for the week Aug 4-8 updated dailyUS Treasury 10Y Technical Outlook for the week Aug 4-8 (updated daily)
Overnight
The yield on the US 10-year Treasury note dropped sharply by nearly 20 basis points to 4.25% on Friday, hitting a three-month low, driven by revised labor market data indicating significant weakness. Nonfarm payrolls fo
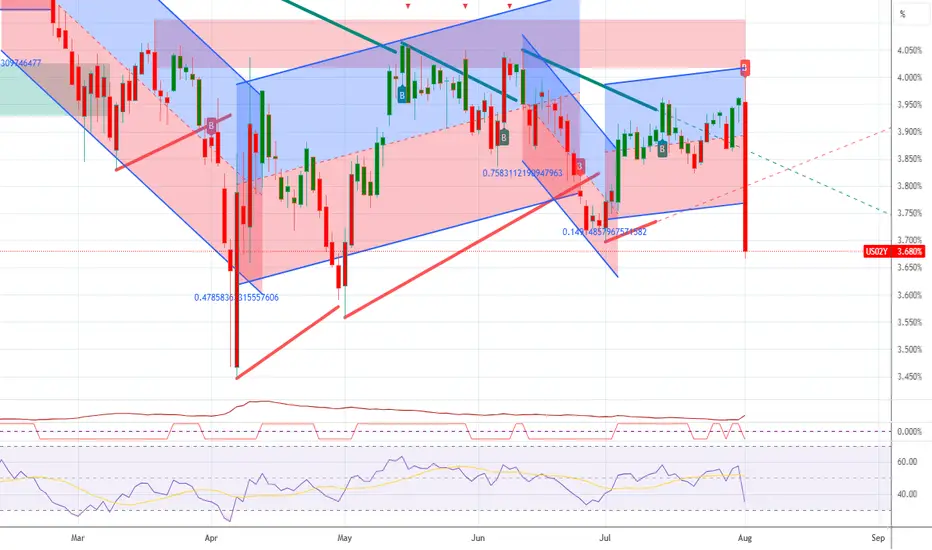
US02Y LongUS02Y Long on the regression break.
I am considering the other bond markets as this has already moved a long way.
US10YTHE non farm employment data report has given us a reason to sell of US10Y.the lower than forecast of 73K was a big shock ,the slower job growth reflects caution amongst employers amid uncertainties related to tariff, trade and immigration policies. Wages grew with average hourly earnings increasin

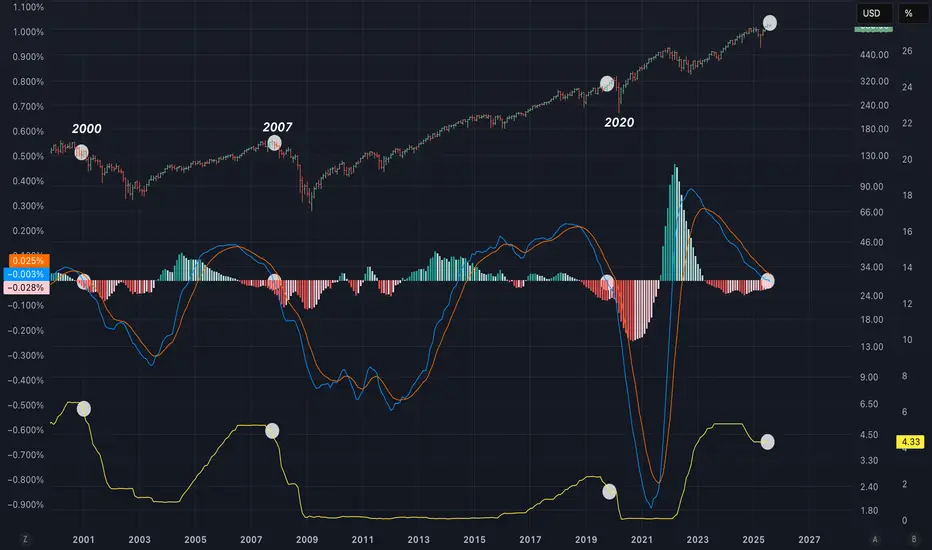
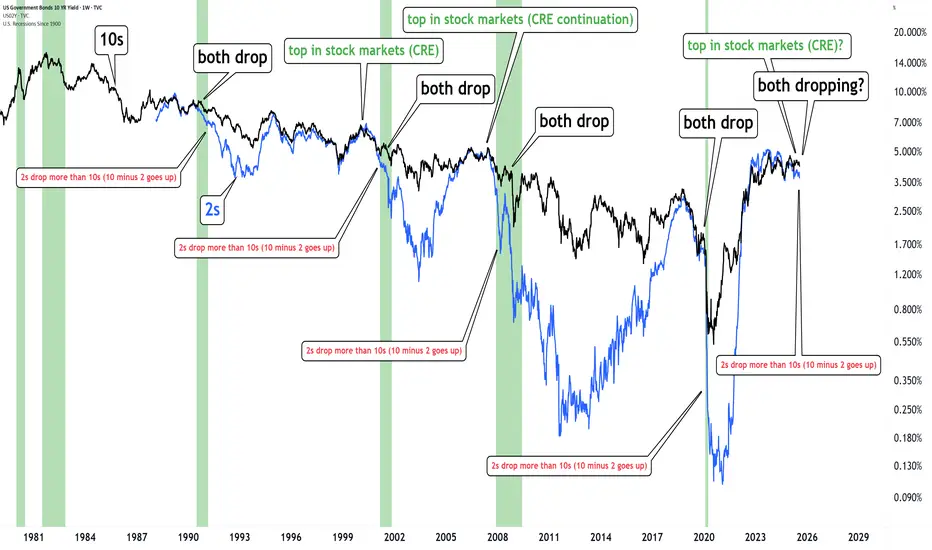
The bond market is warning us.When both 2s & 10s drop together and the yield curve steepens (10–2 rises)... It’s historically followed by important market turmoil
Happened in 2000, 2008 and 2020.
It's possibly happening again.
The bond market is warning us.
U.S. homebuilders tumble as rate cut bets decrease after Powell'** Shares of U.S. homebuilders slide on Weds after Fed chair Powell says no decision yet on rate cuts
** Markets now pointing to odds dropping below 50% that the Fed will cut rates at its next meeting in Sept, as benchmark U.S. 10-year yield
US10Y
extends rise
** Rising yields can potentially le

See all popular ideas
SymbolPrice & chgYield
SymbolYield / Price
Bond collections
| 1 month | 3 months | 6 months | 1 year | 3 years | 5 years | 10 years | 30 years | |
|---|---|---|---|---|---|---|---|---|
| - | - | - | - | - | - | - | - | |
| - | - | - | - | - | - | - | - | |
| - | - | - | - | - | - | - | - | |
| - | - | - | - | - | - | - | - | |
| - | - | - | - | - | - | - | - | |
| - | - | - | - | - | - | - | - | |
| - | - | - | - | - | - | - | - | |
| - | - | - | - | - | - | - | - | |
| - | - | - | - | - | - | - | - |