US Government Bonds 30YR Yeld (US30Y)As inflation trends closer to the Federal Reserve’s 2% target,
speculation grows around a potential interest rate cut.
The futures market anticipates a 50-basis-point reduction
at the conclusion of the Fed’s September meeting and for rates
to be a full percentage point lower than the current 5.25%-5.5%
range by the end of 2024.
Government bonds

August to September - Where are we? Where can we go?Looking into the market for this week. Just guestimates for the macro directions but will be taking intra-day moves where they permit

US10Y going lower with the Fed having no choice but to cut.Almost 10 months ago (November 7 2023, see chart below), we made a bold (for the time being) call on the U.S. Government Bonds 10YR Yield (US10Y), as against the prevailing market sentiment we gave a sell signal, right after what turned out to be a top:
Today's revisit to this pattern shows that the 1M RSI Lower Highs have already started to form a Bearish Reversal on the US10Y price, similar to 2006 - 2007. We are expecting to hit the 0.382 Fibonacci retracement level at 2.100% as its first Target, on the Fed's first wave of rate cutting and gradually hit the lower Fib targets as the rates stabilize.
For better illustration we have plotted also the U.S. Interest Rate (red trend-line), where you can clearly see that the fractal we compare to today, is right before cuts started in August 2007. Also it is a natural consequence of US10Y falling when rate cut cycles start, evident also in June 2019, December 2000, May 1995, May 1989 September 1984, May 1981 etc.
-------------------------------------------------------------------------------
** Please LIKE 👍, FOLLOW ✅, SHARE 🙌 and COMMENT ✍ if you enjoy this idea! Also share your ideas and charts in the comments section below! This is best way to keep it relevant, support us, keep the content here free and allow the idea to reach as many people as possible. **
-------------------------------------------------------------------------------
💸💸💸💸💸💸
👇 👇 👇 👇 👇 👇

bond yield vs copper gold and oil.... US 10 year bond yield vs copper gold ratio and oil.... a meaningful intermarket link ....

us10Y Mallicast analysisThe U.S. 10-year Treasury bonds, given their significant importance, are currently rising, which indicates a potential economic recession and an imminent decline in durable goods such as gold. We predict this growth to continue until it reaches 5.289%.
US10Y Mallicast analysisThe U.S. 10-year Treasury bonds, given their significant importance, are currently rising, which indicates a potential economic recession and an imminent decline in durable goods such as gold. We predict this growth to continue until it reaches 5.289%.

us02Y(Mallicast)The U.S. two-year Treasury bonds, after reaching a yield of 5.093% and gathering liquidity, have begun to correct their previous upward trend. This correction is expected to continue until it reaches 3.555%, with the possibility of further correction down to 2.832%.

us02Y (Mallicast analysis)The U.S. two-year Treasury bonds, after reaching a yield of 5.093% and gathering liquidity, have begun to correct their previous upward trend. This correction is expected to continue until it reaches 3.555%, with the possibility of further correction down to 2.832%.

ELLIOTT WAVE ANALYSIS: US10YR - 20 AUG, 2024© Master of Elliott Wave : Hua (Shane) Cuong, CEWA-M.
10-Year Yield, the main trend is down. Currently wave (C)-orange is unfolding to push lower. Recent price action shows that wave ((iii))-navy has ended, and wave ((iv))-navy is unfolding as a Triangle. The basis is that it will be longer and take longer than expected. But the bearish view with wave ((v))-navy then is still holding.
While price must remain below the 4.022% high to hold this view.

Brazilian Bonds 10 year yields trend downLong rates in brazil has showed some weakness even though the central bank suggested it will raise rates.... but long term rates are being sold.. for moment its a sell

US 10Y TREASURY: Fed`s cut is nearingThe posted US inflation for July brought some new confidence for investors that the Fed's rate cut is nearing. The July inflation eased to the level of 2.9% on a yearly basis, and was below market forecast of 3.0%. The Producers Price Index was another indicator which pointed to further easing of inflation pressures, by reaching 0.1% in July, for the month, again below market estimate of 0.2%. To nail the market expectations, preliminary Michigan Consumer Sentiment, posted on Friday, showed no change in inflation expectations for the five years period of 3.0%. This was enough information for the market participants to increase their expectations that the Fed might make their first rate cut in September.
The 10Y US Treasuries started the week modestly below the level of 4.0%, and were driven to the downside during the rest of the week. Yields reached the lowest weekly level at 3.8%. Thursday and Friday brought back some short volatility, after the Retail Sales data were posted, however, yields are finishing the week at the level of 3.88%. During the week ahead the Jackson Hole Symposium will be held on Thursday and Friday. After the symposium, Fed Chair Powell will hold a speech, which might bring back some volatility to the market, considering current nervousness around rate cuts. Still, it is not expected that the yields will move significantly to either side, except to test, for one more time the 3.8% level.

Increases in unemployment + yield curve disinversions + SPYIncreases in unemployment + yield curve disinversions have led to lower equity markets

10 Yr Yield-100/200 monthly SMA cross is inevitabThe crossing of the 100 SMA ABOVE the 200 SMA on the monthly 10 year yield is inevitable...it will cross shortly no matter what rates do from here on out...even if they declined to 2% tomorrow.
What does this mean...IMO it means longer term lending rates will remain higher than people/corporations are used to seeing over the last 20 years. The prices we are seeing today will more than likely be what we will continue to see over the next 7-10 years; at the very least.
As you can see from the above chart, the 100 SMA crossed BELOW the 200 SMA on the monthly in 1990 and we all know what happened after that cross...we ended up being in a declining interest rate environment from 1984-2020.
We are now in either a longer term increasing interest rate environment or a stagnant one at best.
At this point we know the Fed is "thinking" about lowering short term rates but they are no where near a fierce rate cutting trajectory in the near term. Therefore, in order to project some relatively near term SMA's, I used the "SMA prediction" that @vladimir.kamba created to project out the likely path the SMA's may take in the near term. See link below (green lines) for the projected SMA's.
If the past in any indiction of the future...after the cross happened in 1990 rates were never able to touch the 200 SMA until 2018 (28 years later). The 200 SMA has flatted out and is projected to turn slightly up; which it has not done since the 1950's...Woah!!!
The point of this post...get your finances in order to anticipate this new rate environment! Those people or company's that refinanced at really low rates BUT used short term financing must anticipate refinancing those loans at much higher rates and/or should pay them off if possible. Do not count on rates going back to where they were over the last 20 years.
Could we be transitioning back to a period of time where "savers" are rewarded? Could that be why Warren Buffett has dramatically increased the cash pile at Berkshire Hathaway to around 25% of the total portfolio?

10YR Treasury 8-1410YR Treasury 8-14
If the 10 YR can close below that 3.801% level tomorrow the mortgage world will be back in business!!!
- Cody Inman

US10Y: 14 AUG, 2024US Bonds 10 YR Yield: 14 AUG, 2024 - 4H Chart
© Master of Elliott Wave Analysis: Hua (Shane) Cuong, CEWA-M.
10 YR Yields, the main trend is bearish. Currently wave (C)-orange is unfolding to push lower.
Wave ((iv))-navy has just completed at 4.022%, and wave ((v))-navy is unfolding to push lower, targeting the immediate target at 3.676%. While price must remain below 4.022% to maintain this view.

Disinversion Surprise on CPI Day?Could the 10's and 2's yield inversion finally rollover tomorrow back into normal territory ? MACD and basic patterns suggest no, but fundamentals will prevail. If CPI comes in hot, inversion likely continues, if CPI continues to cool as it has been for months, the inversion could finally run its course tomorrow morning

US10Y-US02Y - Bond Yield Curve AnalysisWorth noticing that the bond yield curve did very briefly push above 0 with a very whipsawing spike.
This happened at the S&P selling climax low.
And it does look like we will see a real move up and through the 0 point either soon or in the not too distant future.
Which in tandem will see increasing unemployment.
And that apparently is a clue that recession is in the pipeline.
And we often see a stock crash in that area.
That said, the alignment with stock indexes crashing is fairly loose.
Notice that the yield curve pushed through the 0 point almost 600 days before the crash happened.
Thats more than enough time for the crypto cycle to finish and the opportunity to cash out taken.
Then if a crash does happen as the crypto cycle ends, it would be the ideal outcome.
As I have said; I think everything aligns because this is all organised, orchestrated and not at all random.
But lets see, this is a little warning of danger here ⚠️.
Not advice.

BUND-STREET SMART PLAY BY lINDA RASCHKE2/3YR FCL: Bund Made First close below the Sma, on 2 and 3 Year time frame hence expecting a Bullish retracement
15/16M:RTM: This a Consolidation Pattern, formed my simple or complex consolidation both on 15 and 16 Month Time frames
8M:HOLY GRAIL: This a Retracement formed to the EMA after close off the kelner, See street smart by Linda.
Note that 6 Months is Ranging below the Range of 2-3 Year First close candle, however small time frames are playing off the Bullish trend
1w" Extended Rund
2days, extended Run, expecting Bullish trend

Fed Watch Tool Target Rates on the US 10 YOn this graph, we see the current priced in Interest Rates of the FED Watch Tool in compare to the US 10 Year Treasuries. We can clearly identify by how much the market is frontrunning and at what pace the market believes the Interest Rates will decline.
The Orange Box below is the average Interest Rate of ~2.75% and the expected Mid/Long Term Interest Rate, until something brakes and the next Liquidity Cycle begins.
I personnaly believe that we will see an even faster pace in the future, hence the Earnings showing more uncertainty in the guidance of Corporate Ameria. Additionally the job openings decline, more people are unemployed, the Yen carry trade is not yet unwinded, consumer credit and auto loans are on verge of a credit shock.
Conclusion: hence TLT is pretty much the exact counterpart of the US10Y, I decided to go long TLT with leverage.

German Bund Is On The Rise, So As EURUSD PairWe talked about a bullish turn on German Bund back on June 20th, where we mentioned and highlighted more gains within wave C of an A-B-C rally, which can also recover the EURUSD pair.
As you can see today on August 05, German Bund is extending strongly higher within a five-wave bullish cycle for wave C with space up to 140 area. At the same time EURUSD is also nicely recovering due to a positive correlation and with still bullish Bund, EURUSD can easily see more upside.

US 10Y TREASURY: easing with rate cutsTwo weeks ago markets reacted to surprising jobs data in the US, however, the posted ISM Services PMI on Monday put a dose of relaxation among market participants. Data showed that the US is clearly not in a recession and that, at least, the services sector is doing fine at this moment. All financial markets were traded in a positive manner during the previous week, resetting their sentiment to the previous path. The US Treasuries also re-adjusted during the week, in a move from 3.7% reached on a Monday, till 4.0% reached on Friday. The 10Y benchmark is finishing the week at the level of 3.94%.
Regardless of a positive come-back and re-assessment of the current state of the US economy, the market nervousness might continue in the coming period. It should be considered that the US inflation data and the retail sales for July will be published in a week ahead, where some increased volatility might be possible for one more time. At the current stage, the market is testing the 4.0% level, however, there is some probability for another drop in the week ahead. The level of 3.9%, eventually 3.8% might be tested. The move above 4.0% is unlikely at this moment.

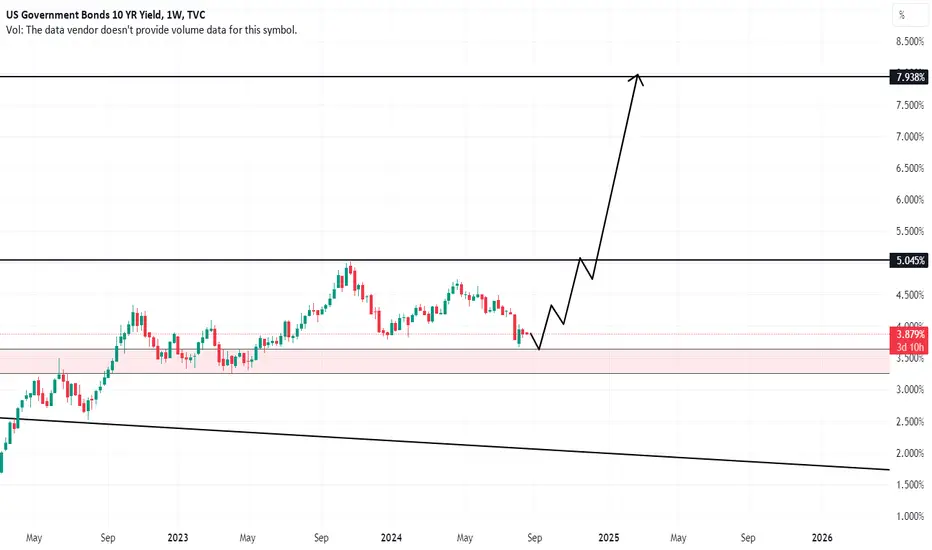
US05Y Long but wait 3%now its break a major support and retesting it at 3.8% now its time to fall to 3% then fly back to 7.6%
the move from 3.8 to 3 its important time all us stock going to raise before the massive drop .
this my idea its not a financial advice .

Why are Interest rates falling? Time to buy? We have seen an amazing fall in interest rates.
Bonds have looked to put in a local bottom.
Why are bonds showing signs of accumulation?
Is the bond market pricing in a recession?
I believe the recent decline in yields is due to commodity weakness.
Yields have soften because energy & base metals have become cheaper.
This drives the disinflationary narrative.
I think its to early to tell whether this decline is from demand or global weakness.
