Government bonds

How I Stay Organized and Efficient During My Morning RoutineGood morning, traders! ☕️ As I gear up for the trading session, here's how I stay organized and efficient during my morning routine:
1️⃣ Plan the night before: I prep my trading station, review market news, and outline my trading goals before calling it a day. This sets a clear roadmap for the morning and reduces decision fatigue.
2️⃣ Start with a ritual: I kick-start my morning with a ritual that helps me get focused and energized. Whether it's meditation, visualization, exercise, or enjoying a cup of coffee/tea, this routine primes my mind for the challenges ahead.
3️⃣ Time blocking: I allocate specific time slots for key activities like fundamental and sentiment research, top down technical analysis, bias matrices, reviewing trade setups, and analyzing charts. This helps me stay on track, avoid distractions, and make the most of my pre-session hours.
4️⃣ Utilize checklists: I have a checklist that outlines essential tasks like reviewing economic data, assessing overnight market developments, rebalancing portfolio and updating my watchlist. If I have anything specific I need to focus on that session, I will take note too. This ensures I don't miss important steps or actions/tasks.
5️⃣ Stay organized digitally: I leverage technology tools like trading journals, note-taking apps, and calendar reminders to keep track of my trade ideas, record observations, and stay organized. This digital approach streamlines my workflow most of the time.
6️⃣ Focus on self-care: Prioritizing self-care is vital for optimal performance. I make sure to nourish my body with a healthy breakfast, hydrate adequately (especially important during the extended heat waves I experience where I live), and take short breaks to relax and recharge. A balanced mindset is key to success.
Finding an efficient morning routine is a personal journey. Experiment with different strategies, listen to your needs, and fine-tune your routine over time. Start your day right and set yourself up for trading success! 📈✨

T-notes Interest rate vs its future pricingIt's Inverse relation. An increasing interest rate will drive down the future's price.

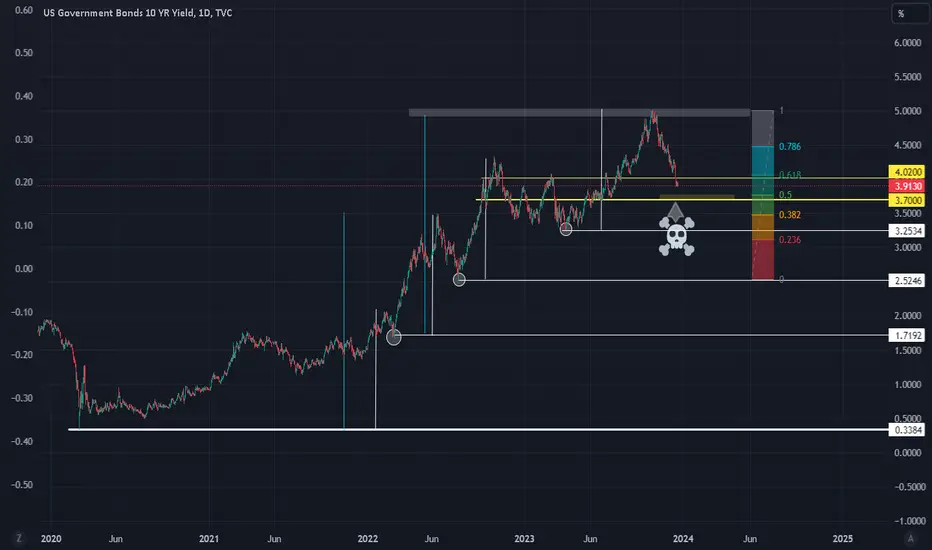
US10Y : What/where to look The Fed say don't worry, things are looking good. There is 'no landing'. So lets be happy and continue as usual. The stocks are riding high. Jobs are plenty. Surely things are fine.
But the MARKET says other wise. Above is a simple way of looking at it. The market looks like it is scared shit and continue to buy up longer term bonds. If you look closely, 3.70% is the line separating heaven and hell. I am sitting back until it falls below, then it should be time to begin trading - unlike many who shorted way too early.
Why 3.70%? Look closely.
When something is going to break, it is usually the 'structure' - and the whole house of cards will fall down - in an instance :)
Good luck.
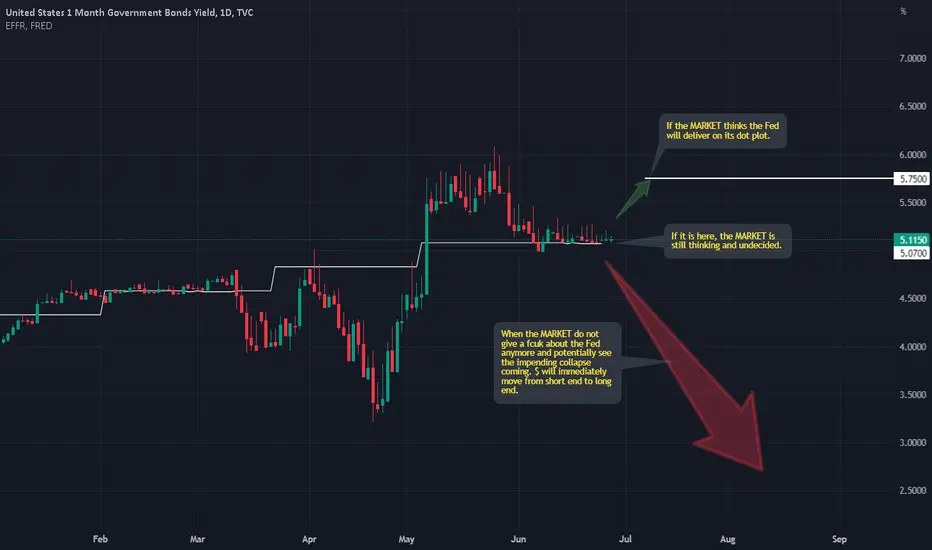
US01MY : An important chartThis chart is actually quite important. I take a look at it all the time.
It would be quite interesting when it starts to fall, ever so slightly at first, just below the EFFR.
We also need to understand which arrow is the BIGGER one. The green or the RED. This can easily answer which is the bigger POTENTIAL :)
Good luck.
P/S : DO not just believe what I say. Use your common sense.
If we look at the chart of most FX pairs, try not to look at the price action. Instead, look at the movement in volume. What I can see is that the MARKET is checking out if there are anymore BUYERs of risky assets. We can see it is running out of buyers, i.e. suckers. What lies ahead is easy to figure out.
US05Y - Retest on monthly bases then the biggest move ever.US05Y - Retest on monthly bases then the biggest move ever.

WHATS FLOWING: JGB YIELDS ARE UP! DECISION HOURS AWAY...AMEX:EWJ
TVC:NI225
TVC:JP02Y
TVC:JP10Y
TVC:JP30Y
FX_IDC:USDJPY
Segment: Interest Rates and JGB Yields
Interest rates are a crucial component of any economy, and the Bank of Japan's (BOJ) decisions on interest rates significantly impact global markets. JGB yields, in particular, serve as a critical indicator of the BOJ's monetary policy stance.
Market Expectations and Yield Movements:
When investors anticipate that the BOJ will raise interest rates, JGB yields typically rise. This is because higher future rates make current fixed-income securities less attractive, causing their prices to drop and yields to increase. Conversely, if the market expects the BOJ to maintain or lower rates, JGB yields tend to fall.
Yield Curve Control (YCC) Policy:
The BOJ uses Yield Curve Control to keep 10-year JGB yields around zero percent. If the BOJ allows yields to rise significantly, it may be preparing the market for a potential rate hike. This is a strategic move to manage inflation expectations and economic growth.
Inflation Expectations and Economic Indicators:
Rising JGB yields often correlate with higher inflation expectations and strong economic growth indicators such as robust industrial production and consumer spending. These factors suggest the economy might be overheating, prompting the BOJ to consider raising rates to prevent inflation from accelerating.
Investor Behavior and Global Influence:
The behavior of investors, both domestic and international, in the JGB market can signal expectations of rate changes. For instance, selling off JGBs in anticipation of higher rates drives yields up. Additionally, changes in global economic conditions, such as U.S. Federal Reserve rate hikes, can put upward pressure on JGB yields, indicating a potential BOJ rate hike.
Conclusion:
Today's episode has explored the complex interplay between JGB yields and the BOJ's interest rate decisions, providing insights into how these dynamics influence global markets.
Thank you for joining us on "What's Flowing." Stay tuned for more in-depth analyses and insights to help you navigate the financial markets. Don't forget to follow us on social media and join the conversation using the hashtag #WhatsFlowing. Until next time, I'm Moneymagnateash, wishing you successful trading!

The yield Curve almost Inverted again while Inflation soaredThe yield Curve almost Inverted again while Inflation soared. The worst thing for the risk assets like equity is full of participants who now need to face the Fed Fund Rate being hiked up by the Fed, which is currently under more pressure to increase Fed Fund Rate against higher Inflation which is 8.6% released this week. In contrast, the 2-year bond yield goes up this week.
That means three things:
1. The higher rate, the higher the "cost of money" - Bad things for Risk Assets
2. The spread of 10 yr treasury yield minus 2 yr treasury yield almost goes down to negative, which means short-term bond yield has potential higher than long-term. Once 10yr-2yr is negative, the inverted yield curve occurs.
3. the S&P 500's chart is now like 2008; the former is a Head & Shoulders, and the latter was a Double-TOP.
We are probably already in the worst stock market condition since the global financial crisis of 2008-2009. Whether the Fed will increase its rate or not, the stock market needs to pay back since the Fed printed a lot of money to "save" the market in early 2020. Conservatively, I won't say that the U.S. economy is plunging into a recession right now, but at least the stock market's value is into a contraction in advance. The exogenous factors like Ukraine War and China's lockdown are affecting the manufacturing of the USA. Inflation is now causing the consumption problem in such an environment, the U.S. Saving Rate is going down, and the PCE is. But if you look back in 2009 and 2019-2020, while the PCE was going down, the U.S. Saving Rate was going up, which means that the consumers in the U.S. still had spending power, unlike this time.

The big week for Central BanksWhile the July FOMC meeting is likely too soon to initiate the first cut, it isn't too early to began preparations for a rate reduction in September.

US 10Y TREASURY: the FOMCDuring the previous week markets full attention was on PCE data which were published on Friday. The PCE index rose 0.1% for the month, and 2.5% on a yearly basis, which was fully in line with market estimates. The evident slowdown in inflation in the US increased the probability that the Fed might make the first cut in September this year. The 10Y US benchmark yields were reflecting the investors sentiment during the week, moving from 4.3% at the start of the week, and ending it at 4.19%.
As the FOMC meeting is scheduled for the week ahead, some increased market volatility is quite expected. Market is not expecting that the Fed will cut rates during this meeting, however, any change in rhetoric of the Fed Chair Powell might trigger higher market volatility. At this moment, there is a high probability that the market will test 10Y yields for a potential for lower grounds from the level of 4.20%. Some short move to the levels above 4.20% is also possible, but these levels are not expected to hold for a longer period of time.

A Recession Is Coming - Brace for Impact First things first
What is a Recession?
A recession is a period when the economy isn't doing well. It means businesses are selling less, people are losing jobs or not getting raises, and overall, there's less money being spent. It's like a slowdown in the economy where things are not growing, and sometimes they shrink. This period of economic decline usually lasts for a few months or longer. Usually, when we have two consecutive quarters of negative Gross Domestic Product (GDP) we say that we are in a recession.
Now, let's look at previous recessions to see if we can find some patterns that help us predict the coming one. 😊
This is how you can navigate through the chart:
- past recessions are highlighted with orange colored boxes based on the data from "FRED economic data".
- The purple line chart shows the US inflation rate.
- The US GDP is shown in a green step-line chart.
- The US interest rate is shown with an orange line.
- The Yellow line chart shows the unemployment rate in the US.
- The most important line chart here is the blue one that shows the spread between the 10-year bond yield and the 3-month bond yield (Yes we could also use 2-year instead of 3-month).
This blue line, the yield curve, is important to us because it's a reliable indicator that almost every time gave us a heads up for a recession (if you were looking at it of course 😁). When it falls below zero, we call it the inverted yield curve and we hit a recession almost every time it gets back up after spending some time below zero.
An inverted yield curve tells us that the market participants are concerned about future economic growth It can lead to tighter financial conditions, reduced lending, and lower consumer and business spending, which can contribute to a downturn in the economy.
With that said, take a look at the chart and you can easily spot the repetitive pattern of interest rate hikes/cuts, unemployment rate, and the inverted yield curve just before each recession.
With the strong possibility of having the first rate cut in September, and the patterns you see on the chart, can you say that we are going to have a hard landing and a recession? I would say yes.
If you say we are not going into a recession and your counter argument is backed by a low unemployment rate and a positive GDP and a declining inflation rate, this chart does not support the idea.
I know there are other factors that might support the soft landing scenario, and I would like to have your point of view on this. So, please share your thoughts in comments section if you are reading this post through Tradingview. 😊
For further research, you can pull up the charts of indices like S&P500 or commodities of your choice to see how they moved during each recession. This will help you find some patterns that might assist you in your future investments.

US10Y - Lackluster TradingBased on the weekly timeframe, candlestick closed out as a bearish shooting star, alongside a gap opening @ 4.235 - 4.217% which can be classed as a volume imbalance. The weekly timeframe has left a sour taste in buysides mouth as the upper wick has poached the mean threshold of the 1st -8th Jul monthly timeframe before closing lower.
The two days that we have seen massive impact is Thursday and Friday, with the weekly order block being tagged on the Thursday and the Thursdays daily low taken out on the friday via a candlebody closure below sellside. This indicates further weakness and a possible continuation to the downside, at least to 4.144% weekly sellstops.
With a slight adjustment of the weekly order block, (so, instead if the 4th March 24 OB, 29th Jan 24 OB) i can see that last weeks trading range was 1 tick off from the array @ 4.145%.
With unfinished business at this region, it's safe to say that if the market continues lower, 4.038% will be the end target for next week as a draw on liquidity

$US02Y $US10Y $GLD $IVOL $TLT - The Chart tells the futureHere we have a historical chart showing what will likely be obvious in 2 quarters. The chart bats 100% on the issue but not on the resolution. As you can see with LTCM and the Bhat crisis in the late 90s. This chart is great for signaling when to risk-off, it does not signal risk on, for that I use the CBOE:BXY . The way I play the waiting game after going risk off is exposure to AMEX:IVOL NASDAQ:IEF AMEX:GLD NASDAQ:TLT AMEX:UUP
Cheers,

US10Y - Stance Resistance @ 4.249%. Will It Break?Smooth edges loves to become jagged in the market and with 4.249% being a weekly double top, this could potentially entice more short traders into the market as the logic is 'sell resistance, buy support'
I go against that logic so 4.282 - 4.288 will be the next draw on liquidity if we are to see a continuation to the upside

10 year Treasury- Massive Head and Shoulders on the Weekly ChartAppears to have broken the neckline, targeting 3.5% or 2.76% in the next few months

Yield disinversion signals bonds to new All Time HighsEvery time since the 1980's when the 10s & 2s yield inversion completes and the curve returns to normalcy, bonds rocket to new all time highs. The yield curve is currently disinverting at a quick pace

US10Y yield to 8%+I know most people don't think this is a possibility, but I think it's highly probable.
I think we'll see the US10Y break the recent highs and head to 5.59% as the first target to the upside. Then I think we'll continue the bullish trend and end the bullish move in yields at 8.13%, I think at that point, that's when you'll want to go long risk for the long term.
I think shorting the 10yr and 20yr bonds, might be a great trade over the next 6 months. I think the start of the move might take a little bit to play out, but should really gain steam from March onwards.
Let's see what happens over the coming months.

New high in yields by November?I don't think anyone is expecting this, but I think we're setup for yields to hit new highs this year.
The chart indicates yields are breaking out to the upside again, and this move could be a strong one.
I think we're setting up to see a new high in yields by November topping somewhere between 5.35%-6.40%.
Let's see if it plays out.

Yield curve uninverting again todayUS 10Y is rising again faster than the US 2Y. We are closing in the 0 level.

Brazil interest rate trend downInterest rate in brazil is showing weakness,,, giving opportunity to buy brazilian bonds

is this signalling a market crash? The yield curve invesrion remains in place for the longest historical inversion run.
This cant be good right?
History shows once the spread between the 10 & 2 corrects back to normal / un-inverts you usually get a sell signal in the market.
We are observing a massive bullish wedge pattern unfolding and looks poised at any moment to breakout.
The un- inversion breakout usually happens quickly and sharply.

US Yeilds ForecastReasons for execution
1)PML LIQUIDATED
2)+BOS (internal)
3)0.382 Fib & Fvgs
4)+OF
5)1.618 FIB EXPANSION

US Yeilds ForecastReasons for execution
1)PML LIQUIDATED
2)+BOS (internal)
3)0.382 Fib & Fvgs
4)+OF
5)1.618 FIB EXPANSION
