10yr Treasury Yields Consolidate at Key 4.32% LevelThe world’s most important market, the 10yr US Treasury, is trading directly at a critical level. Going back years, the 4.32% level has served as reliable support/resistance, and today’s drop after peeking above that level yesterday has only emphasized the importance of that key level.
At the same time, the 10yr Treasury yield has put in a series of lower highs and higher lows dating back to Q4 of last year, creating a symmetrical triangle pattern that could lead to an outbreak of volatility in the coming weeks. A bullish breakout above 4.60% would hint at a possible retest of 5.00% (and likely weigh on risk assets like stocks and higher-yielding currencies), whereas a bearish breakdown in yields would open the door for a drop toward the December lows near 3.80%.
-MW
Government bonds

Yields are in a do or die situationYields are pulling back a bit from the run they had yesterday. It was expected to have a bounce at the support levels.
The 2Yr & 10Yr #Yield both look as if they want to settle a bit but time till tell . We will see how Yield reacts over the next few days. It is important as a crashing yield can mean higher prices all across the board in many assets.
We've stated before that they CANNOT lower rates but at the same time CANNOT raise them. Seems as if they are playing around a bit providing liquidity to keep markets propped up a bit AND they may keep rates steady or just have 1 rate drop, before election.
TVC:TNX

10 year minus 2 year yieldsWinter is coming...
10 year minus 2 year yields
weekly percentage scale chart
#recession

S&P500 & Nasdaq inverse correlated to 2/10yr curveThis is US10Y-US02Y (inverted) in blue, S&P500 in orange & Nasdaq in light blue.
The 2's/10's spread has steepened meaningfully 3 times this year & each time has coincided with a sell off in the S&P500 & Nasdaq. It's just steepened again & the S&P500 is holding it's 4hr 50ema for now having made a lower high. Let's see what happens.

US10Y 2024 FULL YEAR FORECASTI will start forecasting full years in advance
and provide updates from there finally understand how the bond markets works
dont be fooled folk 2024 nasdaq is crashing market is overbought the recovery was too quick
easy come easy go and only the informed are preparing their shorts
if u appreciate my work
like, tip, comment, follow

US10Y - Targeting Buystops This WeekBullish bias going into next week with high probability setup forming if we are to witness a short-term sweep of sellside @ 4.190% before a retracement

US 10Y TREASURY: PCE weekUS Treasury yields had a relatively calmer week. Higher volatility was exhausted after the FOMC meeting, two weeks ago. The economic data are weighted and in expectation of the new ones the 10Y US benchmark was moving within a relatively short range, between levels of 4.20% and 4.29%. However, the major concern of market participants continues to be when the Fed will cut interest rates?
Recent economic data are showing some potential that the US economy is beginning to slow down. This might be one of the triggering events for the Fed to cut interest rates, despite relatively elevated inflation figures. The week ahead is bringing PCE data for May, which is Fed`s favorite inflation gauge. In case of any surprises, the volatility might be easily back on markets. As per current charts, there is some potential for 10Y yields to test a bit higher ground, above 4.30%, while continuing to test the 4.20% level.

3M US10YThe 10yr treasury yield is headed to 8-10% in the early 2030’s, as the commodity super-cycle ensues. Expect a pull-back in yields to re-test trend-line, then it’s off to the races.

US10Y - 4.335% Equilibrium In The Works We are witnessing a relief rally from the massive capitulation last week.
A lil upside movement won't harm a fly right??

Bitcoin and Global LiquidityWhenever global liquidity increases, this liquidity increase fuels Bitcoin and supports Bitcoin's rise. This pattern has been continuing in the form of a sine wave since 2009. Global liquidity falls at certain times and rises at certain times. Since 2011, global liquidity has been rising in a low-speed trend, exceeding the previous peak each time it rose. Global liquidity, which last peaked in 2022, returned to a slow increase at the beginning of 2023. I think there is currently at least a 100% gap for this rise to be completed. I think Bitcoin will also rise as this gap is filled. I think it is essential for at least a long-term cryptocurrency investor to follow global liquidity closely. While this global liquidity is not meaningful to explain the SP500 or Nasdaq indexes, it appears to be in full correlation with Bitcoin.

German Bund Can Stabilize and Recover The EURUSD PairGerman Bund is nicely breaking above important trendline after a completed complex w-x-y corrective decline in wave B, which can now send the price higher for wave C towards 140 resistance area. If we respect a positive correlation between German Bund and EURUSD currency pair, then EURUSD could easily stabilize and recover.

Bund ProjectionsSometimes a drawing can speak better than words, or at least present an idea in a better and more efficient way. This project involves projected tendencies and forces that might affect the price, represented with the curves as attractors and influencers with their respective arrows pointing the direction of the potential simulated pressure applied to the tendencies of the market.
Rectangles are projected potential support and resistance in their respective time zone. The white one is different, the exception to the rule, but it could end up having some interesting price action near it (/if the price reaches that zone).
The purple cross is interesting with it's time stamp for a potential time zone of interest, while it's marked price level could be relevant if the price reaches it in this project. Orange rectangle is the wild card which could end up being irrelevant as trying to predict potential simulated scenarios of evolution of price action is not a concrete and exact science and we deal with probabilities and tendencies.
The purple monster curve wishes to be the big kahuna of the project if it ends up being a success, meaning relevant price action is to be watched near it. All elements can provide signals through Japanese Candlestick analysis and hunt for inflection points / reversals, but the purple one could be the big showdown whether it is a bounce, or a break and retest, the function of the curve is applied with the intention of catching as many as possible potential simulated scenarios and unfoldings of events.
Nen projects are for recreational purposes only and the authors are not liable in case of loss of capital caused by the trading decisions inspired by them. Every trader is responsible for his own trades and decisions. May the force of profits be with you!

US 10Y TREASURY: maybe September?Markets have survived another FOMC meeting, and volatility induced by their narrative. From initially planned three rate cuts during the course of this year, we have learned from Fed Chair Powell, that there will probably be only one rate cut this year. The markets have switched their attention on when this first pivoting might occur, with current estimates that it might be in September. Whether this will be the case it is unclear, considering that the Fed missed their own estimates, let alone estimates from the market.
The 10Y Treasury yields started the previous week around the level of 4.47% and during the week, Treasuries were traded higher in prices and lower in yields. The lowest yield reached was at 4.19%, still, the market closed Friday`s trading session at 4.22%.
The level of 4.20% should be tested in the coming period. In this sense, it should not be expected to have lower yields from the current ones. Some short volatility toward the upside is possible but not the significant one. At this point on charts, the level of 4.3% might be a target of 10Y yields, but only shortly.

US10Y - Roadmap next 2 yearsYields are currently in EW 4th wave correction, this should bottom by the end of 2Q for a sharp rally back to new highs end of year. 2025 will be the year of bear with a crash in all risk assets. Likely bottom near the golden fib @~2.5%.
Risk assets also should follow this path along hand in hand. So bullish stocks until EOY after a brief correction in 2Q.

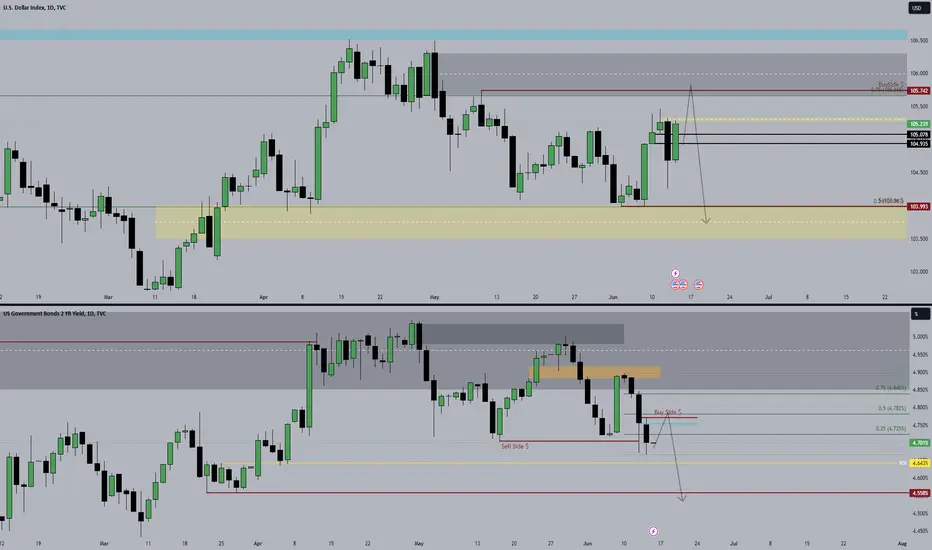
*SMC* DXY correlated with US02Y Bonds As we can see on the daily tf, DXY has created Relative Equal High at 105.459 which translate to this level being a liquidity pool. We are likely to see 105.459 being taken out put where can it go? As we can see, above 105.459, the closer PDArray is the OrderBlock (made the 30 Apr) which confluate with the 75% of the Dealing Range and another buyside liquidity pool at 105.742. I dont expect DXY to trade above the mean threshold of the OrderBlock and if it touched I expect a strong reaction to the downside.
Concerning the 02 year Bonds , the body has respected the OrderBlock (30 Apr) creating relative equal low which has been taken out (june 12). There is a ''crack'' in correlation right now between the DXY and the major Bonds of the US which leads me to think that there is a higher probability for the DXY to follow the Bound and drop lower.
Fundamentally, Powell has been pointing out the progress that has been made (which could eventually lead to a cut of rates) However, the ''Dot Plot' ' surprised the market of a likely to only 1 cut this year instead of 2-3 rate cut priced-in, which could be the reason why DXY has been going higher the last couple of days.
Yields are still selling off after yesterday's dropLet's see how the TVC:VIX does over the next few days/weeks.
Still think it eventually breaks its major support level, at least temporarily.
The 2Yr and 10Yr are crashing and following yesterdays drop. TVC:TNX
#interestrates, as we said, will likely be cut, even if a little. They will most likely be raised again next year. Not political...
Anyway, since we have stated COUNTLESS times. They CANNOT lower rates but MUST lower them.

Bearish on DXYThis week we have CPI and US Fed funds rate announcements. Most probably we don't get a rate cut for now (as the market expects). However, I think this week the announcements are coming out with a more dovish tone.
Let's see what happens . . .
If the CPI number come out lower or equal to the expectations and the Fed Chair Powell signals 1 or 2 rate cuts for this year. I believe we can expect the yellow scenario. Otherwise, we can expect the red scenario happens in short term.

US10Y-US02Y yield curve may disinvert in 2Q 2024Not many folks are looking for this as everyone seems to be calling for bonds to rally but I think there is a pretty good chance we get a flat 2's-10's sometime during Q2
Historically not a great omen for stonks when the curve disinverts

US10Y - 4.457% In Danger This Week...Expectations has been shifted and now the bulls has taken charge!
Expecting 4.457% to be met this week!

US30Y could push up tomorrow!Let's see how it plays out.
Price is in deep discount right now. Lets see!

US 10Y TREASURY: FOMC induced volatilityThe 10Y US Treasuries reacted to jobs figures data posted on Friday. The data were somewhat mixed. On one side, unemployment for May showed an increase to 4.0% from 3.9% posted for the previous month. On the other hand, the non-farm payrolls with 272K jobs added, significantly surpassed market expectations of 190K. The market is expecting for the jobs market to slow down as it will be the first sign for the Fed to pivot, as inflation is holding sticky above 3%. However, May data were sort of mixed. The Fed is meeting on Wednesday, and the majority of market participants are of the opinion that the Fed will keep interest rates unchanged at this meeting. Based on the CME Group's FedWatch Tool there is currently a 68% chance that the Fed will pivot in September this year., based on traders’ expectations.
A mixed mood has been evident during the previous week. The 10Y US benchmark was moving toward the downside during the week, reaching its lowest weekly level at 4.27%. Still, Friday’s trading session brought a change in sentiment, where the market returned yields toward 4.43%, due to posted jobs data. As FOMC will decide on interest rates on Wednesday and will communicate its macro projections with the wider community of investors and traders, it implies that the increased volatility might be ahead for another week. Still, the markets should eventually calm after they price all available information.

Crucial 10-year note auction this week. The Fed’s rate decision and FOMC statement will thus take center stage this week but the latest US CPI figures for the month of May will also be released along with the US 10-year and 30-year bond auctions.
The 200-day MA of 4.35% has held support and another Fed pause will allow yields to rise and re-test levels above 4.50%

Extensive Analysis of the US Government Bonds 10YR Yield Chart (Overview
The chart for US Government Bonds 10YR Yield on the 4-hour timeframe shows significant movement with the price rebounding from a recent low. The indicators used include Moving Averages, Bollinger Bands, Commodity Channel Index (CCI), MACD, and Support and Resistance levels.
Key Observations
1. Moving Averages (200 MA and 50 MA):
• 200 MA (Green Line): The price is currently below the 200 MA, indicating a bearish long-term trend.
• 50 MA (Blue Line): The price is also below the 50 MA, reinforcing the short-term bearish sentiment.
2. Bollinger Bands:
• The price is at the middle Bollinger Band, indicating that the market may be at an equilibrium point. The previous move was from the lower band, suggesting the market might be moving back towards the upper band.
3. Commodity Channel Index (CCI):
• The CCI is likely around 0 or slightly positive, indicating neutral to mildly overbought conditions. This suggests a potential for a continuation of the current trend or a mild pullback.
4. MACD (Moving Average Convergence Divergence):
• The MACD line is above the signal line, and the histogram is showing increasing positive values, indicating bullish momentum.
5. Support and Resistance Levels:
• Resistance Zones: Strong resistance is seen around 4.550% and the strong high zone above.
• Support Zones: The recent low at 4.250% is marked as a weak low, with further support below.
Comprehensive Technical Analysis
1. Current Trend:
• The long-term trend is bearish, as confirmed by the price being below the 200 MA. However, there is a short-term bullish sentiment as indicated by the price moving upwards and crossing the 50 MA.
2. Equilibrium Conditions:
• The price is near the middle Bollinger Band, indicating a balance point. A move above this band could suggest a continuation towards the upper band, while a rejection could mean a return to the lower band.
3. Volume:
• Increased volume during the recent upward move indicates strong buying interest, which may continue to push the price upwards.
4. Key Support and Resistance Levels:
• Resistance: Significant resistance levels start from 4.550% to 4.700%.
• Support: The recent low at 4.250% and significant support around this level.
5. Momentum Analysis:
• The MACD indicates bullish momentum, suggesting the possibility of further upward movement in the short term.
Best Trade Opportunity
Given the current market conditions, the best trade opportunity appears to be a short-term buy trade to take advantage of the recent bullish momentum and potential for continuation towards higher resistance levels.
Trade Setup:
• Buy Level: Around 4.435% (current level near the middle Bollinger Band)
• Stop Loss: Below 4.300% (to account for potential pullbacks)
• Take Profit:
• First target: 4.550% (near the first resistance level)
• Second target: 4.650% (middle resistance level)
• Extended target: 4.700% (upper resistance level)
Trade Rationale:
• Bullish Indicators: The MACD and the recent upward movement suggest bullish momentum.
• Volume Consideration: Increased volume during the recent move up indicates strong buying interest, supporting further upward movement.
• Risk-Reward Ratio: Entering a buy position near 4.435% offers a favorable risk-reward ratio, especially with a stop loss below the recent low.
Summary
• Buy Opportunity: Enter at 4.435% with a stop loss below 4.300%.
• Targets: 4.550% (first target), 4.650% (second target), and 4.700% (extended target).
• Rationale: The market is currently showing bullish momentum, and the potential for continuation towards higher resistance levels is high given the MACD and volume indicators.
