Rates not looking to slow down, but have to be lowered, dilemma Short term #yield is higher.
Long term has turned & are catching a bid.
At the moment it doesn't look like they're going down any time soon & that is not good longer term.
Was speaking with loan officer yesterday & they believe they must lower before election. But, what if it goes higher before it goes lower?
TVC:TNX
Government bonds

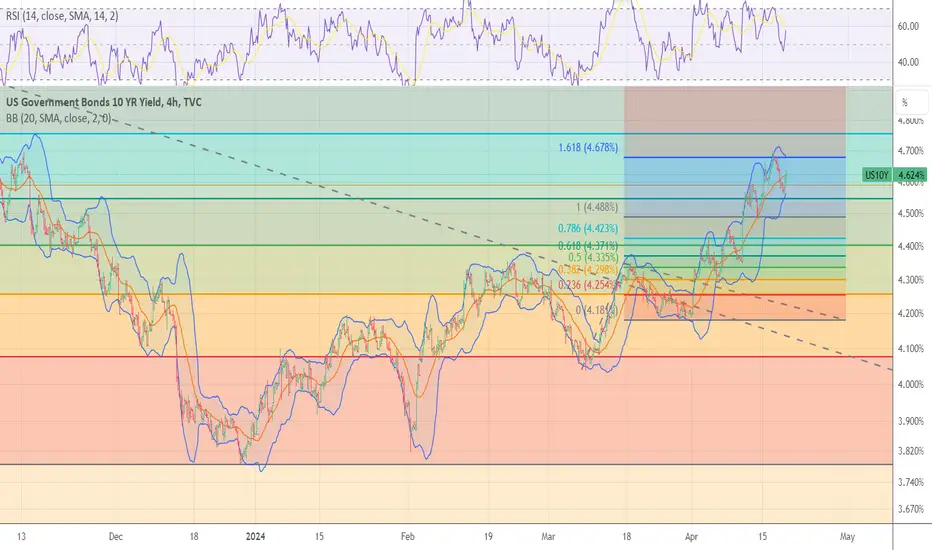
Fat finger buys on US10y in Asian sessionThe early morning Asian sessions saw some peculiar moves with the USDJPY pair falling to a low of 154.56. There are rumors of possible FX intervention from BoJ to save their vulnerable Yen. Simultaneously, there was strong buying pressure for the US 10year which is pulling yields down aggressively.
The US 10-year yield is showing signs of pulling back following the strong selling pressure since March and we should keep a hawk’s eye on yields given the volatility on the USDJPY pair.
I however expect the broader treasury sell-off to continue as long as the Fed stiks to its current hawkish stance. Big data is on the calendar as well with the FOMC statement and the US NFP's. A failed break below 4.50% will allow the US 10-year to return to the 2023 high of 5% in my opinion.
The yen is a particularly important domino in the current financial system since it is the carry trade currency of choice and Japan is also the biggest holder of US treasuries with roughly $1,500 billion US treasuries on their books. Intervention methods to save the yen will either be to sell-off US treasuries or increase interest, both of which cause the carry trade margin to decrease which will severely rattle the foundations of the financial system. The carry trade has been an exceptionally profitable one since the inception of casino capitalism as it allows investors to borrow (sell the yen) at 0% interest and then re-investing those borrowed funds into higher yielding bonds. This system is however showing sign of fragility and fx intervention from Japan may just close the buffet on this free lunch…

US 10Y TREASURY: all eyes on FedReleased data for the US economy during the previous week could point to the stagflation moment in the US during the course of this year. Posted data for core Personal Consumption Expenditures Price index show that in March it increased by 2.8% on a yearly basis, from 2.6% expected by the markets. At the same time, the first estimate for the US GDP Growth Rate was 1.6% for the first quarter of this year, while the market was expecting to see the figure of 2.5%. As it is evident that the inflation will persist during the course of this year, markets have decreased their expectations on three rate cuts for this year. As per CME Group FedWatch gauge, the market is currently estimating two rate cuts with a 44% probability rate.
One more week markets spent eyeing higher yields for US Treasuries, in order to adjust their previous estimates to new available information and sentiment. Although 10Y Treasury yields started the week around 4.6% level, they were looking for the higher grounds during the week, reaching the highest weekly level at 4.73%. Still, yields relaxed a bit during Friday`s trading session, when they returned to the level of 4.66%. The market nervousness will continue during the week ahead, considering that the FOMC meeting and Fed's rate decision is scheduled for the 1st May. Any new information that Fed Chair Powell shares with markets will be immediately priced through yields. Based on current charts, there is some probability for yields to reach 4.8%, but it should be taken with precaution. On the other hand, there is also high probability that yields have peaked, and that some relaxation might be expected in the coming period. What is certain at this moment, is that markets will continue to trade in a nervous manner until they finally hear the Fed's decision and their perception on the US economy and potential future rate cuts.

Time to short 10 YR YIELDS and Long TLT? 🤔
1O YR yields may have topped and are retracing. Yields are rolling down ⤵️
TLT is up ticking 📈 as yields come down as expected 🧭

US 10Y yields higher than Greek 10Y YieldsIn case you missed the memo....
US 10 Year bonds have a higher yield than Greek 10 Year ones..

US10Y - Continued LongsMy projection for this week was a bit late but nonetheless, bullish projections of lowest displacement fair value gap was the target and yields achieved it, topping out just before CE was met @ 4.696%. Shortly after, yields witnessed a sharp paintbrush retracement mid week and never closed out higher than the highs printed on Wednesday 17th April 2024.
On Friday, the last trading day for the week yields experienced a sellstop raid, taking out this week’s whole sellside range whilst closing bearish but up 90% from the manipulated downside sweep indicating that buystops is next on the horizon. The daily order block was also respected @ 4.593% with Fridays candle body closing above that price point as well as above the weekly Sep - Oct 23 liquidity void.
My philosophy is simple...
Fortify Michael J Huddlestone's concepts that I have studied to consistently predict where the market is more likely to go.
This includes;
- Market Structure
- Buyside/Sellside Liquidity
- Order Blocks
- Liquidity Voids
- Fair Value Gaps
- Optimal Trade Entry
- Premium/Discount Array
- SIBI/BISI
- Many More!
The strategies mentioned here are some of many that I use to implement into my analysis and over time, with consistency I aim to achieve a high degree of accuracy in the markets with the foresight and understanding to assess what went wrong when my bias is negated.
Credits;
- Michael Joe HUDDLESTONE
- Shawn Lee POWELL
- Toray KORTANOn that note, I am expecting further bullish price action, attacking the consequent encroachment @ 4.735% with a possibility that the buy programme will elevate price action up to 4.80%, upper displacement weekly fair value gap.
On that note, I can expect a selloff in bonds as yields and bonds tend to have strong reverse correlation.

10 Year to 5% or 5.5%10 year looks to be heading to 5 or 5.5 %. MACD and RSI showing upward trend on weekly still. Upward fib extension looks to retest previous high or beyond if Fed doesn’t lower rates anytime soon. Looking for CPI prints to see whether Inflation is going back up which may impact 10 year and I believe the market will continue down while 10 year heads upwards so I’m short the market.

Time to short 10 YR YIELDS and Long TLT? 🤔1O YR yields may have topped and are retracing to 4.4%. ⤵️
TLT which have an inverse relationship with the yields are reversing back up. 📈
Time to short 10 YR YIELDS and Long TLT? 🤔
🧭
👇

Analysis of US 10-Year Treasury Bonds (US10Y)Introduction:
I won't have many comments on the US 10-Year Treasury Bonds (US10Y) as the statements made by Chairman Powell could alter the chart. In my estimation, it seems unlikely that there will be further interest rate cuts for a while, which could have positive implications for the price of gold.
Technical Analysis:
The chart for US 10-Year Treasury Bonds (US10Y) could experience volatility due to uncertainties. However, the statements made by Chairman Powell could have a significant impact on the markets. Therefore, short-term movements in bonds may not be predictable.
Risk Warning:
This analysis does not constitute investment advice and is based solely on personal opinions. Due to market volatility, investors should conduct their own research and consider their risk tolerance.

US 10Y TREASURY: first cut in September? To be or not to be – the rate cut this year? The markets switched their expectations from March and May toward September, although currently not with high certainty. Recent data show still high resilience of the US economy on tight monetary policy. Retail sales in March were increased by 0.7% on a monthly basis, which was a figure much higher from 0.3% expected by markets. For markets, this information means that the inflation might pick up further, so the Fed will be reluctant to cut interest rates. Still, Friday trading session brought some strong corrections in 10Y US yields. Although Treasury bonds were traded at 4.69% at their weekly peak, they slipped on Friday till the level of 4.5%. Still, yields are ending the week at 4.62%. The modest drop in yields during Friday was the result of developments in the Middle East, however, the markets swiftly corrected their view, turning it toward the current fundamentals.
Aside from fundamentals which are not quite favored by markets, the geopolitics will continue to have their own influence on markets. In this sense, some relaxation in 10Y Treasury yields should be expected, however, they will react to any negative news related to the Middle East crisis. Markets will continue to weigh on the risks from this side.

Possibly a bit lowerUS10Y possibly heading lower towards 4.30 after a huge spike all the way to 4.70

US 10-year yields back to 5%The US treasury market is becoming agitated at the latest Fed stance that rates may most likely remain unchanged through the 2Q2024 and 3Q2024 which has put upward pressure on the US treasury yields. US 10-year yields broke back above 4.50% last week and a continued sell-off will see yields spike back to 5.00% for as long as the current Fed narrative holds it ground. Additionally, the 50-day MA has crossed above the 200-day MA, the infamous golden cross.

US10Y - Bull Run Rages On!Last weeks bullish projection played out as expected with the monthly OB and liquidity void being met by the end of this weeks trading.
Trend is your friend and although it's not guaranteed we will continue to trend upwards, there's a higher probability that US10Y does rather than not on a weekly timeframe. This does not mean this weeks price action will reprice upto the lower displacement fair value gap @ 4.667% but throughout the month of April this what i will be on a lookout for.
Minor retracement during the week is acceptable with the weekly BISI in mind but i do not want to see a daily closeure below @ 4.274%.
My philosophy is simple...
Fortify Michael J Huddlestone's concepts that I have studied to consistently predict where the market is more likely to go.
This includes;
- Market Structure
- Buyside/Sellside Liquidity
- Order Blocks
- Liquidity Voids
- Fair Value Gaps
- Optimal Trade Entry
- Premium/Discount Array
- SIBI/BISI
- Many More!
The strategies mentioned here are some of many that I use to implement into my analysis and over time, with consistency I aim to achieve a high degree of accuracy in the markets with the foresight and understanding to assess what went wrong when my bias is negated.
Credits;
- Michael Joe HUDDLESTONE
- Shawn Lee POWELL
- Toray KORTAN

The US10Y is crazy! Doesn't make sense1981 to 2020 - 39 years! the US10Y has been going down!
In 2020 it's start reversing like crazy!
What is going on!

US10YR Seems to Head to 5.2%US short term funding requirements (33% of existing debt to mature next year) + a clean unbroken trend seems to head the 10 yr yield to 5.2%. This view doesn't constitute investment advice.

US-German yield spreads suggest higher Dollar IndexIt's reasonably well appreciated that the biggest component of the dollar index DXY is the euro. Therefore when trying toanalyse the future direction of the Dollar one needs to consider what is happening to the spread between yields in the two main economic areas (US and Germany as a proxy). If we look at US10Y-DE10Y historically we can see, as might be expected, when the spread rises/widens the Dollar strengthens. So to me, it loks like wwe are currently forming a bullish flag consolidation pattern in the yield spread, suggesting that at some point soon we will get a move higher in the spread, and with it a higher DXY.
NOT INVESTMENT ADVICE.

20 year bond yields entering Rotation DownwardAnother TLT play is about to start. The 20 year bond yields are rejecting off the channels resistance and will likely move back down to the 200 mda and maybe the bottom of the 4 months upward channel. TLT will respond inversely to this. I have been playing TMV and TMF back and forth since November. I'm up 70% over that time. I'll will likely buy into TMF tomorrow if the machines drop the 20 year off of the resistance. If so, then I'll be ready to dump at the 200mda if we look like we will reject off of it.
If the 20 year keeps bumping sideways off the top of the 4 month channel - then I'll be ready to buy into TMV once it breaks out above it.

10 yr yield targets are being met into 4.70plus .Bonds are ready for a nice Short term rally be long TLT and do NOT be short stocks
Bonds, DXY are down. Commodities down too, no hedgeHistorically when Bonds and US Dollar DXY are down, then Commodities go up. Their inverse correlation is currently broken.
Just something to monitor and warning that something is out of order which should be ringing alarm bells

TLT Long - We may see an improvement in a narrow windowI expect a rise around TLT 89.8 at 16.04. This means a pullback of 4.53 for US10Y.

10 Yield yield is ready to destroy SPYThe 10-year yield is in a huge symmetrical triangle.
Break out of it would trigger a massive move in rates. Rates are moving up due to the very hot inflation report.
Let's see if will it be rejected or if this will be the end of the bull market for now!

Long term bonds are much higher than when bank fiascoShort term bonds are still trading below the bank fiasco crisis.
1 & 2YR Yields.
However.......
Long term #yield is higher than it was during the bank fiasco.
10 & 30 YR #Yield.
Normalization of the curve is still a ways off.

US30Y: A Deep Dive into US30Y Bond Swing-Trade OpportunityThe US30Y bond is a type of loan that the United States government takes from investors. It's called a "30-year bond" because it takes 30 years for the government to pay back the loan in full. When you buy a US30Y bond, you're essentially lending money to the government, and in return, they promise to pay you back the amount you lent, plus interest, over the 30-year period.
People trade US30Y bonds because they can buy and sell them before they mature. This means you can potentially make money by selling the bond for more than you paid for it if its value goes up, or you might sell it for less if its value goes down. The value of the bond can change based on factors like interest rates, inflation, and economic conditions.
Most investors often see US30Y bonds as a safer investment compared to stocks because they're backed by the government.
However, they still carry risks, such as changes in interest rates or inflation levels. So, people who trade US30Y bonds need to carefully consider these factors before making investment decisions.
Now let's get into the detailed analysis of this bond
12M:
6M:
3M:
1M:
1D:
