US Treasury 10Y Technical Outlook June 30-July 4 (Updated Daily)US Treasury 10Y Technical Outlook June 30-July 4
Overnight
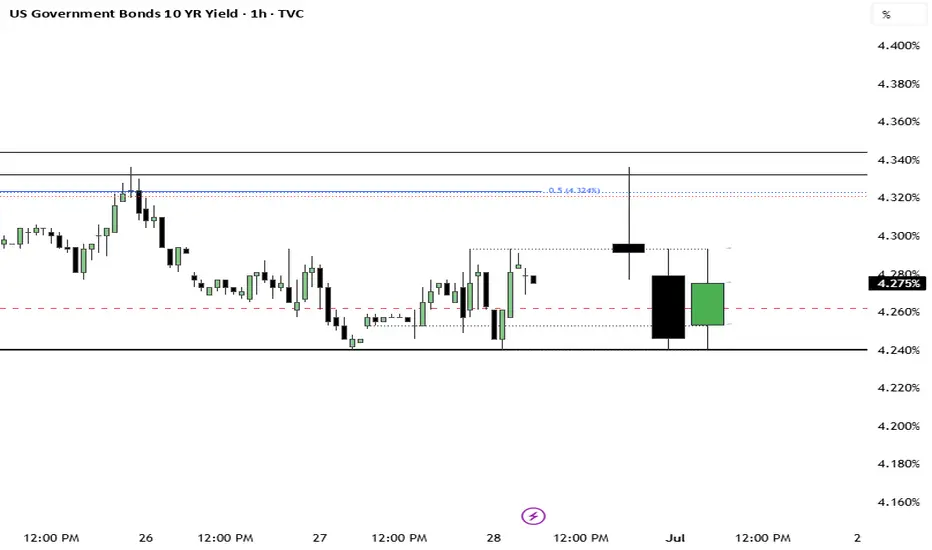
On June 27, 2025, the US 10-year Treasury yield rose to 4.26% after five sessions of decline, as markets anticipate earlier Fed rate cuts. Recent data, including subdued PCE inflation, a sharp drop in May consumer spending, a 0.5% Q1 GDP contraction, and rising jobless claims since 2021, support these expectations. Fed Chair Powell’s dovish congressional remarks and potential new Fed leadership by September or October further bolster a dovish policy outlook.
Economic Release for the Week www.myfxbook.com
Technical Outlook
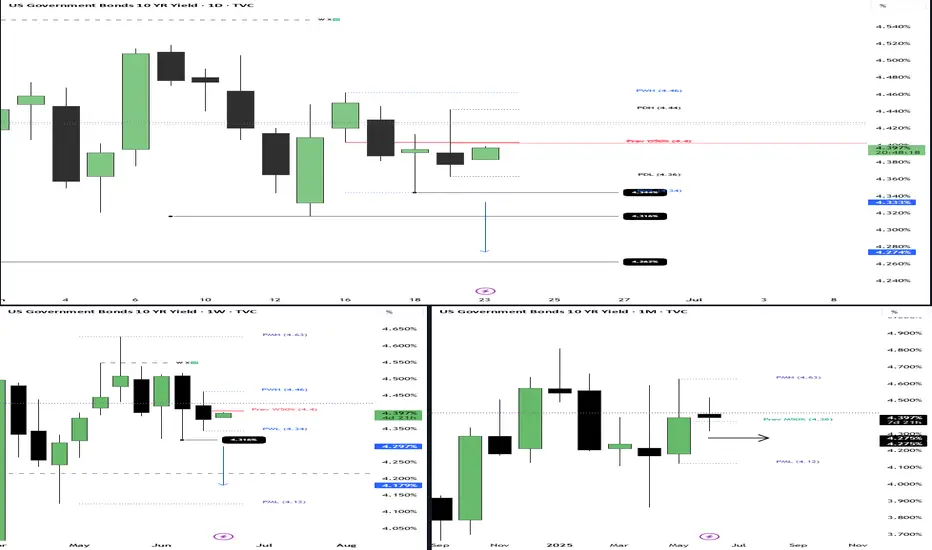
On the monthly chart, , we can see that price is trading below the 50% level of the previous month’s, May, range showing bullishness in price. Weekly chart, , we can see the previous week low (PWL) has been broken and closed through suggesting the yield could continue to fall and im looking at 4.24% as a target for the week. Daily Chart, we can see that it did not break Thursday’s low instead priced bounced and gave a green candle. This tells e that there’s a possibility of a technical correction. Im looking at the daily supply area (D -OB 4.332%) for a possible target.
**Disclaimer:**
The technical analyses provided herein are based solely on my personal analysis and are intended for my own study and reference. They do not constitute a recommendation or solicitation to buy or sell any financial instruments. Any decision made by individuals based on this analysis is their own responsibility, and I assume no liability for any losses or damages incurred as a result of using this information. It is advisable to conduct thorough research and consult with a qualified financial advisor before making any investment decisions.
Government bonds
US10Y & ZB1! (Bonds) Weekly AnalysisUS 10‑Year Treasury Yield (US10Y)
The 10‑year yield ended last Friday (June 27, 2025) at 4.27%
After peaking above 4.46% mid‑week, yields eased late‑week as markets increasingly priced in potential Fed rate cuts—a 25 bp move in July was seen at 22.7% probability, up from ~14%
This dovish shift, alongside a softer May PCE print, supported a lull in yield increases
Still, Inflation concerns and record debt issuance continue to underpin a term premium on long-duration debt
ZB1 – 30‑Year Treasury Bond Futures
The September‑expiry T‑Bond futures (ZB1) which trade inversely to yield, saw modest price appreciation, reflecting falling yields.
Futures prices responded to the dovish Fed tone and easing global tensions, aligning with stock market gains.
The spread between 10‑ and 30‑year yields widened to ~56 bp—the largest since late 2021—illustrating increased yield curve steepening, mirrored in futures.
------------------------------------
I will be approaching the markets differently from now on.
Based on the feedback from past analysis, I will be compiling all related pairs into one video, giving you guys the ability to see how one asset affects the other.
This is called inter-market relationship and it's something i've been doing for years.
It gives you confidence on what pairs are 'Hot Picks' and the ones that have a high chance of not delivering the way you want.

Long GiltsAll bonds have been accumulating for 2-3 years. I think the GILTS will outperform other developed country bonds and is a good investment for the coming year.

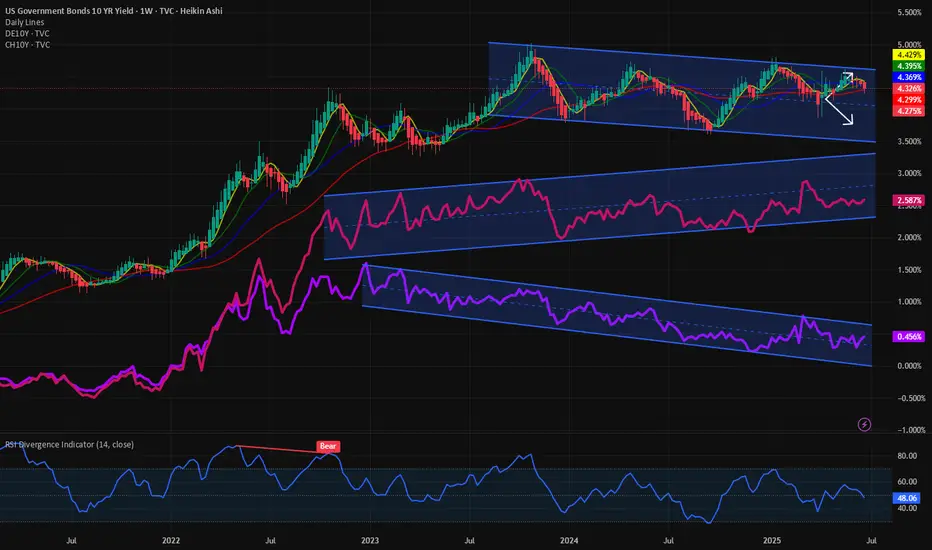
Price of fiscal profligacy: US10Y vs DE10Y vs CH10Y Today I will go unconventional in my analysis and look at the yields of 3 major economies with 3 different fiscal trajectories. Today we look at the 10Y Yield of US, Germany and Switzerland. 3 different countries with different Fiscal and Monetary policies off late.
The TVC:US10Y after touching the highs of 5% in Oct 2023 has been in a downward trend making new lower highs and lower lows but within the downward slopping channel sweeping the upper bound and the lower bound. Recently, touching the higher bound of the channel at 4.5%, since then it has reversed its course and gone down. On 26th May my article on TVC:US10Y and TVC:DXY forecasted 4.6% as the upper bound for the $US10Y. TVC:US10Y and TVC:DXY Divergence and correlation breakdown for TVC:US10Y by RabishankarBiswal — TradingView . We recently got rejected at 4.51%. So, the obvious direction for TVC:US10Y is lower with 3.5% as the lowest target.
Now switching gear to $DE10Y. The German Bunds are doing the reverse. They are making a series of new higher highs and higher lows. With increasing yields on the TVC:DE10Y and fiscal indiscipline on the part of German govt this is going to rise in the medium to long term.
Then we finally look at the Swiss 10Y which might touch ‘Negative’ in the near term. The Swiss central bank is on the path to reduce the rates to negative in Sept 25 meeting. The TVC:CH10Y at 0.45% brings back the memory of negative rates. But with global flight to safety and a fiscally conservative government the TVC:CH10Y is in huge demand hence pushing down the yields.
Verdict : TVC:US10Y ↘ between 4.3% - 3.5%, TVC:DE10Y ↗ between 2% - 3%, TVC:CH10Y TVC:US10Y ↘ between 0.5% - (- 0.25%)
US10Y: Signals Deeper Drop as Rate Cut Hopes BuildUS10Y: Signals Deeper Drop as Rate Cut Hopes Build
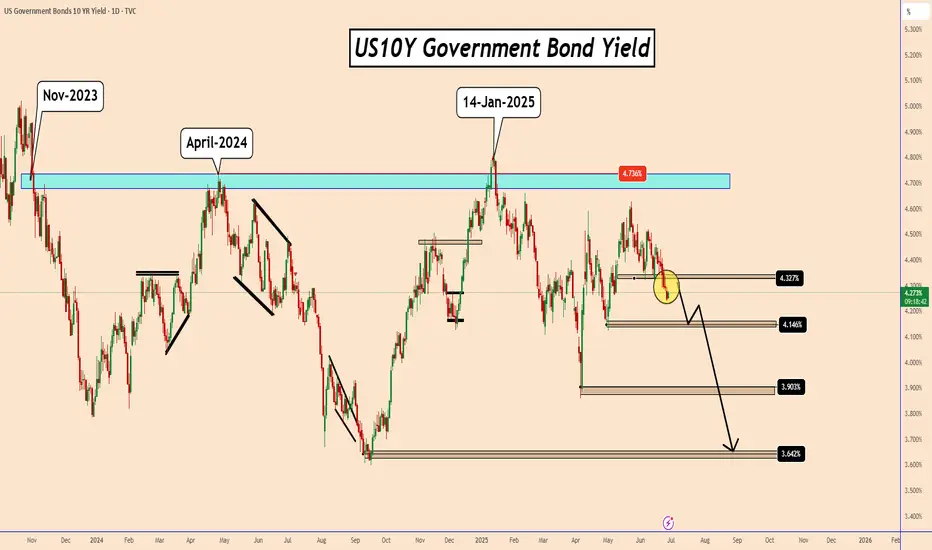
The U.S. 10-Year Treasury Yield (US10Y) has broken decisively below a key daily structure zone near 4.32%, marking a significant technical breakdown. If price action holds beneath this level, it increases the probability of a further slide toward 4.14% and potentially 3.09%—levels last seen in early April 2025.
From a broader perspective, the yield could eventually decline toward 3.64%, dating back to early September 2024.
This bearish momentum may begin unfolding today, especially if the PCE data hints at a potential Fed rate cut. During recent testimonies, Chair Powell emphasized a data-dependent approach, yet didn’t dismiss the possibility of a rate cut in the July meeting.
Interestingly, despite US10Y's decline, it may still provide temporary support for the U.S. dollar (USD) in these volatile conditions. The correlation between US10Y and the USD has weakened in recent months. Let's see what happens.
You may find more details in the chart!
Thank you and Good Luck!
PS: Please support with a like or comment if you find this analysis useful for your trading day
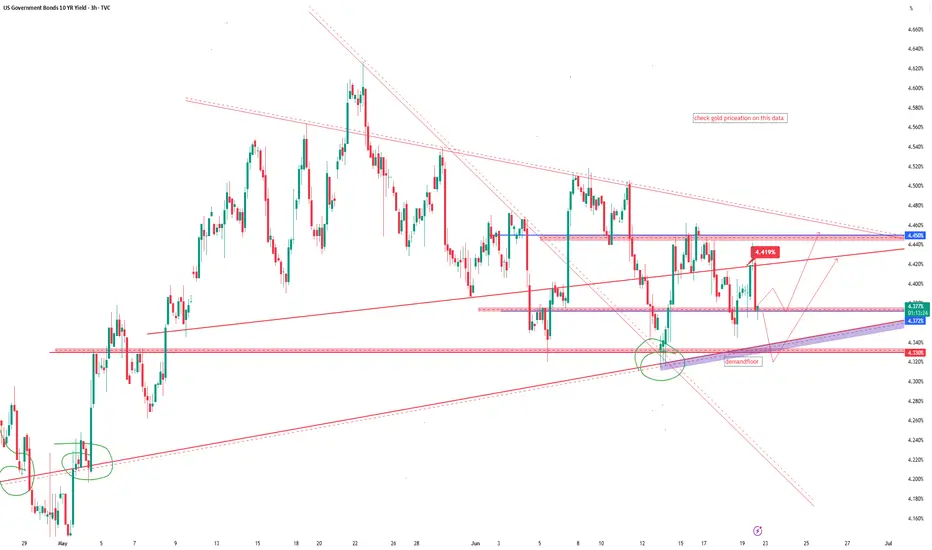
US GOVERNMENT 10 YEAR BOND YIELD.The correlation between the US 10-Year Treasury yield (US10Y) and gold prices is historically inverse but has shown periods of divergence due to shifting market dynamics
1. Typical Inverse Relationship
Gold and US10Y yields traditionally move in opposite directions due to:
Opportunity Cost: Higher yields increase the cost of holding non-yielding gold, pressuring prices.
Real Interest Rates: Gold tends to fall when real yields (nominal yield minus inflation) rise, as seen in pre-2024 data.
2. Recent Deviations and Drivers Since 2024, this correlation has weakened or reversed under specific conditions:
Geopolitical Turmoil makes Positive correlation (both rise)us10y and gold ,eg Russia-Ukraine war, Middle East tensions, and U.S.-EU tariffs drove simultaneous surges in yields and gold as dual safe havens.
De-Dollarization,Gold decouples from yields as mejor Central banks (e.g., China, Russia) bought gold aggressively, offsetting yield-driven pressure.
3. Yield Level: US10Y at 4.26%,
Correlation Status: Weakly inverse, but fiscal risks (e.g., U.S. deficit, trade policies) could reignite positive links.
Key Influencers Moving Forward
Fed Policy: Expected rate cuts (2×25 bps in 2025) may weaken yields, boosting gold.
Inflation Expectations: Sticky inflation could sustain gold’s appeal despite yield fluctuations.
Geopolitics: Escalations in trade wars or conflicts may re-tighten the positive correlation.
Summary
While the US10Y-gold correlation remains fundamentally inverse, recent structural shifts—geopolitical stress, fiscal uncertainty, and de-dollarization—have driven periods of alignment.
#dollar #gold

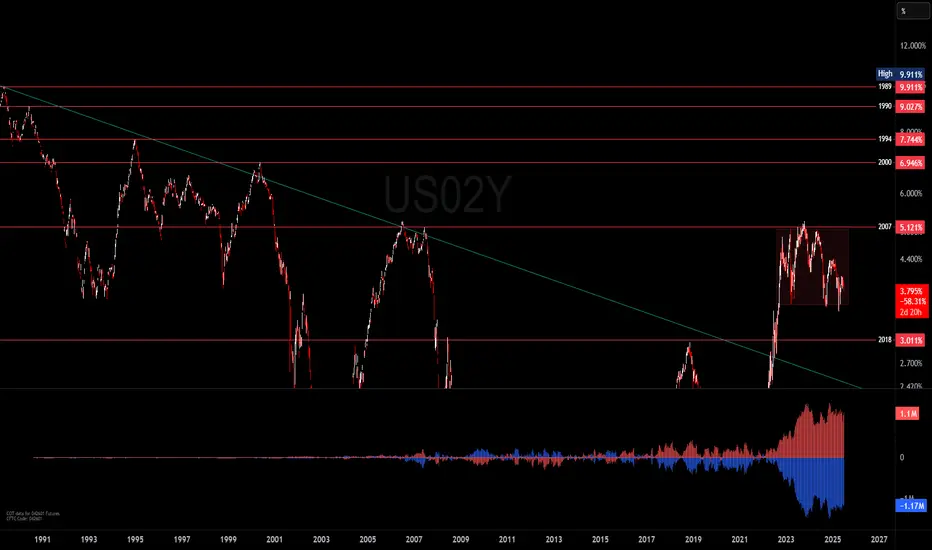
US02Y Bond LongUS02Y is now net long on the regression break.
There appears to be a increase in hedging as the stock market push to new highs.

Strange Markets Update (Bonds vs Stocks vs FX)The US Bond market is gaining in the face of NASDAQ / SP500 /CHF/JPY breaking or pushing their all time highs.
It shows that the moves in these markets are be meet with hedging in the US Bond Markets.
Just take note!

looks like a distributionThis is logaritmic chart from US2Y, commercials offloading their positions or the other part is closing their positions???
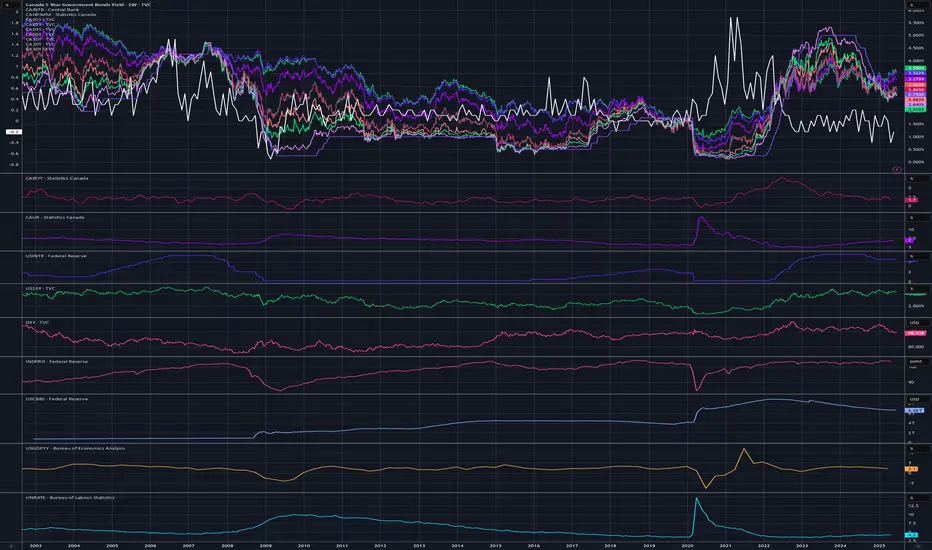
Canada macroeconomicsTreasury bond yields and house price.
Also include unemployment rate and inflation rate YOY
US10YAs of June 23, 2025, the US 10-year Treasury yield is 4.40%, reflecting a slight increase from the previous session. Recent data from June 20, 2025, showed the yield at 4.38%, and it has hovered in the 4.3%–4.5% range throughout June. This level is above the long-term average of around 4.25%.
The uptick in yields is driven by investor concerns over US fiscal policy, a growing budget deficit, and recent credit rating actions. Federal Reserve officials have also highlighted risks related to the labor market and inflation, with markets currently pricing in two possible 25-basis-point rate cuts by the end of the year.
Summary:
US 10-year Treasury yield (June 23, 2025): 4.40%
Recent range (June 2025): 4.3%–4.5%
Drivers: Fiscal concerns, inflation expectations, and Fed policy outlook
This yield is closely watched as a benchmark for global interest rates and risk sentiment.

US 10Y TREASURY: digesting FOMC ahead of PCEThe central event for financial markets during the previous week was the FOMC meeting. The Fed decided to hold interest rates at current levels, but two rate cuts till the end of this year are still on the table. This was in line with market expectations. Still, the Fed Chair Powell shortly commented on the potential for higher inflation in the coming period, as a reflection of implemented trade tariffs of the US Administration. The Fed is expecting to see it reflected in the inflation figures in the future period, but they will continue to be data-driven when deciding on interest rates.
Due to the FOMC meeting, the 10Y Treasury benchmark was moving with a higher volatility during the week, as was expected. The nervousness regarding Fed's next move on interest rates was high for some time in the past. The 10Y yields started the week around the 4,5% while ending it at 4,37%. The PCE data are scheduled for a release in the week ahead. If there are no surprises with the data, it could be expected that 10Y yields will have a relatively calmer week, with further relaxation in yields, moving above the 4,3% level.
US 10Y TECHNICAL OUTLOOK FOR THE WEEK JUN 23-27 (UPDATED DAILY)US 10Y TECHNICAL OUTLOOK FOR THE WEEK JUN 23-27 (UPDATED DAILY)
Geopolitical event
Early Monday in Asia, US equity futures fell and oil prices surged following US strikes on Iran's nuclear facilities over the weekend, prompting a risk-off sentiment that saw Asian equities decline and the dollar strengthen against major currencies. The US Treasury market faced pressure as investors anticipated heightened geopolitical uncertainty, with some expecting a flight to safety that could increase demand for Treasuries and push yields lower. However, concerns over potential oil supply disruptions and rising inflation risks could elevate real yields, potentially pressuring Treasury prices. Analysts suggest that while Treasuries may see initial safe-haven buying, sustained oil price spikes could complicate the Federal Reserve’s inflation outlook, impacting Treasury yields. The uncertainty surrounding Iran’s response and the risk of further escalation, particularly in the Strait of Hormuz, may continue to weigh on the Treasury market as investors reassess global economic implications.
Economic Releases for the week www.myfxbook.com
Technical outlook
For the monthly we maintain to be constrained within the previous month’s range as long as we don’t see any break from the range I will call the monthly range sideways. Weekly I would like to see a break below 4.316% to be bullish otherwise sideways. A break below 4.316% I will be looking at previous month low as a target. For the daily I would lie to wait how the market digests the ongoing Iran strike by the US for direction. But a break below 4.344% could be a bullish sign for me.
GB10Y BRITISH GOVERNMENT 10 YEAR BOND YIELD.1. GBP 10-Year Bond Yield
The UK 10-year gilt yield is currently around 4.54%, near its highest level since April 2025.
This yield increase reflects sticky inflation pressures and market expectations about the Bank of England’s (BoE) monetary policy stance.
2. Bank of England Interest Rate Decision
The BoE held its official Bank Rate steady at 4.25% in June 2025, with a 6-3 vote in favor of maintaining rates.
Inflation remains above target at 3.4% (May 2025), but there is evidence of easing price pressures in services and wages.
The BoE signaled that rate cuts could resume later in 2025, possibly starting in August, depending on inflation and labor market developments.
The central bank continues a cautious, gradual approach to withdrawing monetary policy restraint while monitoring inflation risks.
3. Impact on GBP Strength
Higher UK bond yields relative to other major economies support the British Pound by attracting foreign capital seeking better returns.
The decision to keep rates steady amid sticky inflation has helped maintain GBP strength near multi-year highs against the US dollar (around 1.34–1.35).
Market expectations of future rate cuts may cap further GBP gains but the current yield environment supports a relatively strong pound.
Geopolitical risks (e.g., Middle East tensions) and global economic uncertainties remain factors that could influence GBP volatility.
Conclusion
The GBP 10-year gilt yield near 4.5% combined with the BoE’s decision to hold rates at 4.25% supports the British Pound’s relative strength in mid-2025. While inflation remains above target, signs of easing price pressures and a cautious BoE stance suggest rate cuts could begin later this year, which may moderate further GBP appreciation. Overall, the bond yield and interest rate decision interplay is a key driver of GBP performance amid ongoing economic and geopolitical uncertainties.

This is how I see the odds split for a recession.This is how I see the odds split for a recession.
Above the black line, recession less likely.
Below the red line, recession more likely.
The Fed fund rate tracks this over time.

10 YEAR JAPANESE GOVERNMENT BOND YIELD JGB10Y1. Japan 10-Year Government Bond Yield and Price
The 10-year Japanese Government Bond (JGB) yield is around 1.40% to 1.52% in mid-2025, recently easing slightly to about 1.40% on June 20, 2025.
This yield level is significantly higher than the near-zero levels seen in previous years but remains low by global standards.
The bond price for the 10-year JGB hovers near 99.6 to 100, reflecting the inverse relationship with yields (as yields rise, bond prices fall slightly).
Japan’s bond yields have been rising steadily since 2022, reflecting market concerns about inflation, fiscal sustainability, and monetary policy shifts.
2. Bank of Japan (BoJ) Interest Rate Policy
The official BoJ short-term policy rate is currently at 0.50%, up from negative territory (-0.10%) a year ago.
The BoJ has maintained a very accommodative monetary policy stance but has started to allow some upward flexibility in long-term yields, including the 10-year JGB yield, moving away from strict yield curve control.
The BoJ is also considering buying back some super-long government bonds to stabilize the market amid rising yields.
3. Relationship Between Bond Yields, Prices, and JPY Strength
Bond yields and prices have an inverse relationship: as yields rise (reflecting higher interest rates or inflation expectations), bond prices fall.
JPY Strength is influenced by several factors related to bond yields and interest rates:
Rising Japanese bond yields tend to support a stronger yen, as higher yields attract foreign capital seeking better returns.
However, Japan’s yields remain much lower than those of other major economies (e.g., US 10-year yield ~4.4%), which limits yen appreciation.
The BoJ’s accommodative policy and yield curve control have historically kept yields low, suppressing JPY strength relative to currencies like USD.
Recent yield increases and policy shifts have led to some yen appreciation, but trade and geopolitical factors also play significant roles.
The trade deficit narrowing and ongoing trade talks with the US may also impact the yen’s value.
Conclusion
Japan’s 10-year government bond yield has risen modestly to around 1.4%, reflecting gradual monetary policy normalization by the BoJ, which still maintains a very low short-term interest rate of 0.5%. This yield increase supports some yen strength by attracting capital inflows, although the yen remains sensitive to global yield differentials and trade dynamics. Bond prices have adjusted accordingly, declining slightly as yields rose. The BoJ’s interventions, including potential bond buybacks, aim to manage market volatility amid these shifts.
JGB 10-Year vs. AU 10-Year Bond Yield Differential and Related Concepts
1. Current Yield Differential (June 2025)
The Australia 10-Year Government Bond yield is approximately 4.33% to 4.32% (recently around 4.31%).
The Japan 10-Year Government Bond (JGB) yield is about 1.40% to 1.52%, with recent figures near 1.40%.
This results in a yield spread (Australia minus Japan) of roughly 278 to 365 basis points (2.78% to 3.65%), meaning Australian 10Y bonds yield significantly more than Japanese 10Y bonds.
2. Carry Trade and Yield Differential
The carry trade involves borrowing in a low-yield currency (e.g., Japanese yen) and investing in a high-yield currency (e.g., Australian dollar) to profit from the interest rate differential.
Given the large yield spread (~3%), investors can earn positive carry by borrowing JPY at low rates (~0.5%) and investing in AUD bonds yielding above 4%.
However, carry trade profits depend on currency movements: if the AUD depreciates against the JPY, gains can be eroded or losses incurred.
3. Uncovered Interest Rate Parity (UIP)
UIP theory states that the expected change in exchange rates offsets interest rate differentials, implying no arbitrage profits from carry trades.
For example, if Australian yields are 3% higher than Japanese yields, the AUD is expected to depreciate approximately 3% versus the JPY over the investment horizon.
Empirically, UIP often fails in the short term, allowing carry trade profits, but tends to hold over the long term.
4. Covered Interest Rate Parity (CIP)
CIP states that the forward exchange rate between two currencies should reflect the interest rate differential, eliminating arbitrage opportunities via forward contracts.
In practice, CIP generally holds in developed markets, meaning investors can hedge currency risk using forward contracts, locking in the carry trade return minus hedging costs.
Deviations from CIP can occur but are usually small and short-lived in major currency pairs like AUD/JPY.
Summary Table
Aspect Details
Australia 10Y Yield ~4.31%
Japan 10Y Yield ~1.40%
Yield Spread (AU - JGB) ~2.78% to 3.65% (278–365 basis points)
Carry Trade Borrow JPY at low rates, invest in AUD for yield pickup
UIP Exchange rate expected to depreciate AUD by yield diff.
CIP Forward rates reflect interest differential, hedging possible
Implications for Investors and Markets
The large yield differential incentivizes carry trades from JPY to AUD, contributing to capital flows and exchange rate dynamics.
Short-term carry trade profits arise due to UIP deviations but are subject to currency risk.
CIP arbitrage ensures that hedged carry trades have limited risk-free profits, but unhedged positions carry exchange rate exposure.
Central bank policies, geopolitical events, and market sentiment can cause fluctuations in yields and exchange rates, impacting carry trade viability.
#BOJ

US10Ythe US 10-Year Treasury Yield (US10Y) stands at 4.39%-4.5%,The 10-year yield is a key benchmark for long-term interest rates in the United States and is closely watched by investors as an indicator of market sentiment regarding economic growth, inflation, and Federal Reserve policy.
The yield has been rising recently, reflecting investor concerns about US fiscal policy, inflation, and the outlook for Federal Reserve rate cuts.
Federal Reserve Interest Rate Decision (June 2025)
The Federal Reserve held its key interest rate steady at 4.25%–4.50% at its June 2025 meeting.
This marks the fourth consecutive meeting with no change in rates, as the Fed continues its cautious, data-dependent approach amid persistent inflation and moderate economic growth.
The Fed’s latest “dot plot” and projections indicate that two 25-basis-point rate cuts are still possible by the end of 2025, but expectations for cuts in 2026 and beyond have been reduced.
Key Drivers and Outlook
Yield Movements: The 10-year yield has climbed amid concerns about US fiscal deficits, credit rating downgrades, and the impact of tariffs and trade policy on inflation.
Fed’s Tone: The FOMC statement and projections reflect ongoing stagflationary pressures—slower growth, persistent inflation, and a slightly rising unemployment rate.
Market Expectations: Markets are pricing in two rate cuts by year-end, most likely in September and December, but nearly half of Fed officials see little or no room for cuts in 2025 if inflation remains sticky.
Conclusion
The US 10-year Treasury yield remains elevated as markets weigh fiscal risks, inflation, and the Fed’s cautious stance.
The Fed is holding rates steady but signaling that two rate cuts remain possible in 2025, with future moves highly dependent on incoming data, especially inflation and labor market trends.
Investors should expect continued yield volatility as economic and policy uncertainties persist.
US10Y UNITED STATES GOVERNMENT 10 YEAR BOND YIELD.the US 10-Year Treasury Yield (US10Y) stands at 4.39%-4.5%,The 10-year yield is a key benchmark for long-term interest rates in the United States and is closely watched by investors as an indicator of market sentiment regarding economic growth, inflation, and Federal Reserve policy.
The yield has been rising recently, reflecting investor concerns about US fiscal policy, inflation, and the outlook for Federal Reserve rate cuts.
Federal Reserve Interest Rate Decision (June 2025)
The Federal Reserve held its key interest rate steady at 4.25%–4.50% at its June 2025 meeting.
This marks the fourth consecutive meeting with no change in rates, as the Fed continues its cautious, data-dependent approach amid persistent inflation and moderate economic growth.
The Fed’s latest “dot plot” and projections indicate that two 25-basis-point rate cuts are still possible by the end of 2025, but expectations for cuts in 2026 and beyond have been reduced.
Key Drivers and Outlook
Yield Movements: The 10-year yield has climbed amid concerns about US fiscal deficits, credit rating downgrades, and the impact of tariffs and trade policy on inflation.
Fed’s Tone: The FOMC statement and projections reflect ongoing stagflationary pressures—slower growth, persistent inflation, and a slightly rising unemployment rate.
Market Expectations: Markets are pricing in two rate cuts by year-end, most likely in September and December, but nearly half of Fed officials see little or no room for cuts in 2025 if inflation remains sticky.
Conclusion
The US 10-year Treasury yield remains elevated as markets weigh fiscal risks, inflation, and the Fed’s cautious stance.
The Fed is holding rates steady but signaling that two rate cuts remain possible in 2025, with future moves highly dependent on incoming data, especially inflation and labor market trends.
Investors should expect continued yield volatility as economic and policy uncertainties persist.

10 year united states government bond yieldthe US 10-Year Treasury Yield (US10Y) stands at 4.435% newyork session,The 10-year yield is a key benchmark for long-term interest rates in the United States and is closely watched by investors as an indicator of market sentiment regarding economic growth, inflation, and Federal Reserve policy.
The yield has been rising recently, reflecting investor concerns about US fiscal policy, inflation, and the outlook for Federal Reserve rate cuts.
Federal Reserve Interest Rate Decision (June 2025)
The Federal Reserve held its key interest rate steady at 4.25%–4.50% at its June 2025 meeting.
This marks the fourth consecutive meeting with no change in rates, as the Fed continues its cautious, data-dependent approach amid persistent inflation and moderate economic growth.
The Fed’s latest “dot plot” and projections indicate that two 25-basis-point rate cuts are still possible by the end of 2025, but expectations for cuts in 2026 and beyond have been reduced.
Key Drivers and Outlook
Yield Movements: The 10-year yield has climbed amid concerns about US fiscal deficits, credit rating downgrades, and the impact of tariffs and trade policy on inflation.
Fed’s Tone: The FOMC statement and projections reflect ongoing stagflationary pressures—slower growth, persistent inflation, and a slightly rising unemployment rate.
Market Expectations: Markets are pricing in two rate cuts by year-end, most likely in September and December, but nearly half of Fed officials see little or no room for cuts in 2025 if inflation remains sticky.
Conclusion
The US 10-year Treasury yield remains elevated as markets weigh fiscal risks, inflation, and the Fed’s cautious stance.
The Fed is holding rates steady but signaling that two rate cuts remain possible in 2025, with future moves highly dependent on incoming data, especially inflation and labor market trends.
Investors should expect continued yield volatility as economic and policy uncertainties persist.

10 YEAR US GOVERNMENT BOND YIELD . the US 10-Year Treasury Yield (US10Y) stands at 4.39%-4.5%,The 10-year yield is a key benchmark for long-term interest rates in the United States and is closely watched by investors as an indicator of market sentiment regarding economic growth, inflation, and Federal Reserve policy.
The yield has been rising recently, reflecting investor concerns about US fiscal policy, inflation, and the outlook for Federal Reserve rate cuts.
Federal Reserve Interest Rate Decision (June 2025)
The Federal Reserve held its key interest rate steady at 4.25%–4.50% at its June 2025 meeting.
This marks the fourth consecutive meeting with no change in rates, as the Fed continues its cautious, data-dependent approach amid persistent inflation and moderate economic growth.
The Fed’s latest “dot plot” and projections indicate that two 25-basis-point rate cuts are still possible by the end of 2025, but expectations for cuts in 2026 and beyond have been reduced.
Key Drivers and Outlook
Yield Movements: The 10-year yield has climbed amid concerns about US fiscal deficits, credit rating downgrades, and the impact of tariffs and trade policy on inflation.
Fed’s Tone: The FOMC statement and projections reflect ongoing stagflationary pressures—slower growth, persistent inflation, and a slightly rising unemployment rate.
Market Expectations: Markets are pricing in two rate cuts by year-end, most likely in September and December, but nearly half of Fed officials see little or no room for cuts in 2025 if inflation remains sticky.
Conclusion
The US 10-year Treasury yield remains elevated as markets weigh fiscal risks, inflation, and the Fed’s cautious stance.
The Fed is holding rates steady but signaling that two rate cuts remain possible in 2025, with future moves highly dependent on incoming data, especially inflation and labor market trends.
Investors should expect continued yield volatility as economic and policy uncertainties persist.

US 10Y TECHNICAL OUTLOOK FOR THE WEEK JUN 16-20 (UPDATED DAILY) US 10Y TECHNICAL OUTLOOK FOR THE WEEK JUN 16-20 (UPDATED DAILY)
Overnight
U.S. Treasuries ended the week lower as rising energy prices sparked inflation concerns, potentially delaying Federal Reserve rate cuts. Crude oil surged $5.12 (7.5%) to $73.16/bbl, up 13.3% weekly, following Israel’s strike on Iranian nuclear facilities and Iran’s retaliatory missile attack, raising fears of further escalation. Treasuries began the day higher but steadily declined, pushing the 10-year yield above its 50-day moving average (4.374%), though it dropped nine basis points for the week.
Economic Releases for the Week
www.myfxbook.com
Technical Outlook
Monthly
We continue to trade within the previous month’s range with no clear direction. Range 4.63% -4.12%
Weekly
Technically hard to read were the market would go with all the geopolitical noise. Inflation was the concern reason why the yield went higher after the Israel-Iran issue due to surge in oil. This week, we might be able to see the direction after the FOMC on Thursday. So meantime I will hold my projection.
Daily
Same as weekly outlook. Will watch FOMC first.

US BOND Market ROUGH CORRECTION Q3 ?Us bond market failed the initial demand zone & drop 8 % in 2nd quarter & recovered, might visit the extreme demand zone in coming Q 3 which is around 9 % drop

US 10Y TREASURY: eyes FOMC projections The US inflation data were posted during the previous week, showing that the inflation continues to slow down, with 0,1% in May. Also, the University of Michigan Consumer Sentiment data are showing decreasing inflation expectations for this year at 5,1%, from previously posted 6,6%, while the five year expectation eased to the level of 4,2%. However, the unrest on markets was imposed by new Middle East tensions, which were also reflected in the Treasury yields during the previous week. The 10Y yields started the week at 4,5%, and closed it at 4,4%. The lowest weekly level was at 4,3% on Friday, but the Middle East unrest pushed the yields toward the 4,4%.
The week ahead brings the FOMC meeting and Feds macro projections, which is scheduled for Wednesday, June 18th. It is widely expected that the Fed will leave rates unchanged at this meeting, while the odds are increased for a rate cut in September. Certainly, the day of the FOMC meeting will bring some increased volatility, considering investors sensitivity to the Fed's narrative and especially projections. The next supporting level for the 10Y yields stands at 4,2%. However, considering the current unstable geopolitical scene as well as the FOMC meeting, there is also an equal probability for 10Y yields to test higher grounds, around the 4,5% level, but not higher from it.
