us10YRegarding the ten-year rate, we must say, the first important point that can be seen is in the green box and then the green lines, the resistance formed is also indicated by the red box. We will be in these ranges for a long period.
Government bonds

US10Y Areas to look out forUS10Y has just recently broken a major support with a retest. This would indicate bearish sentiment targetting next S/R zones below with daily MAs.

EUBUND 2D ChartedCurrently trading inside the resistance zone, these are the areas I'd look at next.

2 year Treasury monthly with Housing price indexContinuation of 2 year dictating (foreshadowing) the business cycle with housing prices added for reference. MACD doing the heavy lifting.

Big Bearish Bat in Yields Complimenting the TLT forecast:
Bat pattern in the 10 year yields. Norms of this pattern is to be super strong into the end, have massive attention and almost everyone expecting the move to continue.
Bats often both top and break with news.
Over the last days I've been strongly suggesting to real life friends they dump risk assets and buy bonds.
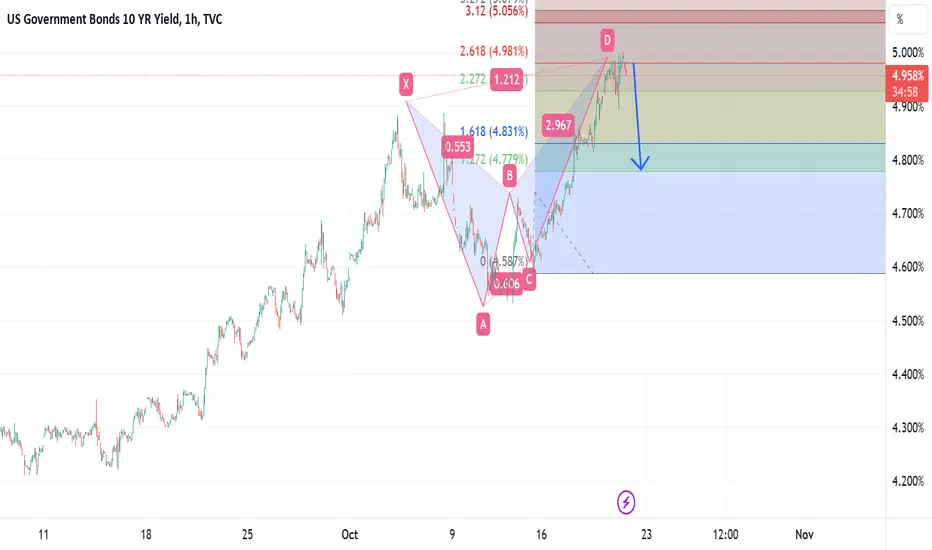
Back to long bias on yields. Correction was nicely signalled by a bat pattern.
We've now reached the 76 support level.
Unless we break the 76 my bias is now towards 6%.
Update to

US10YR and USD vs USDPLNUS10YR and USD vs USDPLN. Just a chart to see how the USDPLN compares to the US treasuries

US10Y: The goal from now on should be to buy the bounce.The US10Y is approaching an oversold technical state on the 1D timeframe (RSI = 34.650, MACD = -0.086, ADX = 44.537) as selling was accelerated this week after failing to get close to the 1D MA50. The long term pattern is a Channel Up and the decline since Octobet 23rd is the new bearish leg.
The one prior hit the 0.5 Fibonacci level of the rally and then rebounded to the 1D MA50 with the 1D RSI approximately on the same levels as today (S1 Zone). Consequently, our goal from now on is to start buying on dips and aim for the 1D MA50 and in particularly the 0.5 Fibonacci level from whatever bottom the US10Y makes now (modest estimate TP = 4.575%).
## If you like our free content follow our profile to get more daily ideas. ##
## Comments and likes are greatly appreciated. ##

Parabolic Volatility in the Bond MarketYield Rates represent a percentage. How much would an investor get if they invested in a US Treasury Bond.
A stable economy needs three things, at least according to the FED.
- Low Inflation
- Low Unemployment
- Strong Economy
Yield Rates are the ultimate weapon of the FED. By manipulating rates they stabilize the economy accordingly. They stimulate when they should, and they calm as needed.
A strong economy is a stable economy. Volatility in markets is bad juju.
Stability in yield rates is a matter of survival.
But it seems that we have failed in that.
The average rate-of-change in yield rates has gone parabolic over the decades.
And we are talking about 100 years. The bond market is currently in a whipsaw.
The rate / percentage yields oscillate is beyond comprehension.
Who knows what effects this will have in the years to come.
A similar picture prints in FEDs mind right now.
In absolute yield-rate terms, the average-true-range of rates has formed a bull flag.
Once again this confirms the beginning of the 1960s stagflation.
Tread lightly, for this is volatile ground.

US10Y ~ Nov-Dec Snapshot (4H Intraday)TVC:US10Y chart mapping/analysis for last week of November.
TBC further details/write-up via ideas section, cheers.

A top is in place on the 10-year U.S treasury yieldsSince March 2020, the 10-year U.S Treasury yields have been rising, reaching a high of 5.021% last month. According to Elliott Wave Analysis, this advance seems to have ended at that high and a decline is underway, with targets of 3.9% and 3.23%. Keep in mind that lower yields could translate to a lower U.S Dollar as well

US 10Y TREASURY: rate cuts are coming?The FOMC November meeting minutes were the ones that supported market expectations that the Fed is finished with further rate increases. The rates might stay higher for longer, but the market is currently anticipating that the first rate cut in this cycle might occur in May next year. Treasury yields reacted on the release of the Minutes, where yields were modestly relaxed.
The 10Y Treasury yields started the previous week around level of 4.5%, but quite soon a drop in yields occurred down to the level of 4.36%. The support level at 4.4% has been tested during the whole week. Still, at Friday`s trading session the market was closed at the level of 4.47%. In the week ahead, it could be expected that the market will continue to test the level of 4.4% to the downside. A move toward the higher grounds is possible, but it should not be expected that yields will move higher from 4.5%.

A busy week for data - key levels to watch on the US 10Y yieldWe have a busy week this week as we have lots of data on big economies that should provide insights on inflation and activity – namely the US consumer confidence, PCE price index, PMIs, European CPI, German consumer confidence and Chinese PMI.
The US 10Y yield has been correcting lower over the past few weeks but we suspect it has based just ahead of the key support offered by the 4.36/4.34 region (Fibo + previous peak). Not only is it holding here but the RSI is breaking higher also showing evidence of a base implying that the correction lower is likely to be over and that the market should recover off this key support area.
N.B. I like to watch the RSI in conjunction with retracements to give me indications of where the correction is likely to halt.
Disclaimer:
The information posted on Trading View is for informative purposes and is not intended to constitute advice in any form, including but not limited to investment, accounting, tax, legal or regulatory advice. The information therefore has no regard to the specific investment objectives, financial situation or particular needs of any specific recipient. Opinions expressed are our current opinions as of the date appearing on Trading View only. All illustrations, forecasts or hypothetical data are for illustrative purposes only. The Society of Technical Analysts Ltd does not make representation that the information provided is appropriate for use in all jurisdictions or by all Investors or other potential Investors. Parties are therefore responsible for compliance with applicable local laws and regulations. The Society of Technical Analysts will not be held liable for any loss or damage resulting directly or indirectly from the use of any information on this site.

US10Y Support Departure
The current chart analysis on TradingView for the US10Y (U.S. 10-Year Treasury Yield) indicates a pivotal moment in the market, suggesting the completion of the 4th wave on the 21-weekly EMA (Exponential Moving Average). A bullish candle, characterized by a long wick touching the 21-weekly EMA, has formed, signaling a potential trend reversal. The expectation is for the initiation of the final 5th wave, marking the conclusion of the first bullish phase and the beginning of a correction in yields.
Technical Analysis:
1. Chart Patterns:
The formation of a bullish candle with a long wick touching the 21-weekly EMA suggests a strong support level. This pattern often precedes a bullish continuation, indicating a potential upward movement in yields.
2. Wave Analysis:
The completion of the 4th wave on the 21-weekly EMA sets the stage for the commencement of the 5th wave. In Elliott Wave Theory, this could signify the final phase of the bullish cycle.
3. Trend Reversal Indicators:
The confluence of the long wick, touching the 21-weekly EMA, serves as a technical indicator of a potential trend reversal. Traders often interpret such patterns as a shift in market sentiment.
Market Implications:
1. Interest Rate Stability:
The completion of the 5th wave suggests that interest rates may stabilize at the current level. This implies a pause in the downward trend and a reluctance for rates to move lower in a trending fashion.
2. Future Rate Hike Expectations:
The analysis leads to the anticipation that the rising rate campaign will likely continue into the following year. This marks a notable shift in the financial landscape, signaling the end of an era characterized by historically low to zero base rates.
3. Challenges for Banks and Consumers:
The changing interest rate environment poses challenges for both financial institutions and consumers. With the cost of debt becoming more expensive, banks may face difficulties, and consumers will need to adapt to a higher cost of borrowing.
4. Impact on Spending and Bankruptcies:
As borrowing costs rise, consumers may curtail spending, impacting economic activity. Those operating with minimal financial margins could face challenges and may need to secure additional capital to weather the changing financial landscape. This, in turn, could lead to an increase in bankruptcies.
5. Projected Timeframe:
The anticipated completion of this move is projected to occur by the 24th of January. This relatively short period suggests a potentially rapid and decisive move, adding a sense of urgency to market participants.
6. Dollar Strength and Stock Market Impact:
The conclusion of this move is expected to coincide with a rapid ascent in the U.S. dollar. Simultaneously, the stock market may experience an aggressive decline. This dual movement could be a result of shifting capital flows as investors adjust their portfolios in response to changing interest rate expectations.
Conclusion:
As the financial system enters a new era, characterized by a changing interest rate landscape, banks and consumers alike will face challenges in adapting to the evolving economic conditions. The impact on spending patterns and the potential for increased bankruptcies underscore the importance of vigilance and strategic planning in navigating the shifting financial terrain.
Disclaimer: This analysis report is for informational purposes only and does not constitute financial advice. It is recommended to consult with financial professionals and conduct thorough research before making investment decisions.

$US10Y -Important Close *Weekly- US 10 Years Government Bonds(Yield) TVC:US10Y experienced a pull back in the fourth
week of August,
after having rallied previously for five (5) consecutive Weeks,
printing only green *W candlesticks.
The Weekly pullback retraced to a Weekly price level of 4.09% for $U10Y
(key level marked on dashed green line)
We can clearly see TVC:DXY being dragged higher as well during Yields uptrend
(indicating a weak and fearful state of other Major Financial Markets).
Seen on Weekly Timeframe, we can easily spot a triangle pattern being formed
on $US10Y.
Triangle Pattern's Apex can be stretched as far as 238Days from where it
currently is.
In case Pattern is violated to the downside,
a considerable Support-Resistance zone lays just underneath dating back
ever since 1912.
Below that would be the catching up dynamic support of 200EMA on the Weekly,
as well the support-trendline coming from Pandemic Lows.
TVC:US10Y uptrend resumption seems very likely from here,
especially after bouncing at the key level marked on dashed green line.
What is more important to be monitored is the correlation of TVC:DXY going higher
in the same time with TVC:US10Y .
That would be a nightmare scenario for an investor, and a golden opportunity
for those who are on the sidelines and waiting to be heavily invested
in diversification .

Korea 30 year bond price has inverse relation to Dollar Index30 year bond price in South Korea has inverse relational pattern to Dollar Index

Korea 30 year bond price has inverse relation to Dollar Index 30 year bond price in South Korea has inverse relational pattern to Dollar Index

US 10Yr YieldVisual ideas about the 10 Year bond yield rate and it's relationship with confidence in the financial markets.

US10Y Hits Resistance.It is evident that the US10Y downtrend will persist, causing DXY to suffer while commodities and metals will benefit from a green shine.

10 years yield pullback is almost certain over, higher we goThe 10-year yield is currently exhibiting strong bullish signals. After a significant surge, it has undergone a correction from overbought levels. What's particularly intriguing is that this correction has formed a bullish pattern known as a falling wedge. The correction has brought the yield down to two robust support areas.
At present (today), the yield is rebounding from these support levels, and the MACD indicator is showing signs of a potential turnaround, suggesting a strong upward movement today.
If today's closing price matches or exceeds the current levels, it would confirm a breakout from the falling wedge, potentially triggering a substantial upward trend towards the previous high. This could be interpreted as a bearish signal for commodities and stocks, especially given their existing overbought conditions.

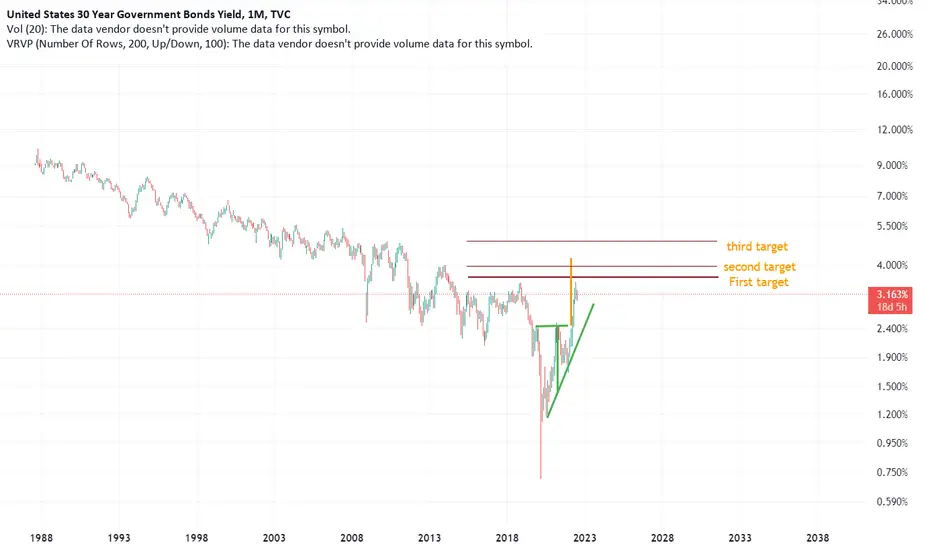
US30Y targets in this analysis , i gave targets for US30Y , based on the macro env , and the W pattern in addition to ichimoku strong resistancec.
not a financial advice
thank you
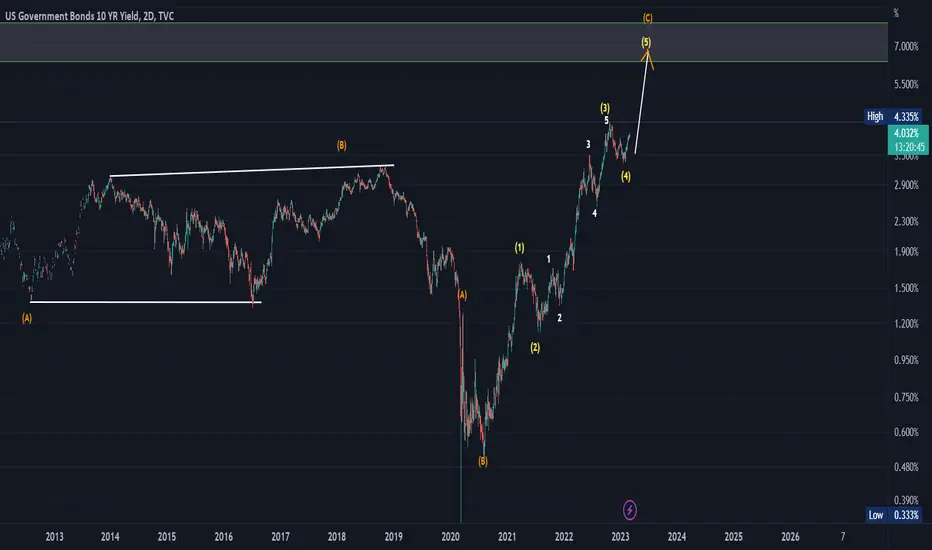
Last upswing before the big dropAccording to Elliott's analysis, there is a final upward wave remaining, and thus there will be three historical corrective upward waves, A, B and C, from which the drain begins to fall again near its historical bottom. Let us see
Major Market Correlations Between Yields, Stocks And USDollarIn 2022, the stock market took a hit and the US Dollar gained strength due to higher yields in the US. Toward the end of that year, as yields eased off, the US Dollar lost some of its power, and this coincided with a rebound in stock market performance.
Now, as yields are climbing once again, the US Dollar is regaining strength, but it seems like stocks are beginning to lose their previous momentum. However, the situation might shift if these rising yields are in the process of completing their fifth wave and are on the verge of slowing down. In that case, the US Dollar could actually become weaker again, and the stock market might continue its upward trend. Of course a lot will depend on the FED policy decisions, where dollar can turn down if FED will stop the hiking cycle. Well, a lot will depend on the US data, so market participants will surely watch the NFP very closely tomorrow.
