US 10Y TREASURY: yields have peakedThe final breakthrough for the US Treasury yields was the latest FOMC meeting where the Fed decided not to increase further interest rates. Although, they are leaving the possibility for further hikes in case that inflation remains persistent, still, the market perceived it as the end of the Fed's rate hikes.
At the beginning of the week, the 10Y US Treasuries tried for one more time to test the 5.0% level, reaching only 4.92%. There was clearly no market strength to push the yields further to the upside. After the Fed's meeting, yields dropped to the level of 4.6%, while after the Friday`s jobs data, yields ended the week at the level of 4.57%. There is still space for yields to relax and move to the downside. Actually the level which is currently pending testing is 4.4%, which might be tested during the week ahead. Further supporting level stands at 4.0%, but currently there is no clear indication on charts that it might be tested in the week ahead. Evidently, the yields started their reversal path, and they will certainly not return back to the previous levels around 5.0%.
Government bonds

US10Y - Is it a "sea change" or a strong buy for TLT and TMF ?In December 2022, Howard Marks told in an interview that a "sea change" is underway in markets.
When I have seen below charts of TVC:US10Y , I have remembered that interview:
(Unfortunately I needed to remove the graph due to lacking reputation points. Maybe you can view with //x/HZKlWa8U )
TVC:US10Y was in a downtrend in a channel since 1980 and this long lasting channel has been broken at April 2022, and upper line of the channel became support at July and August of 2022. So there are some signs that it's not a fake going out of channel like the one in 2020 March.
Does Howard Marks right by saying it's a "sea change" ?
And in this weekly chart of TVC:US10Y , we can see it has formed a new uptrend in a new channel:
(Maybe you can view the chart with /x/DHeM0t8W )
See how good it has used that upmoving support. Now, we are again hitting that support and if that support line is broken, it would be a "strong buy" for NASDAQ:TLT and AMEX:TMF .
Both graphs have given bullish divergence recently:
(Maybe you can view the charts with /x/2jGkJkCJ and /x/5NGqJ3Ze )
This week we will see if TVC:US10Y will break the channel and confirm the bullish divergence of TLT and TMF. If the support would been broken at TVC:US10Y , then 4.20 and 3.40 and 2.75 are the levels to watch for the bullish trend of NASDAQ:TLT and $AMEX:TMF.
In conclusion, if TVC:US10Y will break the channel this week, I'm long in NASDAQ:TLT and $AMEX:TMF.
If not, we will keep watching if Howard Marks was right and it's really a sea change.

US10Y ~ November TA Outlook (Weekly Chart)TVC:US10Y chart mapping/analysis.
US10Y getting dumped off combination FOMC decision, US economic data + US Treasuries update triggering institutional short covering.
Bond & equities market squeezed higher, in-line with seasonality.
Possible bearish H&S in development on lower timeframe, pending pattern confirmation.

10year and 2 year Yield Curve InversionThe 10-year and 2-year yields foreshadow a recession. However, the market top is indicated when the yield curve stops inverting around the green area.

Austrian 2120 Bond: Where Safety Meets Big OpportunityPremise
The relationship between bond prices and interest rates is inverse, meaning that when interest rates rise, bond prices fall, and vice versa. Interest rates are influenced by the interplay of money supply and demand in the market, along with the monetary policy decisions of the European Central Bank (ECB), which sets the key interest rates for the euro area.
The euro area's economic performance in the third quarter of 2023 has been marked by a slowdown, with GDP contracting by 0.1% compared to the previous quarter. This contraction can be attributed to elevated energy prices, inflationary pressures, and ongoing geopolitical tensions in the region. In response to rising inflation, which peaked at 4.3% in September 2023 but subsequently declined to 2.9% in October, the ECB has been raising interest rates since the summer of 2022.
There is ongoing speculation among analysts regarding the future direction of ECB's interest rate policies. Some anticipate that the ECB will reduce interest rates in the first half of 2024, as inflationary pressures ease and the economic outlook remains lackluster. On the other hand, there are arguments suggesting that the ECB may maintain or even increase interest rates further. This is due to persisting concerns over inflation risks and the expectation of an economic recovery gaining traction in the latter half of 2024.
The Idea
Regardless of your position, it's undeniable that long-term government bonds are currently presenting historic opportunities. What I find to be a speculative yet highly secure option is the Austrian government bond, Austria Tf 0.85% Gn2120 Eur (AT0000A2HLC4). With a modified duration of approximately 40 and a face value of around 38, this price offers a potential capital gain that is exceptionally attractive, especially if the ECB starts discussing interest rate cuts.
Given the current situation, establishing a position in this instrument provides a high-risk-to-reward ratio. For Europeans, there's no exchange rate risk since it's quoted in Euros. Moreover, we're talking about Austria, one of the safest countries with minimal risk of default.
The idea is to enter at any price below 40 and patiently await the potential rate cut. Exiting the trade can be done in two ways: by monitoring the monthly oscillators and closing when it enters overbought territory or simply by following macroeconomic developments. Or probably something in the middle? (recommended)
Whichever path you choose, this is a tantalizing opportunity that could yield returns reminiscent of "bitcoin", all while using an extremely secure investment vehicle.

Gilt Limited Edition MatrixIn this simulated project: pivot points, rebounds, or bounces are expected where the price meets the shapes. The icons are potential price predictions or time stamps for potential exceptional events. Blue curved path can become support or resistance. If the price goes down where there are no drawings, a potential entry signal might appear before that at any of the elements in the drawing. Rectangles are potential turnaround points.

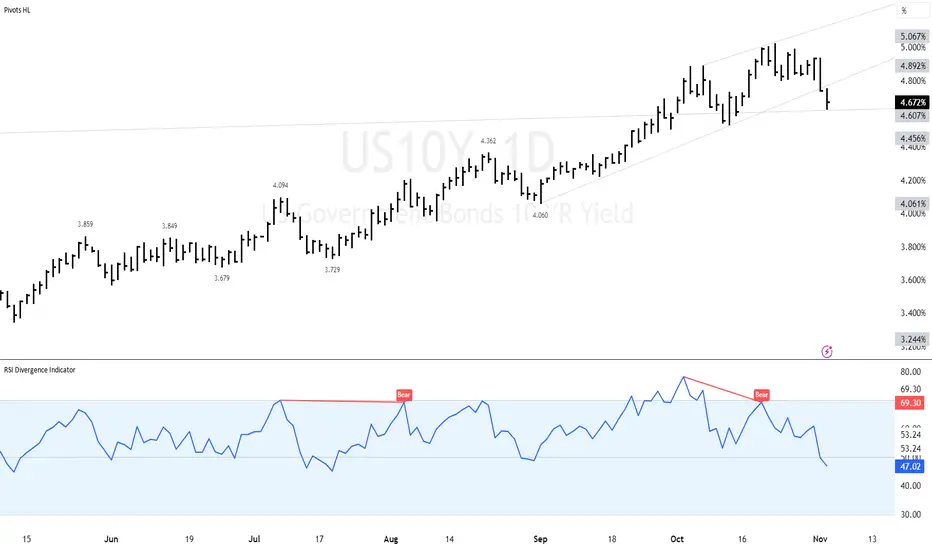
$US10Y Negative Divergence Played Out"The TVC:US10Y Negative Divergence Played Out as we observed a scenario where the momentum indicator, such as the Relative Strength Index (RSI), had been showing bearish divergence with the U.S. 10-year Treasury yield. This indicated a potential weakening of the yield's upward momentum, despite higher prices initially. Subsequently, the divergence 'played out' as the 10-year Treasury yield indeed reversed its upward trend, aligning with the bearish divergence signal. This divergence resolution may have led to a shift in market sentiment or investment strategies, impacting various sectors and asset classes."
10 years US Yield UP to 1.3%10 years US Yield UP to 1.3%,that position 2016.7,or 2020.2.at that time in 2016,FED pause Hike Rate in whole year.at sametime China supply Money to property, property price fly high in China.

2 year yield still has a target at 5.50%Bulls still have a wave count supporting the final spiky move up in 2 year yield to 5.50%

The Bond Market is Pricing in a Collapse of The Yen Carry TradeThe spread between the US10Y and JP10Y has historically been a great leading indicator of contraction within the Yen Carry Trade and likely will be into the future.
If we were to apply TA to it, we can see that the spread appears to be Double Topping and has formed a Bearish Shark at this top as the RSI breaks down and the MACD Diverges. If we are to take this as a warning, then we should expect this spread to go down significantly, and that would be accompanied by the contraction of the Carry Trade, leading to lower liquidity and signfiicantly tighter credit conditions and ultimately a depreciation in market pricing.
I think we could see JPY and USD strength during this time but would avoid other currencies.

10 & 30 have short term topped since call on Oct 23GOOD MORNING!
Didn't have time to post yesterday.
Busy the entire day until I got home @ 9pm!\
10 Yr #yield topped the day the original tweet was posted.
30 Yr yield topped the following day!
#stocks #bonds TVC:TNX (See profile for more info)

10 minus 2 year Yield SpreadTime bomb...
1990-91
recession
2001
recession
2008-09
recession
2020
recession
#recession #gold #spx #purchasingpower

US 10Y yield has topped short-termThe Fed left its policy rate unchanged at 5.25%-5.5% and the US 10Y yield sold off on the back of a less hawkish Fed.
The daily chart reveals a small top completed between 4.80-5.02 and this implies a short-term target of 4.58.
We are viewing this as a correction lower, rather than the end of the longer-term broader upward trend at this stage.
Disclaimer:
The information posted on Trading View is for informative purposes and is not intended to constitute advice in any form, including but not limited to investment, accounting, tax, legal or regulatory advice. The information therefore has no regard to the specific investment objectives, financial situation or particular needs of any specific recipient. Opinions expressed are our current opinions as of the date appearing on Trading View only. All illustrations, forecasts or hypothetical data are for illustrative purposes only. The Society of Technical Analysts Ltd does not make representation that the information provided is appropriate for use in all jurisdictions or by all Investors or other potential Investors. Parties are therefore responsible for compliance with applicable local laws and regulations. The Society of Technical Analysts will not be held liable for any loss or damage resulting directly or indirectly from the use of any information on this site.

Strongest Recession Signal EverThe yield curve has inverted to the most extreme degree ever, which is a warning that a recession is coming. In this video, I analyze the charts for the AMEX:SPY S&P 500, NASDAQ:NVDA Nvidia, NASDAQ:AAPL Apple, and the yield curve on U.S. Treasurys to see what they're telling us about future price action.
In the video, I mention that the bull rally following the Great Recession was primarily due to the Fed's monetary easing. The chart below shows evidence of this. When the value of the assets added to the Fed's balance sheet is compared against the value of the S&P 500, the stock market appears to have essentially moved horizontally. This shows that the primary reason for the stock market's rally is the central bank's extreme expansion of its balance sheet.
If you enjoyed this post, I would greatly appreciate it if you leave a boost! If you have any questions or would like to share your thoughts, feel free to leave them in the comments below.
Important Disclaimer
Nothing in this post should be considered financial advice. Trading and investing always involve risks and one should carefully review all such risks before making a trade or investment decision. Do not buy or sell any security based on anything in this post. Please consult with a financial advisor before making any financial decisions. This post is for educational purposes only.

Possible bull flag? Pretty new to this. Looking for feedback to this idea. If breakout occurs, target is approximately the pole height.

Pick your fib target. How far do Bonds crash?Inverse chart of US 10 year bond yields.
6.249% looks like near certainty.
8%, 10% & 12% are all on the table.

Bank of Japan may further adjust its YCC policyGovernment bond yields are about to reach the 1% upper limit, and the Bank of Japan may further adjust its YCC policy.
Market attention is focused on the actions the Bank of Japan will take regarding the 1% yield cap.
On Tuesday of this week, the Asian economic calendar was filled with various important data releases, with the policy meeting of the Bank of Japan being the focus of traders. On the last trading day of the month, the Bank of Japan is expected to make a minor adjustment to its "Yield Curve Control" policy to effectively tighten monetary policy, which is significant for global markets and policies. This is followed by announcements from the Federal Reserve on Wednesday and the Bank of England on Thursday.
Japanese bond and currency markets:
The BOJ may further adjust its YCC policy to allow the yield on 10-year Japanese government bonds to rise above 1%, and the Japanese yen has been strengthening for the second consecutive trading day, with the 10-year bond yield reaching its highest level in a decade, approaching 0.89%.
Market reactions:
However, based on calculations of the real effective exchange rate (taking into account the impact of negative interest rates and other policies), the yen is the weakest it has been in over 50 years, attracting foreign buyers to purchase assets at relatively cheap prices. The Nikkei 225 stock index fell by 1%. These reactions reflect the market's uncertainty and tension regarding potential changes in the Bank of Japan's monetary policy.
Japanese stock market:
Initially, it saw a significant rise at the beginning of the year, driven by expectations of an improved economic outlook for Japan after years of stagnation. However, concerns about the Bank of Japan tightening monetary policy in the second half of the year have weighed on the market, leading to a decline in the Nikkei index.
As the possibility of the BOJ abandoning its ultra-loose monetary policy has grown, the Nikkei 225 has fallen by 3.6% this month. However, due to many investors betting on the resurgence of the Japanese economy after decades of stagnation, the Nikkei 225 saw an astonishing 27% increase from January to June, reaching a high of nearly 34,000 points.
Market reactions:
This attractiveness of the Japanese stock market to investors is due to factors such as negative interest rates, the large-scale holdings of Japanese government bonds by the Bank of Japan, and the depreciation of the yen.
Japanese inflation:
Inflation in Japan has begun to rise and has exceeded 2%, which is a significant development considering Japan's long-standing struggle with deflation."

US 10-year yield topped out?The US 10-year yield is showing signs of topping out after recently touching a 16-year high just above 5.00%. It’s still too early to confirm that long-term yields have topped out but given the entrenched inflation, risk-off sentiment and growing US government debt, US long-term yields will probably remain elevated until the Fed’s interest rate policy becomes clearer. Yields of 4.80% is the first level of support and a break below this level will allow yields to ease lower towards 4.50%.
There is also a degree of divergence on the RSI that I'm keeping my eye on.

US 10Y TREASURY: waiting FOMCThe US Treasury yields eased a bit during the previous week, as inflation data are showing further relaxation in inflation figures. The 10Y US benchmark tested 5.0% level at the start of the previous week, however, the week ended at level of 4.83%. The FOMC meeting is scheduled for November 1st, but current expectations are that the Fed will not further increase interest rates due to the latest posted inflation figures. However, Fed Chair Powell's statement after the meeting will be closely watched, which might bring some volatility back in Treasury yields.
The 10Y Treasury yields will start the week ahead by testing 4.8% level. At this point on charts, there is no indication that yields have opted to return to the levels of 5.0% and above, in which sense, some further relaxation to the downside is probable. In this case, 4.6% might be a probable target and a short stop on the road toward 4.4% in the weeks to come.

10 Year wants 5%...at a minimumDo you really need to ask if interest rates have topped out?
Head & Shoulders patterns at tops and bottoms are generally spot on...this Inverse H&S pattern occurred at a bottom, clearly broke out from the neckline and just wants 5%...at a minimum.
"Don't fight the Fed"
The Fed is not going to pivot to the downside anytime soon...why would they? What makes anyone think this is on the horizon?
Here are the 3 things Powell stated would need to happen for a pause (not a pivot ) at Jackson Hole:
1. Lower Growth
2. Softening Labor Market
3. Inflation on pace to 2%.
2022 Q2 vs. Q3 GDP came in positive and much stronger than expected, Jobs reports remain hot and inflation isn't anywhere near 2%. So at this point, we can't even check off any boxes for a possible pause in rate hikes let alone a pivot . In addition, Powell hasn't really wavered in his statements since Covid, he's been pretty straightforward, so why would he all of a sudden change his behavior?

Raising Rates Here Will Blow Japan Up. Blowing Up US Yields
Up coming Federal Reserve meeting, there's still underlying inflation in the USA but the amount of interest on debt + Japan buying US debt while their currency is almost completely free falling.
Would be one of the worst fiscal policy disasters since 2009.
Looking at Japan's society they're completely clueless of how close they are to blowing up.

Uk rates TREND DOWNHas inflation peaked in uk? Based on rates markets YES... FOR NOW... uk rates moving down also inflation! Good for uk!

1 & 2 Yr Yield look like they're running out of steamGOOD MORNING!
These will be DAILY charts but what we really need to see is how the week will close for all of these (this was thread on X)
TVC:DXY & TVC:TNX both look like they're running out of steam. The #Dollar does seem to be fighting this break.
30YR Treasury, read above statement.
1YR stopped going up long ago.
Are 2 Yr #Yields finally breaking?
