Rates Poised For Another Leg UpRates pattern forming a reverse head and shoulders formation. Look for the 20 year at 5.25%
Government bonds

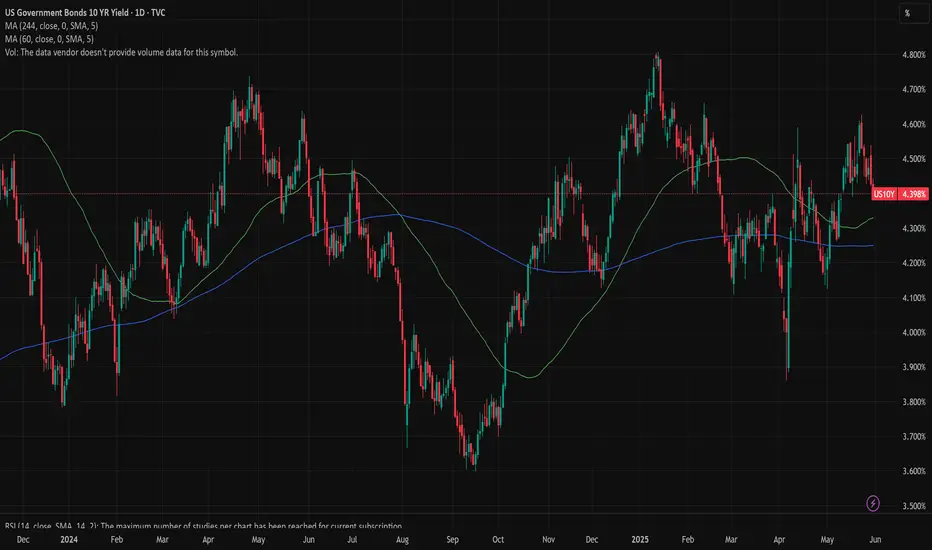
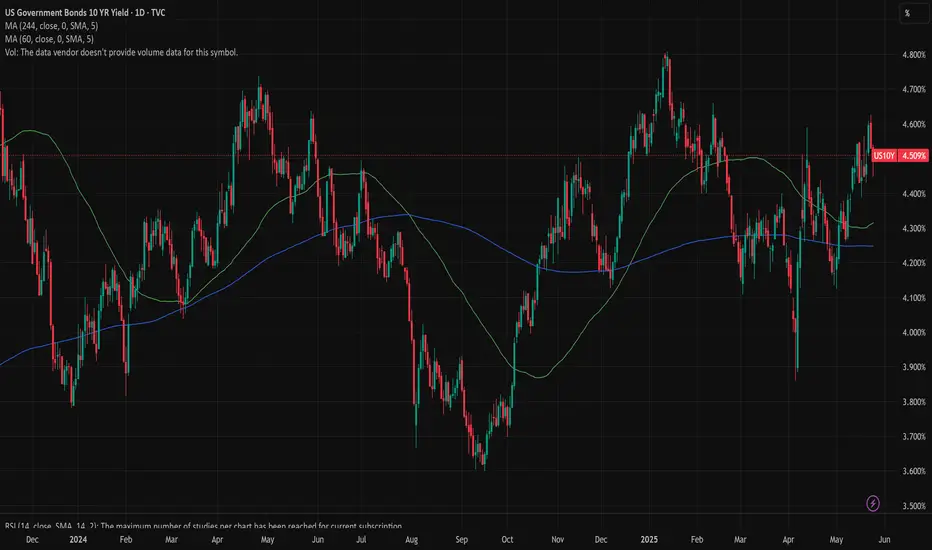
US10Y Big downside potentialThe U.S. Government Bonds 10YR Yield (US10Y) has been since last week on a 1D MA50 (blue trend-line) rebound, consistently rising since the April 04 Low (Support 1). The presence of the Lower Highs trend-line just above it, puts strong selling pressure long-term.
As a result, either now or upon a Lower Highs contact, we expect the US10Y to turn bearish and Target 3.860% (Support 1).
-------------------------------------------------------------------------------
** Please LIKE 👍, FOLLOW ✅, SHARE 🙌 and COMMENT ✍ if you enjoy this idea! Also share your ideas and charts in the comments section below! This is best way to keep it relevant, support us, keep the content here free and allow the idea to reach as many people as possible. **
-------------------------------------------------------------------------------
💸💸💸💸💸💸
👇 👇 👇 👇 👇 👇

Eurobonds: Europe Seizes on Trump’s Fiscal MisstepBy Ion Jauregui – Analyst at ActivTrades
The tax bill proposal put forward by the Trump administration — known as the “Big Beautiful Bill” — includes a controversial clause, number 899, which threatens to tax dividends and coupons from U.S. assets received by foreign investors from countries deemed “hostile” or “discriminatory” toward the United States. While designed as a geopolitical pressure tool, this measure could ultimately undermine the U.S. market itself and present a historic window of opportunity for Europe.
For years, Brussels has aimed to boost the appeal of its markets against U.S. dominance. Regulatory measures like MiFID II, the push for strategic autonomy, and the introduction of common debt instruments such as Eurobonds have steadily gained ground. Now, with the prospect of a direct penalty on foreign investment in the U.S., European assets — offering favorable real yields and a strengthening currency — are emerging as a solid alternative.
The European Central Bank has already warned that this is “a window not to be missed.” Christine Lagarde has hinted that the euro could strengthen to the point of becoming a global reserve currency, particularly if new joint debt issuances are used to fund defense spending. Amid growing geopolitical tensions and declining confidence in “American exceptionalism,” the debate over mutualizing European debt is returning with renewed momentum.
Clause 899 effectively acts as a self-imposed competitive disadvantage for the U.S. In a globalized market, such a tax reduces the real returns of American assets and redirects capital flows elsewhere. If Europe accelerates Eurobond issuance and reinforces its fiscal framework, it could turn this American fiscal crisis into an unprecedented geopolitical opportunity.
Building a Eurobond Market
Since the landmark Next Generation EU plan in 2020, the European Union has made steady progress toward creating a joint debt market. By 2025, over €450 billion in debt has been issued, with new rounds under discussion to fund defense, security, and the green transition. This has helped develop a more complete yield curve, improved market liquidity, and strengthened the euro’s role as a reserve currency.
Relative Yields and Monetary Context
Although European bonds offer lower yields than their U.S. counterparts (e.g., the 10-year German Bund yields around 2.5% versus 4.3% for the U.S. Treasury), the ECB’s monetary tightening cycle has moderated. Inflation in the eurozone has fallen below 3%, and interest rates are beginning to decline. This supports the appreciation of long-term European bonds in anticipation of future rate cuts. Additionally, the risk premiums for countries like Italy and Spain have narrowed, reinforcing confidence in European fiscal cohesion.
Rising Foreign Demand
Foreign holdings of U.S. debt have fallen — from 50% in 2014 to about one-third in 2024 — while European debt is gaining traction. According to ECB and BIS data, every €100 billion in foreign purchases reduces yields by roughly 20 basis points, suggesting that continued demand could exert downward pressure on yields in the medium term.
Strong Euro and Yield Curve Management
With the euro on the rise — projected to reach 1.19 USD by 2028 — euro-denominated assets are becoming more attractive to global investors. Moreover, the ECB retains the ability to intervene in secondary markets, preventing excessive yield curve distortions and maintaining financial stability.
10-Year Eurobond Technical Analysis
Between the final quarter of 2024 and March 2025, 10-year Eurobonds staged a steady recovery before stabilizing in a consolidation range between 2.359% and 2.675%, with a current average of 2.512%. The bond’s technical structure signals a bullish trend, supported by a positive moving average crossover, which could push yields toward the upper end of the range.
The RSI currently stands at a neutral level of 52.38, indicating room for further upward movement without entering overbought territory. Additionally, the 2.568% level has proven to be a dynamic support, having rebounded multiple times, reinforcing its significance as a launchpad for further yield increases.
Conclusion
European bonds are experiencing a structural opportunity driven by U.S. fiscal missteps, growing fiscal integration within the eurozone, and a declining interest rate environment. If Europe continues to push joint bond issuances to fund strategic initiatives such as defense, energy transition, and digitalization, Eurobonds could solidify their status as a viable and competitive alternative to U.S. Treasuries.
*******************************************************************************************
The information provided does not constitute investment research. The material has not been prepared in accordance with the legal requirements designed to promote the independence of investment research and such should be considered a marketing communication.
All information has been prepared by ActivTrades ("AT"). The information does not contain a record of AT's prices, or an offer of or solicitation for a transaction in any financial instrument. No representation or warranty is given as to the accuracy or completeness of this information.
Any material provided does not have regard to the specific investment objective and financial situation of any person who may receive it. Past performance is not reliable indicator of future performance. AT provides an execution-only service. Consequently, any person acting on the information provided does so at their own risk.

US10Y (10-Year Treasury Yield) Weekly TF 2025
📊 Chart Context
Current Yield: \~4.50%
Current Structure: Consolidation below major Fibonacci resistance, with multiple breakout and breakdown paths marked by confluence zones.
📉 Key Technical Observations
Bullish Scenario – Yield Rally (Rate Hike Cycle / Inflation Surprise)
TP1 (5.0%): 0.00% Fib level, psychological resistance.
TP2 (6.10%): 38.2% Fib + -27% extension zone.
TP3 (7.70%–7.91%): Major Fib confluence (-61.8% & 48.60% projection)
Bearish Scenario – Yield Drop (Rate Cuts / Recession)
Support 1 (3.91%): 23.6% Fib retracement, key structural demand.
Support 2 (3.22%): 38.2% retracement
Support 3 (2.74%): 48.6%
Support 4 (2.12%): 61.8%
Support 5 (1.33%): 78.6%
Forecast Scenarios (Based on Arrow Colors & Pathways):
Red Boxes & Zones: Critical Resistance / Reaction Zones
These are strong confluence levels that may trigger pullbacks before continuation.
Green Arrows – Bullish Projection with Pullbacks
Scenario A: Price may rally toward the 5.0% TP1 zone but experience a temporary pullback before continuing toward the 6.10% TP2 zone.
Scenario B: After a short-term correction near 6.10%, if bullish momentum sustains, yield may spike toward the 7.70–7.91% TP3 zone.
These movements reflect a stair-step advance with corrective legs between key levels — bullish macro outlook with intermittent risk events.
Pink Arrows – Bearish Pullbacks & Correction Phases:
Scenario A: Initial rejection from current zone (~4.5%) may send yields down to the 3.91% support confluence.
Scenario B: If support at 3.91% fails, yields may further retrace to 3.22% or 2.74%, activating the lower fib retracement zones.
After stabilizing in these zones, a rebound may begin and realign with the broader bullish structure.
These pink arrows suggest that even in bullish macro cycles, the market may correct deeply before resuming its ascent.
Macro & Fundamental Context:
1.Fed Pivot Dynamics: With inflation cooling and unemployment ticking higher, markets price in possible Fed rate cuts by late 2025.
2.Bond Demand Outlook: Recession fears and de-risking scenarios trigger massive flows into long-term Treasuries, pulling yields lower.
3.Global Liquidity Conditions: Lower yields = increased liquidity = favorable conditions for crypto, gold, and risk assets.
4.Hawkish Risk: Any oil shock or CPI surprise can pause or reverse easing expectations, pushing yields up.
Effects on Gold & Crypto (as scenarios play out):
↗ If US10Y Yields RISE to 6% or 7.7% (TP2/TP3)
* Gold: Likely to suffer due to rising real yields; institutional demand weakens.
* Crypto: Bearish; risk assets sell off amid higher opportunity cost and tighter liquidity.
* Dollar (DXY): May strengthen, applying more pressure on gold & crypto.
* Strategy: Favor defensive positioning. Look for shorting rallies or hedge exposures in BTC, ETH, and high-beta alts.
↘ If US10Y Yields FALL toward 3.2% to 2.1% (Support 2–4):
* Gold: Bullish. Lower yields reduce holding costs and boost safe-haven appeal.
* Crypto: Bullish. Liquidity rotation into high-risk assets often follows easing cycles.
* DXY: Likely to weaken, further supporting BTC and altcoins.
* Strategy: Look to accumulate crypto during dips. Gold may offer breakout opportunities.
Rangebound Near 4.5% (Current Zone):
* Gold: Mixed; capped upside until clear direction emerges.
* Crypto: Ranges or whipsaws. Watch for breakout signals from BTC.D and TOTAL3.
* Strategy: Stay cautious. Monitor DXY and macro events for confirmation.
Related Reference Charts
TOTAL3 – Altcoin Market Cap Weekly
BTC.D – Bitcoin Dominance Weekly

A case for an 8% Higher for LongerThe monthly line chart is starting to look similar to the 2000-2008 timeframe; however instead of a prolonged Bear Flag; it looks like a prolonged Bull Flag in the making. Should that bull flag break to the upside; a doubling of the "pole" could put rates at or near the 8% range. (the dates rhyming could be just coincidental)

US 10 YEAR TECHNICAL OUTLOOK FOR JUNE 9-13(JUNE 9 UPDATE) OvernUS 10 YEAR TECHNICAL OUTLOOK FOR JUNE 9-13 (JUNE 9 UPDATE)
Overnight
U.S. Treasuries declined following a stronger-than-expected May employment report, signaling a robust labor market and sustained economic growth, reducing expectations for near-term Fed rate cuts. Investors sold across the yield curve, with the belly experiencing the most pressure. Meanwhile, the stock market rallied, likely benefiting from portfolio rebalancing from bonds to equities. The U.S. Dollar Index rose 0.4% to 99.18, reflecting the positive data and higher rates.
High Impact News this Week
www.myfxbook.com
Technical
Sometime last week I mentioned this “I expect market to reach 4.47% yesterday’s high and making a bold call of 4.539% - 4.541% for the week. This is just a probability based on the price patterns I’m seeing. Resistance at 4.41% and 4.387% And I also mentioned last Friday the heavy news days like NFP or CPI creates moves that are unexpected and would rather stay away. As expected those levels we mentioned were closed through.
Bias
I am expecting previous week high of 4.51% to be targeted. For today if the candle closes through 4.514% I am looking at 4.541 as the next daily target. Wednesday could be the catalyst day when CPI is due to be released along with inflation rate. Another day to stay off for me.
DISCLAIMMER: This technical analysis is based on historical chart data, which may not predict future market outcomes. Any insights or interpretations I provide are for informational purposes only and should not be considered investment advice. Please conduct your own research and consult a qualified financial professional before making any investment decisions.

US 10Y TREASURY: will the Fed cut?The jobs market data were in the spotlight of investors during the previous week. The major impact came from the non-farm payrolls posted on Friday, which was better than anticipated with 139K new jobs added. The jobs market in the US continues to hold strongly, which impacts investors anticipation of potential Fed's rate cut during the course of this year. Namely, as the Fed has a dual mandate of keeping inflation at targeted level and exercising full employment, the stronger jobs market might impact Fed's decision to hold reference interest rates at current levels for a longer period of time. The CME FedWatch tool is currently anticipating 100% odds that the Fed will hold interest rates steady at their June meeting. The FOMC June meeting is scheduled for 17th-18th.
The jobs data triggered a strong reaction on the US Treasury market. The 10Y US benchmark yields were pushed to the upside on Friday, from 4,32% on Thursday up to 4,50% on Friday. Usually, after such a strong spike in prices or yields on the market, there is time when the market will consolidate, in which sense, there is a probability that yields will ease to some extent during the week ahead. Still, the market nervousness might continue to the lower extent until the FOMC meeting.

A crash in the horizonAs I have been suspecting for a long time. Markets are getting closer to a crash. On the weekly the 2 years bond market confirmed the change in the trend to the downside. Once we dip bellow the blue ema we might be entering in a doomed phase. Cheers

Comparison of 3M to 30Y US Bond YieldsComparison of 3M to 30Y US Bond Yields. Monitoring bond yields to see if any spike in yields will reveal any systemic issue in the markets.

US 10 YEAR TECHNICAL OUTLOOK FOR JUNE 2-6, 2025US 10 YEAR TECHNICAL OUTLOOK FOR JUNE 2-6, 2025
Overnight, U.S. Treasuries remained stable, with shorter-dated maturities slightly outperforming longer ones. Mixed economic data included stronger-than-expected April personal income, weaker-than-expected May Chicago PMI, and concerns over U.S.-China trade tensions. Treasury Secretary Bessent noted stalled talks, while President Trump expressed frustration but optimism for resolution with President Xi. This supported stock market stabilization, with Treasury market stability aided by month-end rebalancing. The U.S. Dollar Index held steady at 99.33.
This week’s US economic calendar
Monday, June 2, 2025
• 9:45 AM: S&P Global Manufacturing PMI (May, Final)
• 10:00 AM: ISM Manufacturing PMI (May)
• 10:00 AM: Construction Spending (April)
• 10:15 AM: Fed’s Logan speaks at Eleventh District Banking Conference
• 12:45 PM: Fed’s Goolsbee speaks
Tuesday, June 3, 2025
• 10:00 AM: Factory Orders (April)
• 10:00 AM: JOLTS Job Openings (April)
• 1:00 PM: Treasury Auction: 3-Year Note
Wednesday, June 4, 2025
• 7:00 AM: MBA Mortgage Applications Index
• 8:15 AM: ADP Employment Change (May)
• 10:00 AM: ISM Services PMI (May)
• 10:00 AM: U.S. Trade Balance (April)
• 10:30 AM: EIA Crude Oil Inventories
• 1:00 PM: Treasury Auction: 10-Year Note
Thursday, June 5, 2025
• 8:30 AM: Initial and Continuing Jobless Claims
• 10:30 AM: EIA Natural Gas Inventories
Friday, June 6, 2025
• 8:30 AM: Nonfarm Payrolls (May)
• 8:30 AM: Unemployment Rate (May)
• 8:30 AM: Average Hourly Earnings (May)
• 3:00 PM: Consumer Credit (April)
Technical
Monthly
The month of May ended closing inside Aprils range but taking note of the April highs sweep of 4.59%. my current support for June would be previous month’s high of 4.627% and old monthly high of 4.66%. Resistance would be 4.125% and old low of 3.86%.
Weekly
Weekly, I’m expecting previous week’s low of 4.387% sweep but also taking note of a possible resistance within the range of 4.39-4.332.
Daily
I’m anticipating a sweep of Fridays low of 4.387% while taking note of prev. day high of 4.442%
also our target last Friday of 4.418 was met.
DISCLAIMMER: This technical analysis is based on historical chart data, which may not predict future market outcomes. Any insights or interpretations I provide are for informational purposes only and should not be considered investment advice. Please conduct your own research and consult a qualified financial professional before making any investment decisions.

US 10Y TREASURY: eased inflation expectationsTrade tariffs continue to gain a lot of investors attention, but they are slowly turning to actual macro data and inflation expectations in the future period. Uncertainty over the future impact of imposed trade tariffs of the US Administration is still present, but it becomes evident that investors are becoming tired of reactions on tweets, and are much more switching attention to actual data. The University of Michigan Consumer Sentiment final data for May, posted during the previous week, showed moderately decreased inflation expectations for the period of next five years. Data showed that US consumers are expecting five years inflation at the level of 4,2%, which was also below market estimate of 4,6%.
The 10Y US Treasury yields eased a bit during the previous week, currently testing the 4,4% level. The starting weekly point was at 4,53%. Considering the relatively significant drop during the week, there is some probability for the short reversal during the week ahead, at least till the level of 4,5%. It should also be considered that the week ahead macro data will put in focus jobs data and NFP, which might imply a bit higher volatility.
Rising Yields doesn't (always) translate Dollar StrengthThe 30-year Treasure yield pushed above 5%, which should be bullish for the dollar. However, the DXY actually went lower. It seems like investors aren't just looking at yields, they're concerned about why yields are rising. It won't be pretty. If the greenback falls below 99.50, the alarm will go off. The Treasury yields tell the truth about debt confidence. We'll be on the lookout for EURUSD & USDJPY price action next week when NFP comes around. I'm not gonna say it, but I'm leaning towards continued sellside delivery on the greenback.

US 10Y Technical Outlook for the Week May 26-30, 2025 US 10Y Technical Outlook for the Week May 26-30, 2025
Market Recap: Week Ending Friday, May 23, 2025
U.S. Treasuries surged early after President Trump’s X post proposing a 50% tariff on the EU, citing stalled trade talks, sparking a flight-to-safety amid growth concerns and tariff uncertainty. The 10-year note yield fell from 4.54% to 4.45%, and the 30-year bond yield dropped from 5.04% to 4.98%. Markets stabilized after a White House official clarified to CNBC that the remark was negotiating leverage, with no actions implemented. Treasury Secretary Bessent, in a Bloomberg TV interview, downplayed rising yields, suggesting they reflect stronger growth expectations tied to the reconciliation bill. Treasuries ended the holiday-shortened week positively, with yields lower across the curve. The U.S. Dollar Index fell 0.8% to 99.13.
Economic Calendar www.myfxbook.com
The following high-impact U.S. news events are expected to influence financial markets during the period of May 26–30, 2025:
Tuesday, May 27, 2025, the Conference Board’s Consumer Confidence Index will be released at 10:00 AM EST. This index measures consumer sentiment, which significantly impacts USD currency pairs and shapes market expectations for consumer spending and economic growth.
Wednesday, May 28, 2025, the Federal Reserve will release the FOMC Meeting Minutes at 2:00 PM EST. These minutes provide critical insights into the Federal Reserve’s monetary policy and interest rate outlook, significantly influencing USD valuation and overall market sentiment.
Thursday, May 29, 2025, two key economic indicators will be published. At 8:30 AM EST, the second estimate of Q1 GDP growth will be released, serving as a vital measure of economic health and influencing investor confidence and expectations for Federal Reserve policy. Simultaneously, the weekly Initial Jobless Claims data will be reported, reflecting labor market conditions and impacting USD strength and the broader economic outlook.
Friday, May 30, 2025, several significant reports will be released. At 8:30 AM EST, the April Personal Consumption Expenditures (PCE) Price Index, the Federal Reserve’s preferred inflation measure, will be published, driving expectations for interest rate decisions and significantly affecting USD and financial markets. At 9:45 AM EST, the Chicago PMI for May will provide insights into regional manufacturing activity, influencing market sentiment. Finally, at 10:00 AM EST, the final University of Michigan Consumer Sentiment Index for May will be released, shaping expectations for consumer spending and impacting USD currency pairs.
Technical
Weekly
Following my technical rule I’m expecting previous week low of 4.43% to be targeted while watching 4.382%-4.412% as a possible bounce zone.
Daily
For daily targets I’m watching 4.448% as a possible target of the day and the previous week low of 4.43%. It is also good to note that we are on a possible zone where yield could bounce back. On the high side look at 4.541% Friday high as a possible support.
Watch out for possible news that could affect the market.
DISCLAIMMER: This technical analysis is based on historical chart data, which may not predict future market outcomes. Any insights or interpretations I provide are for informational purposes only and should not be considered investment advice. Please conduct your own research and consult a qualified financial professional before making any investment decisions.

Japan 30Y Gov.BondBOJ may have to intervene very hard. the duration risk is now global. Volatility may be the ultimate weapon for regime change and a new international monetary agreement.

$US10Y and $DXY Divergence and correlation breakdownRecent weeks we might have missed some underlying churn in the market dynamics. Recently there has been a clear visible divergence in TVC:US10Y and TVC:DXY in midst of all the noise about the tariffs. Usually with rising TVC:US10Y yield the US Dollar index TVC:DXY rises with it as visible in the chart below. In this blog we have been following the downward slopping channel in the TVC:US10Y and the yield has remained within this tight range of the channel. In our last blog on 02 May 25 we called for a lower TVC:US10Y @ 4%. Seems that call was incorrect and I was wrong. But in this space, we have been asking for a lower $DXY. The TVC:DXY chart is making lower highs and lower lows and in a verge of a breakdown.
So we have higher TVC:US10Y which is capped to the upside @ 4.6% visible from the upper end of the downward slopping channel and we have TVC:DXY making lower lows but the correlation is broken in the recent weeks as shown in the daily chart below. This kind of unpredictable market behavior it’s difficult to forecast equity market direction. TVC:US10Y seems to create headwind for equities but the lower TVC:DXY is good for risk assets like CRYPTOCAP:BTC , SP:SPX and $QQQ. Hence this push and pull will keep the markets range bound for now.
Verdict : TVC:US10Y currently at top of the range, downside more likely ; TVC:DXY continues to struggle and in penalty box.

US 10Y TREASURY: heading higherTrade tariffs once again shaped market sentiment during the previous week. The US Administration announced the intent for introduction of 50% tariffs on goods imported from the European Union, which should become effective from 1st July this year. Market immediately reacted to this news, bringing US equities lower, and surging US treasuries. Another news that hit the market and impacted negatively US yields was that the US House of Representatives adopted a tax and spending bill, which is expected to add trillions of US Dollars to the US debt, as analysts are noting. The US has already been downgraded twice by rating agencies, last week by Moody’s, due to high concerns over the sustainability of the US debt.
The 10Y US benchmark reached the highest weekly value at 4,62%, but eased as of the end of the week to the level of 4,50%. This type of swings in the Treasury yields will most probably continue in the coming period. The market is currently extremely sensitive to fundamentals and any news regarding trade tariffs.
CANADIAN GOVERNMENT 10 YEAR BOND YIELD. CA10YThe Canada 10-year government bond yield (CA10Y) plays a significant role in influencing the Canadian dollar (CAD) in the forex market.the following are key take home .
1. Interest Rate Expectations and Monetary Policy Signaling
The 10-year bond yield reflects market expectations of future interest rates and inflation.
When the CA10Y rises (currently around 3.35%–3.38% in May 2025), it signals expectations of tighter monetary policy or higher inflation, which tends to strengthen the CAD as investors anticipate higher returns on Canadian assets.
Conversely, falling yields suggest easing monetary policy or weaker growth, putting downward pressure on the CAD.
2. Impact on Capital Flows
Higher 10-year yields attract foreign investors seeking better returns on Canadian government debt, increasing demand for the CAD to purchase these bonds.
This inflow of capital supports the Canadian dollar’s value relative to other currencies.
3. Relationship with US Treasury Yields and Interest Rate Differentials
The CAD is sensitive to the yield differential between Canadian 10-year bonds and US 10-year Treasuries.
When Canadian yields rise relative to US yields, the CAD tends to appreciate due to the more attractive yield environment.
Currently, the Canadian 10-year yield is around 3.38%, while the US 10-year yield is higher (~4.5%), which partly explains USD strength over CAD but also highlights potential for CAD appreciation if the differential narrows.
4. Economic Growth and Inflation Signals
The CA10Y incorporates expectations about Canada’s economic growth and inflation.
Recent data shows mixed inflation signals: headline CPI falling to 1.7% YoY but core inflation rising to 3.1%, suggesting the Bank of Canada may maintain a restrictive stance, supporting bond yields and the CAD.
Trade tensions and tariffs create uncertainty, but a resilient Canadian economy and narrowing trade deficit also help support yields and the currency.
5. Bond Prices and Yield Movements
Bond prices move inversely to yields. When yields rise, bond prices fall, which can cause volatility in fixed income markets.
Rising yields may reflect concerns about inflation or fiscal sustainability, but also attract investors, supporting the CAD through increased demand for Canadian assets.
Summary
Factor Effect on CAD
Rising CA10Y Signals tighter policy, attracts capital → CAD appreciation
Falling CA10Y Signals easing or weaker growth → CAD depreciation
Yield differential vs. US Narrowing gap supports CAD; widening gap favors USD
Inflation and economic outlook Mixed inflation supports restrictive policy → supports CAD
Trade and fiscal risks Increase uncertainty, may weigh on CAD
Conclusion
The Canada 10-year bond yield is a key barometer of monetary policy expectations, inflation, and economic health, all of which influence the Canadian dollar’s value. Rising yields generally strengthen the CAD by attracting investment and signaling tighter policy, while falling yields suggest the opposite. The yield’s interaction with US Treasury yields and broader economic fundamentals shapes CAD movements in current times .

Is US debt a threat to equity market recovery?Introduction: The equity market is marking time in the short term after a vertical uptrend since the beginning of April. There are many issues of fundamental concern, but one is currently front and center: the sustainability of US sovereign debt. Of course, it's far too early to talk about a US public debt crisis, but the new tax bill championed by the Trump Administration envisages raising the US debt ceiling by $4 trillion, putting short-term upward pressure on US bond yields on 10-, 20- and 30-year maturities. Is this a threat to the rebound in US equities since the beginning of April?
1) US bond yields reach macroeconomic warning zone
The Trump Administration's tax bill calls for tax cuts and, above all, an increase in the US public debt ceiling by US$4 trillion to allow the US federal government to continue its massive indebtedness.
The market is beginning to worry about this situation, as US debt is on the verge of surpassing the 1946 record when expressed as a percentage of US GDP. The annual interest burden on existing debt has reached US$880 billion, equivalent to the US defense budget.
Chart showing the evolution of US public debt as a percentage of US GDP
As a result, financial markets are expressing their concern with rising US bond yields on the long end of the yield curve.
Chart showing Japanese candlesticks in daily data tu 10-year US bond yields
Graph showing monthly Japanese candlesticks for the 30-year US bond yield.
2) The market is hoping for activation of the FED put to ease bond tension
This upward pressure on US bond yields may represent a risk for the equity market, as higher US federal government yields will have a direct impact on US corporate borrowing rates.
S&P 500 companies have solid balance sheets and should be able to cope, but long-term bond yields must not rise above 5/6%, as the financial situation of small and medium-sized US companies would then become problematic. This 5/6% threshold has been identified as the macroeconomic warning threshold for the majority of US companies. In such a scenario, the FED would be obliged to intervene directly on the bond market to relieve the pressure.
3) The S&P 500 is overheating in the short term, but the underlying uptrend is technically intact, and remains supported by the new record high in global liquidity.
At this stage, technical analysis of the financial markets suggests that the upward rally since the beginning of April is not under threat. The market was overheated in the short term and needed to breathe. For the S&P 500 index, the consolidation is short-term in scope, and the recovery remains intact as long as the major technical support zone of 5700/5800 points remains intact. The 200-day moving average, shown in blue on the chart below, passes through this price range.
Chart showing Japanese candlesticks in daily data for the S&P 500 future contract
DISCLAIMER:
This content is intended for individuals who are familiar with financial markets and instruments and is for information purposes only. The presented idea (including market commentary, market data and observations) is not a work product of any research department of Swissquote or its affiliates. This material is intended to highlight market action and does not constitute investment, legal or tax advice. If you are a retail investor or lack experience in trading complex financial products, it is advisable to seek professional advice from licensed advisor before making any financial decisions.
This content is not intended to manipulate the market or encourage any specific financial behavior.
Swissquote makes no representation or warranty as to the quality, completeness, accuracy, comprehensiveness or non-infringement of such content. The views expressed are those of the consultant and are provided for educational purposes only. Any information provided relating to a product or market should not be construed as recommending an investment strategy or transaction. Past performance is not a guarantee of future results.
Swissquote and its employees and representatives shall in no event be held liable for any damages or losses arising directly or indirectly from decisions made on the basis of this content.
The use of any third-party brands or trademarks is for information only and does not imply endorsement by Swissquote, or that the trademark owner has authorised Swissquote to promote its products or services.
Swissquote is the marketing brand for the activities of Swissquote Bank Ltd (Switzerland) regulated by FINMA, Swissquote Capital Markets Limited regulated by CySEC (Cyprus), Swissquote Bank Europe SA (Luxembourg) regulated by the CSSF, Swissquote Ltd (UK) regulated by the FCA, Swissquote Financial Services (Malta) Ltd regulated by the Malta Financial Services Authority, Swissquote MEA Ltd. (UAE) regulated by the Dubai Financial Services Authority, Swissquote Pte Ltd (Singapore) regulated by the Monetary Authority of Singapore, Swissquote Asia Limited (Hong Kong) licensed by the Hong Kong Securities and Futures Commission (SFC) and Swissquote South Africa (Pty) Ltd supervised by the FSCA.
Products and services of Swissquote are only intended for those permitted to receive them under local law.
All investments carry a degree of risk. The risk of loss in trading or holding financial instruments can be substantial. The value of financial instruments, including but not limited to stocks, bonds, cryptocurrencies, and other assets, can fluctuate both upwards and downwards. There is a significant risk of financial loss when buying, selling, holding, staking, or investing in these instruments. SQBE makes no recommendations regarding any specific investment, transaction, or the use of any particular investment strategy.
CFDs are complex instruments and come with a high risk of losing money rapidly due to leverage. The vast majority of retail client accounts suffer capital losses when trading in CFDs. You should consider whether you understand how CFDs work and whether you can afford to take the high risk of losing your money.
Digital Assets are unregulated in most countries and consumer protection rules may not apply. As highly volatile speculative investments, Digital Assets are not suitable for investors without a high-risk tolerance. Make sure you understand each Digital Asset before you trade.
Cryptocurrencies are not considered legal tender in some jurisdictions and are subject to regulatory uncertainties.
The use of Internet-based systems can involve high risks, including, but not limited to, fraud, cyber-attacks, network and communication failures, as well as identity theft and phishing attacks related to crypto-assets.

US10Y Technical Breakdown – Post-Moody’s DowngradeMoody’s has downgraded the US credit rating for the first time since 2011, citing rising debt levels and long-term fiscal challenges.
This move sends a clear warning signal about America’s fiscal path and adds fresh uncertainty to markets already navigating interest rates, inflation, and geopolitical risks.
Focus on the US 10-Year Treasury Yield as the market’s pulse on sovereign risk, inflation expectations, and future borrowing costs. Tracking its medium-term trend will provide crucial clues on market sentiment and risk appetite.
Medium-Term Market Analysis
(6-12 Months)
1. Structural Fiscal Risks
This downgrade highlights growing concerns over the US debt trajectory and political gridlock around spending and debt ceilings.
It’s less about an immediate crisis, more about long-term sustainability.
2. Rising Yields and Market Volatility
The 10-year Treasury yield could move higher, beyond 4.60% we could see rates possibly testing previous resistance of 4.80% (Jan 2025) or 5.00% (Oct 2023).
Higher yields mean increased borrowing costs, which can pressure interest-sensitive sectors like tech and real estate and add volatility to equities.
3. Federal Reserve’s Tough Balancing Act
With bond yields edging up, the Fed faces a dilemma: delaying cuts further could risk inflation climbing higher.
However, this downgrade raises the likelihood that the Fed could keep rates higher for longer than many investors expect.
4. Dollar and Capital Flow Shifts
While a credit downgrade may initially pressure the US dollar, its safe-haven status remains strong.
Global capital could increasingly look to alternatives like emerging markets or gold, leading to shifts in international financial flows.
Perspective
While Moody’s downgrade is a serious signal, it’s important to consider:
1) Political Leverage: Sometimes, rating agencies’ decisions can influence political negotiations. This downgrade may add pressure on US lawmakers to reach fiscal compromises. It’s a tool, not necessarily a verdict.
2) US Dollar & Debt Demand Resilience: Despite concerns, US Treasury securities remain the world’s primary safe asset, with global demand still robust. This could temper yield spikes and limit fallout.
Some could view the downgrade as “priced in” to a degree, given ongoing debt ceiling battles and past political brinkmanship.
If true, markets may react less dramatically than feared.
Watch
US 10-Year Yield: Key indicator to watch for shifts in risk sentiment and inflation expectations.
Equities: Prepare for increased volatility; consider defensive sectors and value plays.
Credit Markets: Monitor for widening spreads as risk aversion grows.
Policy Signals: Fed communications and US political developments will be critical catalysts.
This Moody’s downgrade isn’t just a headline, it’s a medium-term signal to recalibrate risk and position for a more uncertain fiscal backdrop.

The Bond Shark Attack.The bond yield has taken its first dive to the 0.88 level, and according to the ever-so-fishy harmonic shark pattern , we’re bracing ourselves for a dramatic tumble at the 1.138 level.
Now, what does this mean for the stock market? Well, think of it as a domino effect but with a flair for drama.
Investors might start sweating over higher borrowing costs, causing a ripple of caution through equities.

US GOVERMENT 10 YEAR BOND YIELD US10Y Among the US Treasury bond yields—2-year (US02Y), 10-year (US10Y), and 30-year (US30Y)—the 10-year Treasury yield (US10Y) generally reflects the strength of the US Dollar Index (DXY) most closely.
Explanation:
The US10Y yield is widely followed by currency traders and investors as a key indicator of market sentiment, interest rate expectations, and economic outlook. It balances short-term monetary policy effects and long-term growth/inflation expectations, making it a comprehensive gauge for the dollar's strength.
The correlation between the US10Y yield and the DXY is strong and positive: when the 10-year yield rises, the dollar typically strengthens, and when it falls, the dollar tends to weaken. This relationship is more consistent than with the 2-year or 30-year yields.
The 2-year yield (US02Y) is more sensitive to Federal Reserve policy changes and short-term rate expectations. While it influences the dollar, its impact is often more volatile and tied to immediate monetary policy shifts rather than broader economic trends.
The 30-year yield (US30Y) reflects long-term inflation and growth expectations but tends to be less reactive to short- and medium-term market dynamics that drive currency movements. It has a weaker and less direct correlation with the DXY compared to the 10-year yield.
Recent market observations (early 2025) show that the US10Y yield movements often lead or move in tandem with the DXY, while divergences can occur but are exceptions rather than the rule.
Summary Table
Bond Yield Correlation with DXY Notes
US 2-Year (US02Y) Moderate Sensitive to Fed policy, more short-term focused
US 10-Year (US10Y) Strong Reflects medium-term economic outlook, best DXY proxy
US 30-Year (US30Y) Weak to Moderate Long-term outlook, less impact on short-term DXY moves
Conclusion
The 10-year US Treasury yield (US10Y) is the best indicator among the three for reflecting the strength of the US Dollar Index (DXY) due to its balanced sensitivity to both monetary policy and broader economic conditions.
#DOLLAR #US #GOLD

The break-up (a must-watch chart)One of the most important—and unusual—developments in the market right now is the combination of rising US bond yields and a falling US dollar.
Normally, when bond yields go up, the dollar strengthens. It's similar to a high-interest bank account: if you can earn more by holding US assets, global investors tend to pile in, increasing demand for the dollar.
But that’s not what we’re seeing today.
Instead, yields are rising while the dollar weakens—something that’s more often associated with emerging markets facing debt concerns. It signals a deeper issue: despite higher returns on offer, investors are becoming wary of the underlying fundamentals.
In short, **America’s massive debt load and relentless money printing may be starting to catch up—**even with the world’s reserve currency. And the market is beginning to take notice.
This is important to all asset classes moving forward. Keep your eyes peeled on it.

JAPAN GOVERMENT 10 YEAR BOND YIELD JP10YJP10Y, Yen Strength, and Bond Price Correlation
Key Relationships
JP10Y (Yield) and Bond Price:
Inverse Correlation: Bond prices and yields move inversely. When Japan’s 10-year government bond yield (JP10Y) rises, bond prices fall, and vice versa.
JP10Y (Yield) and Yen Strength:
Positive Correlation (Typically): Rising JP10Y often strengthens the yen (JPY) by attracting foreign capital into Japanese bonds. Higher yields make yen-denominated assets more attractive, increasing demand for JPY.
Exception: If yields rise due to fiscal instability or inflation fears (e.g., Japan’s 2025 bond yield surge to 1.59%), the yen may weaken despite higher yields, as investors prioritize safety over yield.
Bond Price and Yen Strength:
Indirect Link: Falling bond prices (rising yields) can strengthen the yen if driven by improved economic confidence or hawkish Bank of Japan (BoJ) policies. Conversely, bond price declines due to fiscal risks may weaken JPY.
Factors Influencing Correlation
Factor Impact on JPY Strength Impact on JP10Y (Yield)
BoJ Rate Hikes Strengthens JPY Raises JP10Y (bond prices fall)
Foreign Demand for JGBs Strengthens JPY Raises JP10Y (bond prices fall)
Carry Trade Activity Weakens JPY (if yields low) Lower JP10Y (bond prices rise)
Economic Growth/Fiscal Health Mixed (depends on context) Rises if growth/inflation up
Global Risk Sentiment Strengthens JPY (safe-haven) Lower JP10Y (bond prices rise)
Recent Examples (2024–2025)
March 2025: Japan’s 10-year bond yields surged to 1.59% (highest since 2008), driven by BoJ rate hikes and reduced bond purchases. This initially strengthened the yen, but concerns about higher borrowing costs and economic stress later tempered gains.
February 2025: Declining JGB yields (due to BoJ’s dovish signals) weakened the yen, highlighting the sensitivity of JPY to yield fluctuations.
Summary Table
Relationship Typical Direction Exceptions/Caveats
JP10Y ↑ → JPY ↑ Positive (capital inflows) Negative if driven by fiscal risks
JP10Y ↑ → Bond Prices ↓ Inverse (fundamental) Always holds
Bond Prices ↓ → JPY ↑ Indirect (if yields signal strength) Weakens if yields reflect stress
Conclusion
The correlation between JP10Y, yen strength, and bond prices hinges on the underlying driver of yield movements:
Yield rises from BoJ tightening or economic optimism → JPY strengthens.
Yield rises from fiscal instability → JPY may weaken despite higher yields.
Bond prices and yields remain inversely linked regardless of context. Traders should monitor BoJ policy, global risk sentiment, and Japan’s fiscal health to interpret these dynamics accurately.
