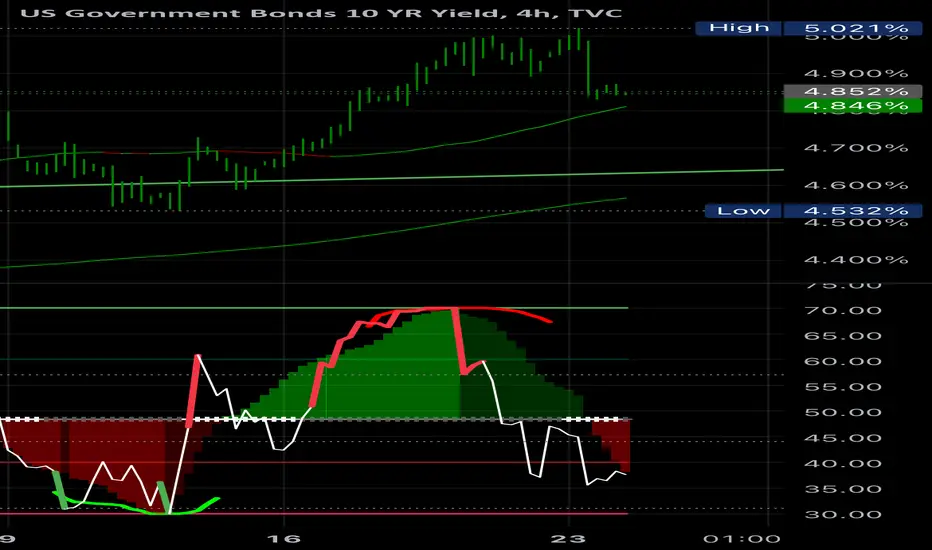
10YR Treasury to Resume Rise Post-FedThe 10yr has taken a break in the past couple days off it's highs. This is normal but and happens regularly in the relentless overall path upwards in rates. The Fed has made all the signals that they are blind to the supply and demand issues of treasuries and willing to allow the market to do what it will as long as it results in less inflation. Chairman Powell in his September 26th speech stated that he still does not believe rates are restrictive enough and with a 4.9% GDP - although questionable at best - he will likely continue his hawkish tone in the November 1st meeting. Once the market realizes there will be another period in which no help is coming - along with a massive issuance of treasuries coming in November and in the line up for 2024 - rates will continue to rise into the end of the year. Target is 5.5% by EOY. I expect it to be choppy, but we won't be stopping here at 5%.
We broke about the blue horizontal line which is a Gann fan dating back to 1982's peak in rates. This is the first time in 40 years we've risen above this line and we've stayed over it. The pace higher will continue until something breaks or the Fed changes tone on their QT policy.
No one wants our treasuries - Japan, China, etc. The Fed isn't buying and Yellen keeps adding billions more to the market weekly. Important dates are November 8th and 9th where the 10 year and 30 year auctions take place. A bad auction could be the onset of the rise if the Fed doesn't provide that on Nov 1.
Government bonds

Bund Short Term MatrixA small simple project with some ideas for potential future scenarios. Icons are simulated potential price predictions. Rectangles can become zones of influence for the price action. Pivot points can occur around the time stamps. (Previous pivot points marked on the past price action).

When in doubt zoom out! 10 year likely falls to 4.73% next week giving stocks a reversal opportunity to trade back above 4,200.
B/C phase currently getting underway. TIMBERRRR


Stock Market looks weak The market looks very exposed as one of the big 7 tech stocks performed poorly this earnings season. Also, interest rates look like they may have peaked however, history shows when the short-term rates fall vs long-term rates (or when rates are cut) there is a correction in the stock market.

#US10Y Yields perhaps a little extended here short term?Got to be brave trying to run infront of this steamroller, but we are starting to see signs of bearish divergence where price(yield) is making higher highs, not confirmed by the RSI and MACD which are currently making lower highs. This could be warning of a short term reprieve in yields which could be bullish risk assets. However, given the current environment with conflict in the middle east, one has to becareful

this chart signals equities have peakednow the price of this chart is rising.
This means the yield of 10Y bond is rising
harder then the 2 year. which means
debt is more expensive. which means less
cheap money. money is still cheap in real terms
but now less cheap than a year ago.
what will the central bankers do?
inflation is hidden but still high and if your smart
you know the govt numbers are understated.
inflation tax is gonna wreck you.

US 10 YEAR YIELDS (UPDATE)🚀Despite hitting our target, the US10Y has kept pushing much higher due to economic uncertainty. Biden has requested for an extra $100 billion in Congress to fund the Russia & Ukraine war, to give money to Taiwan & more money to Israel, to carry on their genocide against Palestine.
If this $100 billion is approved, then we can expect Bond prices to carry on crashing, while the US10Y keeps reaching new highs.

Bond yields crashing down from here. My TA shows that bond yields will crash down here with the dollar (dxy). BTC just launched up and I believe the stock market is next.
$US10Y Negative Divergence RSITVC:US10Y Negative Divergence RSI The TVC:US10Y showcases a negative divergence in the Relative Strength Index (RSI). This indicates that while the 10-year U.S. Treasury yield might be increasing, the momentum behind this rise is weakening. Historically, such divergences in the RSI can signal potential trend reversals or price corrections in the near future. Investors and traders should be cautious and closely monitor subsequent price actions and other technical indicators to validate this potential divergence.

How the Fed affects long Bond YieldsInverse chart of US10Y Yield to show changes in Bond prices.
Overlayed with the following:
Fed Funds Rate
US Treasury Deposits to Federal Reserve Banks
Increase/Decrease Rate of change to Fed Balance Sheet
Balance Sheet Total in separate pane below
The USCBBS Percentage Change shows the money raining down :-D
It's clear to see the relationship between the Fed buying Treasuries, i.e. Quantitative Easing (QE) and the increase in US10Y prices.
Quantitative Tightening (QT) is the name of the game now. There is A LOT of QT left to do, we're at most 25% into QT since the Fed has only rolled off roughly 1Trillion. They likely have 3+ Trillion to go. Expect US10Y to be under continued pressure as long as QT is in effect. Even when Fed Funds rates are lowered it will have little effect on US10Y while the biggest buyer of Treasuries is on hiatus.

US 10Y Yields First time US 10Y Yields have hit the 5% mark since July of 2007.
Interesting to note.
Concurrent to this China has recently turned on the money printers which has lead to more PBOC Liquidity etc.
With that being said it has partially driven crypto prices, albeit low sentiment.
Which is lovely to see :)
Before I get political, this may or may not get controlled soon. I'll let my political views be up for speculation.
They may though deploy the same as Japan some yield curve control.
Crypto is still long for me (ofc).
Although, stocks and other risk assets are becoming more uncorrelated.
So do with that what you may.
There is no current sign of exhaustion, for the 10Y in the short term.
Soon enough though there will be.

US 10Y TREASURY: has finally topped?It was a sort of game of nerves during the previous week, watching the US 10Y yields reach the level of 5%. This occurred for the first time after 2007, but the difference on charts was that no one was sure whether yields would stop at this level. It was such a strong push to the upside, after Fed Chair Powell's speech at the Economic Club of New York on Thursday. Although he said nothing new with respect to potential further rising of interest rates or inflation, still, the markets did not want to hear that jobs and economic growth need to suffer in order to bring the inflation down to 2%. Adding to it the developments within the Middle East crisis, the perfect storm occurred with US Treasuries.
Friday`s trading session brought some ease in 10Y Treasury yields, so they finished the week at the level of 4.91%. In case that they continue to ease in the week ahead, then the level of 4.80 might be the next stop for yields. However, in the case of any potential negative news which might bring yields to the higher grounds from 5%, it would certainly not be at all a good sign for the future prospectus for the US economy.

IS THIS STILL RELEVANT?This thread will be dedicated to my thoughts more about inflation and sharing my "monetary" non-political point of view.
uptrend till 5,25%I only see uptrend till 5,25% guys like rockie-feller, roths-child and the rest of scumbags elites just print money and buy bonds to hold its price...you must short the T-note future contracts ZN1 and fVck all them up!

US YIELD 10Y SELL FROM RESISTANCE ZONE HELLO TRADERS ,
As i can the chart is going to reach at a strong resistance zone and 10Y already our bought
so i am looking to let it complete this move and then we will get in trade with a very low risk and higher rewards ....
kindly share Ur trade ideas and stay tunes for new updates on these charts

US10Y Bearish Divergence tells us it may be time for correctionLast time we looked at the U.S. Government Bonds 10YR Yield (US10Y), it gave us a technical bounce and profitable buy signal (see chart below) as the Higher Lows trend-line held:
This time we get an opposite signal as the 1D RSI formed Lower Highs, while the price is on Higher Highs, which is a technical Bearish Divergence. The asset is still supported both by the 1D MA50 (blue trend-line) and the Higher Lows 3 trend-line since the May 04 Low.
Our strategy is to sell and target a price slightly above each Higher Lows trend-line, then re-sell if a 1D candle closes below that Higher Lows trend-line. Target 1 is 4.745, if a 1D candle closes below Higher Lows 1, we will re-sell and target 4.645 (expected contact with the 1D MA50). If Higher Lows 2 break, then re-sell and target 4.465 on Higher Lows 3 and a projected contact with the 1D MA100 (green trend-line).
-------------------------------------------------------------------------------
** Please LIKE 👍, FOLLOW ✅, SHARE 🙌 and COMMENT ✍ if you enjoy this idea! Also share your ideas and charts in the comments section below! This is best way to keep it relevant, support us, keep the content here free and allow the idea to reach as many people as possible. **
-------------------------------------------------------------------------------
💸💸💸💸💸💸
👇 👇 👇 👇 👇 👇

US BondsAfter true analysis on 30 Oct 22 that published on my Twitter account now see the Update.
I think the correction will continue to the first support zone of about 4.5%.

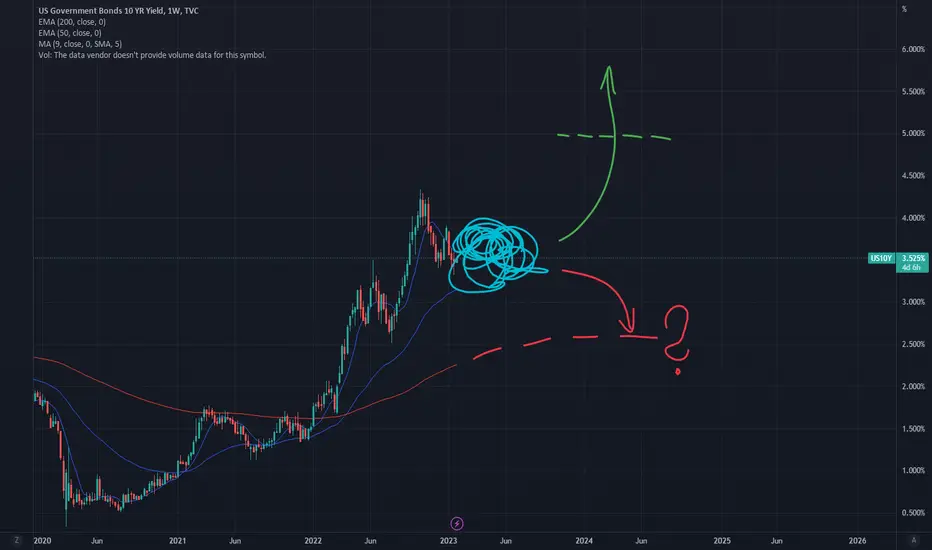
US10Y: IS THIS THE TOP FOR YIELDS?Using the fib retracement from our last previous cycle high, we can see yields have rallied to our 1.618 level, potentially signifying a top in yields may have been reached
We also have a triple bearish divergence on the monthly RSI almost creating this rounded top / head & shoulders pattern, signifying bonds could rally significantly with stocks if this is truly confirmed to be the top
shoutout to @JTheretohelp1 for mentioning this on X :)

10Y & 30Y Yield losing more steamGOOD MORNING!
#interestrates look like they want to slow down a bit, short term top.
We see the 10Y & 30Y pulling back a bit...
But this is better seen intraday.
We'll see how that unfolds...
IF IT DOES, it could cause a sharp rise in #Stocks.
Coincidentally, DJ:DJI @ support & TVC:NDQ is near a major support.
TVC:TNX AMEX:DIA NASDAQ:QQQ

The bear steepener and when we will get our scripted eventWatch this curve because the market always knows, and the market isn't as free as many think. Gives us a sign when the true risk off kicks in. Might be due for a short relief soon, and then it starts. A potential bounce area is market as white, might not match and steepen now, but the breadth indicates that more likely than not we will get it in a matter of weeks now since we've technically broke out from the pattern.

US 10 Year Treasury Bonds - TOP Call Coming! (For now) $TNXWhat Major Event will occur to force thirst for US and G20 Treasury Bonds? It's happening soon. I wish I had a crystal ball to say what will cause it, but it'll happen. We're almost there IMO 5.19-5.25% topline target - then I hope in whatever this Market or world event will force yields to go back down to 3.19-3.25% Before eventually continuing back up in the next major World event to create Inflation AKA Wave 2 Inflation

SG10Y Govt Bond and SPY relationship Part VIII - Here the bear!Back to this set of chart overlay...
So, it is where it isand the SG10Y Govt Bond yields are again rocketing. This is yet again to push the SPY further down. Combine this with the double top seen recently; probabilities stack up for more downside into November.
