US 30 Year Yields Have TOPPED! The 30 Year Treasuries have hit Major Resistances.
Yields will drop below 3.5% by this time next year.
A MAJOR BOND RALLY is starting as the FED will Monetize the Long End of the Curve.
Government bonds

18% yields???I'm hearing some have 18% targets for 10 year #yields!
That would be an EPIC generational event, greater than 1981, where rates fell short of 16%.
First, we got a 100 year resistance line at 5.4%.
1970s bull era for #gold #silver started above that line!
#fintwit #inflation

30Y Rate HistoryA little lesson in interest rates for you kids out there following me. The notion that rates are too high for the market to go up is nonsense, we're basically at the same interest rate as when the Dot Com Bubble and Housing Bubble occurred. The low interest rates you've seen for the last 15 years is because of the housing bust and subsequent QE.
You can see in the late 80's the market went up with interest rate at 9%. You shouldn't short the market just because of interest rates. Daily indicators hit oversold on every index and bounce up today. Bullish.

$TNX $TLT 10YR About to test 40 year gann fan line since 1981This 2/1 Gann Fan line has been in existence since 1981 and is about to be tested. For those that don't use gann fans - the 2/1 line is typically associated with a large pop. The 10 yr is already on a tear and this could result in a very fast pop to 5% in the coming weeks.

$US10Y Reaches 16 Year High, Short-Term Forecast & DiscussionThe TVC:US10Y has been extremely bullish since May 2023, and has gained more strength after the Fed's hawkish announcement that led to a "higher for longer" interest rate environment. The TVC:US10Y has broke through numerous resistance levels to reach its 16-year high. From a technical analysis perspective, the TVC:US10Y has a tendency to have strong bullish rallies with breaks above the Bollinger Band (marked by yellow lines). We are observing that scenario in the current bonds market. There is a likelihood that the rally continues for a few more weeks (approximately 1-4 weeks). However, I think the TVC:US10Y and bonds market are due for a correction back down to the EMA ribbon. A strong bond market hurts equities because investors perceive TVC:US10Y as a less riskier investment alternative. This is hurting SP:SPX in the short term, but a peaking TVC:US10Y could also signal the bottom of the SP:SPX correction at current levels. For now investors are waiting for Friday's jobs data after the Tuesday JOLTS job openings data came in worse than expected.

🔥 Bonds Are Predicting A MASSIVE Crash 🚨The Bond Yield Curve, which can be calculated by substracting the US 2 Year bond yield from the US 10 Year bond yield, has been inversed for quite some time.
An inversion of the bond yield basically means that bond traders require higher returns on short-term bonds than on long-term bonds, which translates to short-term bonds being more risky than long-term ones. This only occurs when bond traders anticipate an upcoming crisis.
The inversion on itself is not necessarily bearish, but the "un-inversion" is very bearish. As seen on the white chart, once the line crosses the zero line from below, it has always predicted an upcoming crash.
With the Bond Yield Curve recently seeing a strong "bullish" move, it's likely that we're going to hit 0% in the near future. Consequently, this signals that a market crash is on the horizon.
Whether history will repeat remains to be seen. However, we had one of the strongest yield inversions in history, which doesn't bode well.
Do you think that a crash is coming? Share your thoughts and charts.

Forget Soft, Hard Or No Landing, Higher For Longer...Is the Stock Market Dead Money For The Next 10-20 Years?
So much of how our markets work is based on optimism. Can you imagine being a money manager and your entire sales pitch is some negative diatribe about how the market is going down and will continue to go down?
Would you fork over your hard-earned savings based on such a story? Not a successful plan of attack for a person trying to raise capital if you ask me.
However, therein lies the disconnect between what is really going on in today’s market, versus what the average person reads and hears in the financial news. The same optimistic money managers sponsor those articles or those TV shows. Would your business buy an ad on a show or in a magazine that constantly gave a negative outlook on your business?
I’ve always considered myself an optimist. However, nowadays, I find nothing to be optimistic about with respect to the US stock markets. The reason is, my prevailing analytical thesis is, the markets are now entering a long-term cycle in which many aspects of our economy will be reverting to their respective long-term mean. From interest rates, to income inequality. This time frame, I refer to, is meant to be a reset in expectations. If I am correct in my analysis, this will unfold over a long period of time. During this period, many of old correlations and metrics used to determine the value of the stock market, assets in general, (housing, for example) will break down and end up becoming less useful to those who fundamentally analyze assets, stocks and the markets for a living. The cycle I am referring to is one in which none of the current market participants have experienced. Now before you draw a hasty conclusion, and think this article is about me warning you, the reader, a 1987 stock market crash scenario is on the horizon, I’ll caution you. It is not.
However, my analysis shows that the market will essentially become dead money for at least the next decade or two. That means buying most market-based asset classes, and holding them, will not produce the desired results of the past.
Please indulge me while I provide some background and explain.
I practice a form of market analysis that is exclusively focused on price action. I guess you could sum up my work by styling me as a pattern analyst. That means stock market news, events, corporate earnings and all external data is of little concern to me as I carry out my day-to-day analysis on the SP500. I never take those external events into account while analyzing any of the markets I cover. I watch the patterns market participants create with their buys and sells. I study those patterns across the many markets I cover and over both the short and extremely long periods of time. One could say I took my mother’s advice to heart, and watch what they do, not what they say. It’s the law large crowds, and the larger the crowd, the more accurate the forecast. The SP500 contains one of the largest crowds assembled. Each day it involves millions of participants, exchanging large volumes of assets for vast sums of money. Suffice to say, my work can produce some scary accurate forecasts based on the participation of the crowds in those markets.
A final anecdote to explain my work lies in a simple experiment I observed some time ago on YouTube. To illustrate the power of large crowds, a YouTuber decides to conduct an experiment. The individual fills a large mason jar with marbles. The half gallon sized mason jar is now brimming with marbles, and the metal lid is twisted on, sealing the jar. The individual then attends a local carnival and sets up a booth to solicit guesses as to the total amount of marbles contained in the mason jar. Volunteers are asked to simply observe the jar, and write down their guesses on a post-it-note. After collecting a large number of post-it-notes, the guesses are entered into a spreadsheet. Next, the marbles are emptied on a carpet and counted. 1340 marbles. Comparing the spreadsheet data, the conclusion was, although some volunteers came close in guessing the correct number of marbles, no one guessed correctly. Guesses ranged from as low as 300 to as high as 3,000. A seemingly random data set. However, under further examination, the average of the total guesses were 1335 marbles. This simple experiment explains the legitimacy of some sort of “inexplicable collective consciences” when involving a large crowd.
My current bearish perspective manifests itself in this same notion of the large crowd of market participants but over an extremely long-time frame of the SP500 (INDEXSP: .INX).
Below is a chart of the price action of the index from inception.
To put a simple explanation on the chart above. Since the stock market crash of 1929, the price pattern of the SP500 has essentially advanced in a 45-degree angle higher. I will spare you my explanation of the labeling of the chart as to not bore you as those details do little to further my explanation of the analysis. However, I will state that all our society has achieved since in the last 150 years is notated on the above chart. The advancement of technology, medicine, communication, war and peace is all included. For me, this becomes a visual picture of some of the best and worst times humanity has experienced during this time. What is compelling, is some of those pivotal moments barely stands out on the chart.
Fast forward to today.
After almost a 100-year price advance from the 1929 crash, we are now entering a prolonged period of digesting all those gains. I cannot over emphasize that this area of consolidation I forecast is 100% natural and should be no cause for alarm from a pattern analysis standpoint. As stated, that is a simplified explanation of what a super cycle event wave (IV) accomplishes. Additionally, our last Supercycle event, labeled (II), is an area of digesting gains that was hastened once the events of the Spanish Flu of 1918 were behind us and that pent-up demand was unleased. In the US, those times are referred to as the roaring twenties. Cyclically there are many character similarities in our wave (II) and our current wave (IV). Chief among them was a global pandemic and the aftermath. However, in my form analysis, a wave (II) and a wave (IV) are supposed to alternate in terms of time duration and retracement depth. If one takes place over a short period of time, the other should be long. I can see this sort of alternation I refer to take place every day, as it pertains to the very short timeframes. These patterns, whether long or short term, tend to be fractal in nature. Meaning, if you removed the dates and timeframes from a 1-hour chart of the SP500 and a 150-year chart (like the one displayed above) they would look strikingly similar. To a pattern analyst, like myself, I would be unable to discern what timeframe I was looking at. Nonetheless, the patterns would be instantly recognizable. Because these fractals form and complete on the smaller timeframes, through observation we can forecast the same effects on the much longer time duration charts. These fractal patterns tend to be self-similar and repeating.
In conclusion, if what I see unfold each and every day is indeed similar and repeating when observing a price pattern that is 150 years in the making, the conclusion will be a decade or two of dead money due to a long-term cyclical digestion of gains. Call it a “massive reversion to the mean event”. From things like interest rates to income inequality, a total reset to longer term norms.
Additionally, if my analysis is correct, the January 2022 stock market highs will not be breached for a very long time to come. This will be a time where investors will be forced to become more creative and pickier, as it pertains to seeking a return on capital.

BTC Vs US02US30 SPREAD - Interesting
• 2s30s spread : The US2US30 spread refers to the yield spread between the 2-year and 30-year U.S. Treasury bonds. The chart visualizes the difference, or spread, in yield for these two bonds over time.
The 2-year bond represents more of the short-term outlook, whereas the 30-year bond is more indicative of long-term expectations. So, when people refer to the US2US30 yield spread, they're essentially talking about the difference between short-term and long-term interest rates.
During typical economic conditions, investors demand higher interest for lending money over a longer period, thus the yield of 30-year bond is higher than the 2-year. However, during economic uncertainty, the spread can narrow or even become negative (also known as a yield curve inversion), which can be viewed as a potential indicator of a forthcoming economic recession.
Yield Curve:
1. A yield curve is a graphical representation of the yields available for bonds of equal credit quality and different maturity dates. It is used to measure bond investors' feelings about risk and can significantly impact investment returns.
2. Different types of yield curves can exist reflecting the short, intermediate, and long-term rates of various bond types, such as Treasury bonds, Municipal bonds, or corporate bonds of specific issuers.
3. The shape of the yield curve varies: a normal yield curve slopes upward indicating higher yields for long-term investments; a steep curve usually signals the beginning of economic expansion; an inverted curve suggests potential economic slowdown as long-term investors settle for lower yields; and a flat or humped curve indicates little difference in short and long-term yields.
4. The yield curve can help gauge the direction of the economy, serving as a predictor for potential turning points in the economy.
5. Yield curves allow bond investors to compare Treasury yields with riskier assets such as Agency bonds or corporate bonds. The yield difference between these is referred to as the "spread", which widens during recessions and contracts during recoveries.

Yield curve inversionAnother historical macro chart you should pin.
Key observations:
1) 1970s had severe episodes of very steep yield curve inversion.
2) Reversions do not always imply a recession, or even an imminent one.
#gold #silver #inflation #yields #recession #spx

US10Y Possibly Bullish Break Out 5-7.5% Target Bullish flag with easy 5% Target if monthy breaks above the resistance line forming a pole of bullish flag...
The information and publications are not meant to be, and do not constitute, financial, investment, trading, or other types of advice or recommendations.

Observing Bearish Divergence in the 20-Year Bond MarketIn the world of finance and investing, keeping a watchful eye on market trends and indicators is essential for making informed decisions. Lately, I've been closely monitoring the 20-year bond market, and I've noticed some intriguing signals that could have far-reaching implications for the financial landscape.
What caught my attention is the presence of a significant bearish divergence pattern on the daily chart. This divergence suggests a potential shift in market dynamics, which could have ripple effects throughout the financial sector.
Bearish divergence occurs when an asset's price makes higher highs, while a key technical indicator, such as the Relative Strength Index (RSI), makes lower highs. In the case of the 20-year bond market, this divergence is becoming increasingly evident. This pattern typically suggests a weakening bullish trend and a potential reversal in the making.
One of the intriguing aspects of this bearish divergence is its potential to put pressure on overleveraged banks. When the bond market shows signs of weakness, banks holding substantial positions in bonds can face increased risks. Overleveraging has been a concern in the financial industry, and a downturn in the bond market could be a catalyst for addressing this issue.
However, here's where things get even more interesting. While the bearish divergence might suggest a market correction or even a bear market, I have a hunch that central banks might have a different playbook in mind. Instead of allowing a sharp market downturn, they could intervene with massive Quantitative Easing (QE) programs.
Quantitative Easing is a monetary policy tool used by central banks to stimulate the economy by purchasing financial assets, typically government bonds. By injecting liquidity into the market, central banks aim to lower interest rates, encourage borrowing and spending, and provide support to the financial system during challenging times.
In this scenario, central banks might use the bearish divergence as an opportunity to step in with substantial QE measures. By doing so, they could provide a safety net for the bond market, stabilize financial institutions, and prevent a market crash.
However, there's another twist to consider. Before initiating massive QE, central banks might strategically "flush out" leverage from the market. This could involve allowing a controlled market decline to clear out excessive leverage and speculative positions. Once the market has undergone this cleansing process, central banks could then step in with their QE measures to support a healthier financial environment.
In conclusion, the bearish divergence in the 20-year bond market is a noteworthy development that has the potential to impact various aspects of the financial sector. While it may indicate a weakening trend, it's essential to keep in mind that central banks often have tools at their disposal to mitigate the effects of market turbulence. Their actions in response to this divergence could be crucial in determining the market's direction in the coming months.
As an investor, it's essential to stay informed, closely monitor market trends, and be prepared for various potential outcomes. The financial world is dynamic and ever-changing, and being adaptable to different scenarios is key to successful investment strategies.

$US10Y Ouch, 7 rates coming.
TVC:US10Y Ouch, 7 rates coming.
12-month chart and next level is 7% give or take, not good.

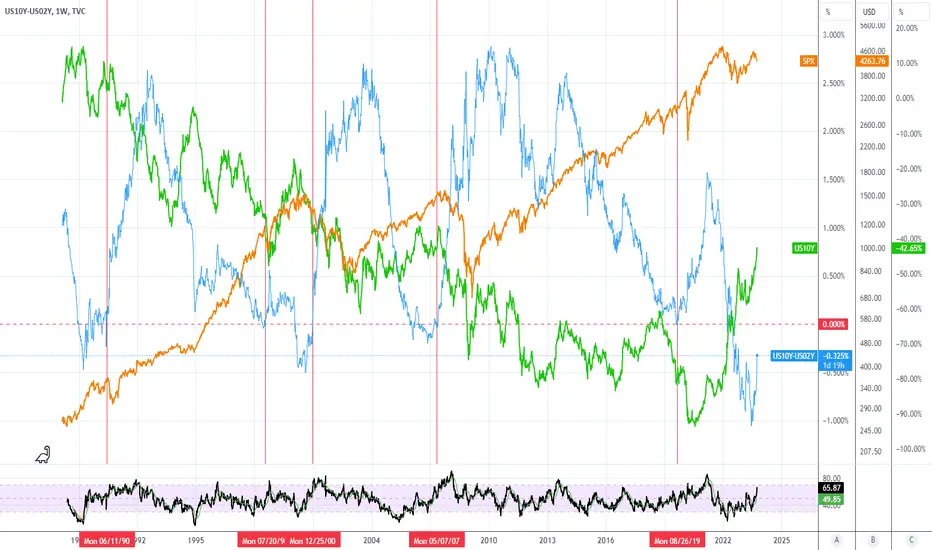
Yield to SPX ComparisonLong-term view of rates compared to SPX. Orange line is SPX, green line is 10 year yield, blue line is 10 year yield minus 2 year yield. Red vertical line indicates when the spread (10yr - 2yr) crossed back above 0 after dropping below. Historically, the curve has uninverted when yields dropped. I'm curious to see what happens if the curve uninverts with rates still rising.
US10Y: Soaring Bond Yields as Federal Reserve Maintains Hawkish The Fed Hawkish Stance
During Wednesday's address, Federal Reserve Chair Jerome Powell reinforced his stance on tackling inflation with a more cautious approach. He emphasized that the central bank is not yet finished with its efforts to curb inflation and hinted at the possibility of implementing multiple interest rate increases during future monetary policy meetings.
Powell's statement comes as a response to the ongoing challenge of bringing down inflation, which has consistently remained above the central bank's target of 2%. Notably, some Fed officials have emphasized in recent speeches that inflationary pressures persist. They specifically highlight core inflation, which excludes the volatile prices of food and gas, as not decelerating as rapidly as overall inflation.
The aforementioned statement supports the potential scenario of higher Government Bond Yields in the future, as an increase in interest rates typically correlates with elevated yields.
Technical Analsyis
The U.S. government's 10-Year Bond Yield has undergone a retracement, precisely at the 0.5 Fibonacci ratio, establishing a support area. Notably, the yield currently exhibits a bullish trend as it remains above the EMA 200 line, indicating positive market sentiment. Furthermore, the Falling wedge pattern suggests a continuation of the prevailing trend. Complementing this observation, the stochastic line crosses within the neutral area, further bolstering the case for a possible upward movement toward the target area.
It is important to keep in mind that once the target/support area is reached, the roadmap provided may no longer be valid.
If you find this analysis helpful, I encourage you to show your support by clicking the rocket button and sharing your opinions in the comments section below.
"Disclaimer: This analysis is intended solely for educational purposes and should not be considered as a recommendation to take a long or short position on the TVC:US10Y ."

Have yields peaked?Even though stocks are higher because of this, don’t get too excited that US 30yr yields look like they have found resistance near term. From the looks of it, we have, at least until Friday when the Non Farm Payroll data is due for release. In the near term, the 5% level capped the rally with the 161% extension just above at 5.05%. The daily RSI was overbought and may need to correct before resuming higher. On Friday, if recent history repeats itself, the US jobs data may come in relatively strong (still) and keep rates elevated and planted firmly in the bullish trend we are seeing. Dips back towards the 4.69% level may be seen as buying opportunities.

yield inversion triggerSPX may see a push if we get a pull back in the yield inversion...but longer term, notice that anytime the yield inversion unwinds...what follows is a dump in SPX...
