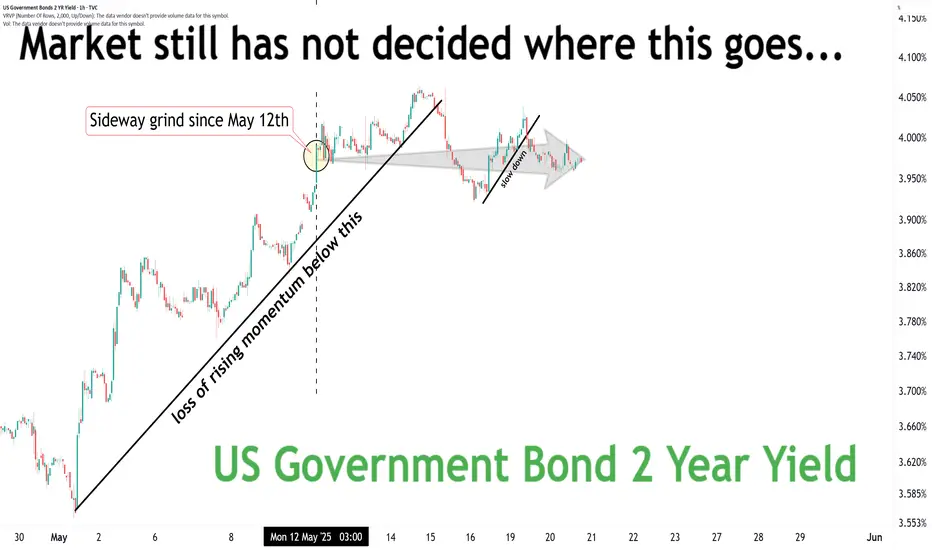
Short Term YieldsA very short term outlook on the short end of the yield curve...
This is a KEY chart to understand where the risks reside (recession or not).
Where do you think this goes next?
Government bonds
apan’s Bond Market Is Flashing Alarms – Carry Trade at Risk?🚨 Japan just witnessed its weakest 20-Year Government Bond auction since 1987, triggering a spike in long-dated yields:
📉 Bid-to-cover ratio at lowest since 2012
📉 Tail (spread between avg. & lowest accepted bid) was massive
📈 40Y JGB yield hit all-time highs
📈 30Y at highest since it was introduced in 1999
📈 20Y at highest level since 2000
This is a BIBLICAL move in the JGB complex.
📌 The implications?
Japan’s carry trade—a pillar of global liquidity—could be under pressure
Global bond markets may reprioritize risk
BoJ is walking a tightrope: intervene now or risk a credit crunch later?

RecessionsWatch what the aggregate of market participants are doing.
Above black= recession risk is lower
Below red = recession risk is higher
So no... the economy is not out of the woods yet.

US 10Y OUTLOOK FOR THE WEEK MAY 19-23 (UPDATED DAILY)US 10y Treasury Outlook for the Week May 19-23,2025
May 19, 2025
Friday Fundamental Recap
U.S. Treasuries rose, with the 30-yr yield nearing its mid-January peak (5.005%). Gains followed Japan’s Q1 GDP contraction (-0.2%; expected -0.1%) and a strong eurozone trade surplus (EUR36.8 bln; expected EUR17.5 bln). Weak U.S. data—April Housing Starts and May Consumer Sentiment—limited gains and Moody’s U.S. credit downgrade from Aaa to Aa1 on May 16, citing $36 trillion debt, pushed yields higher.
2025 Downgrade (Moody’s, May 16, 2025):
• Immediate Reaction: Treasury yields rose after the downgrade, with 2-year Treasury yields accelerating their climb. This reflects investor demands for higher risk premiums due to perceived fiscal risks.
• Bond Prices: Higher yields correspond to lower bond prices, as investors sell off Treasuries to account for increased risk. The downgrade could lead to further price declines, especially for longer-dated bonds, if yields continue to rise.
• Market Implications: Higher borrowing costs for the U.S. government may exacerbate debt concerns, potentially leading to more volatility. Posts on X indicate expectations of “knee-jerk volatility” and a “risk-off tilt,” suggesting short-term selling pressure on Treasuries.
• Longer-Term Outlook: If investors rotate to defensive assets (e.g., gold), Treasury demand may weaken further, pushing yields higher. However, Treasuries remain the most liquid and relatively safe asset globally, which could limit the extent of yield spikes.
US Economic Calendar for the week
This week's high impact economic news will come on Thursday and Friday while the rest of the week are full of Fed speakers schedules www.myfxbook.com
Technical Outlook
Monthly
We are still trading within the April range and the closest level I could see as draw on yield is 4.59% if the weakness in price continues.
Weekly
Im a bit uncertain of the target for the week provided that we had a big news on credit down grade. If price continues to deteriorate with the news take note of previous week’s high of 4.548% to the monthly range high of 4.59% as a possible target. If market shrugs of the news look at 4.39% to be targeted.
Daily
To recap what I mentioned last Friday… “Its also important to note that market might target the Daily Volume Imbalance starting at 4.412% to 4.382%. If yield closes below 4.382% chances are price could continue to rally further. Also note the fib levels for possible key reversal points.
The news on US credit downgrade, it helped fuel the yield to rebound from our expected reversal zone. For today my bias is for yield to target previous day’s high of 4.497% if market decides to push the price lower on this news else still look at previous day low of 4.39% to 4.548%
DISCLAIMMER: This technical analysis is based on historical chart data, which may not predict future market outcomes. Any insights or interpretations I provide are for informational purposes only and should not be considered investment advice. Please conduct your own research and consult a qualified financial professional before making any investment decisions.

US 10Y TREASURY: US downgradeThere is no rest for US Treasuries. The minute the trade tensions between the US and China were settled, at least for the period of 90 days, a new storm hit the market throughout rising concerns over the sustainability of the US debt. At least as this sustainability is perceived by the rating agency Moody’s, which downgraded the US sovereign rating by one notch late Friday. This news had an negative impact on the investors sentiment, but the most volatility in the US Treasury yields occurred in an after-hours trading on Friday, when the news hit the market.
Regardless of the news about US sovereign downgrade, the higher volatility was evident also during the previous week. The highest surprise came from the University of Michigan inflation expectations, which reached 7,3% for this year and 4,6% in a period of five years. This was higher from the previous estimate and certainly was a reflection of the imposed trade tariffs between the US and China. The highest weekly level of the 10Y US benchmark was 4,54%, however, yields are ending the week at the level of 4,44% in an after-hours trading on Friday. For the week ahead, there is no significant macro data scheduled for a release, however, the volatility might continue, especially on Monday. The reaction on a downgrade news might impose some increase in yields, until the market finds the new equilibrium level. On the opposite side some modest relaxation is also probable, around 4,0%-3,8% level.

US30Y : Not perfect anymoreS&P in 2011
Fitch in 2023
Now Moody downgraded it from AAA to Aa1
The reason is clear. The market thinks debt and interest payments are not sustainable for the US, Europe, Japan, and elsewhere. Bottom line: Nowhere is safe. No government bond is safe.
If it keeps climbing, above 5.25%, the Fed will have to act. The only way is QE. However, this time US will print to save just itself. No more life line swaps for the rest. Tariff would be in place. No trade with uncle SAM anymore. If you reject the rule based order, where you recycle your surplus forex and petrodollar into UST, you can expect no help.
This is the chart to watch if you are playing XAU and BTC.
For DXY, dollar may fall. Just that the other currencies will fall FASTER.
Watch it:
a) go up above 5.25%
b) then watch if the FED goes into action.
Exit stocks like what M.Burry did a few days ago.
Good luck to all of us. This will not end well.

Treasury Yield 1 month.. US10Y, US20Y, US03MY, US01MYFunny things happen when you use a little reasoning...
don't need to explain more...but weird how the levels and the patterns just scream right at yah...

US10 YR Yield Weekly Chart Analysis: NFAUpdate: May 15, 2025
-As per my last update(April 5, 2025) about the gap between March 24th candle and March 31st candle that any candle body close above that gap will invert that gap from resistance to support and Upside target will be Jan 13, 2025 candle High
- We had a candle body close above that gap and now its acting like support.
-Now i am expecting the bullish trend to continue and long term upside target is Jan 13, 2025 candle High and Short term upside target is April 7, 2025 candle high

US10 YR Yield Weekly Chart Analysis: NFAUS10 YR Yield Weekly Chart Analysis: NFA
-After sweeping the previous swing high we retraced back to 50% Fib(Equilibrium)
-Expecting this Week's candle wick to sweep Sellside Liquidity-1 and bounce
-If we bounce from here, iFVG-W (red rectangle) will be our resistance zone
-Rejection from that level can send it back to sellside and our next target will be BISI-W(green rectangle)
If any of these Support/Resistance levels are invalidated i will update the idea next week.
**Major economic events can cause drastic moves and invalidate these levels**

"The President wants lower rates"On February 5th we heard the following from US Treasury Secretary:
“The president wants lower rates,” Bessent said in an interview with Larry Kudlow, “He and I are focused on the 10-year Treasury and what is the yield of that.”
Bessent has further stated:
“He wants lower rates. He is not calling for the Fed to lower rates,” Bessent said. Trump believes that “if we deregulate the economy, if we get this tax bill done, if we get energy down, then rates will take care of themselves and the dollar will take care of itself.”
“We cut the spending, we cut the size of government, we get more efficiency in government, and we’re going to go into a good interest rate cycle,” Bessent said.
Currently, the bond market is calling BS on the above.
IMO the only way the bond market will come down meaningfully is if and only if there is fiscal responsibility. At some point the government will understand what the bond market demands...until then we will stay higher for longer. I would not be surprised at all if the 10 year hits 5.3% this year.
A doubling of the move in the lower orange box should not surprise anyone....that puts the 10 year somewhere in the 5.4% range. IMO anywhere between 5.3 and 5.6 is certainly possible and maybe even probable.


US 10Y TREASURY: tariffs negotiationsAnother rollercoaster of US Treasury yields calmed down after the FOMC meeting held during the previous week. As expected, the Fed did not make any changes to the current levels of interest rates. However, in case that trade tariffs cause some harm to the US economy, the Fed is in position to react swiftly. The economy is still growing at a solid pace, as Fed officials see it, and the jobs market is relatively strong while the inflation is still on the target to reach gradually 2% in the coming period.
The 10Y US benchmark yields reached lowest weekly level at 4,26% and moved to the higher grounds in the after FOMC meeting trading. They have closed the week at the level of 4,39%. Markets will spend the week ahead by digesting the latest economic data and also April inflation which is due for the release on Monday. However, the US-China trade tariffs negotiations are expected to start soon, which might bring again some higher volatility and nervousness among investors and traders on the market. As per current charts, some relaxation in the 10Y yields is quite possible, however, the impact of news related to negotiations could impact moves to both sides.

US 10Y Monthly, Weekly and Daily Bias(note ill be using the charting tool Trading view for faster annotations for multi-timeframe analysis)
A. Please check relevant US Economic news that might influence price action {eco us }
May 13 US Cpi & Inflation day
May 15 Jobless Claims, Retail sales, PPI, Empire Mfg Index, Fed Powell Speech
May 16 Housing Starts
you may also access in the web and filter the high impact news feed (www.myfxbook.com)
B. Monthly Range
Price action is currently confined to April range high of 4.59% and range low 3.86%
C. Weekly Range
My Bias for the week is to target 4.43% possibly 4.489% if yield starts trading below 4.262% our bias would change.
D. Daily Bias (May 12) will try to update this daily
Previous day high has already been mitigated and I'm more biased to say the first weekly old high's 4.438% will be targeted

EWJ outperformance when?EWJ outperformance lately has been related to USD weakening against JPY which has been linked with increasing Japanese yields against US yields. Likely linked with repatriation and increase in foreign flows or decrease in outflows

The increasing yields of JGBs might attract a repatriation bidIt seems with the increase in JGB yields we might start to see a strengthening yen. Especially with the possibility of repatriation and a "Mar a lago accord".
Plan accordingly...

US10Y - Yield Volatility Amid Fed Policy StanceThe 10-year Treasury yield fluctuated between 4.30% and 4.39% this week, closing at 4.382% on May 9.
The Federal Reserve maintained benchmark rates at 4.50%, dismissing pressure from the Trump administration for cuts. Chair Powell emphasised persistent inflationary risks and labor market stability, reinforcing a cautious "higher-for-longer" stance.
4.400% intermediate term buyside liquidity is a point of interest going forward.

How US01Y may relate to stock crashesUsing the 200 Week Moving Average,
we spot that stock crashes often relate with drop in short term bond yields.
Prior to 2008, yield rates usually drop by a few percents by hardly below 0.5%.
However since QE in 2008, bond yield decrease to a nearly 0% level.
These features allow us to spot these financial crisis on the graph easily.
However, whether if this indicator is leading indicator or lagging indicator requires future research.

Bond Yields moving soonSo, we redrew the trendlines a few days ago and this is where the 10Yr currently stands.
Bond Yields should give some sort of direction within the next handful of days. Be ready.
TVC:TNX
Interest Rates

The Long, Flat Road AheadWith the Federal Reserve’s rate decision in focus, I wanted to revise a previous idea that called for 6% on the 10 year T-bill, and provide a clearer read on what I’m seeing as the larger trend, which could provide important clues for the future of everything from monetary policy, to mortgage rates, and stocks.
Starting with the 500R chart, I think we are seeing a clear flat correction form, with the current segment of the trend being Wave C of (B). In a flat correction, the endpoint of (B) should reach at least 100% of (A). It can also extend further or, in less common cases, only reach 90% of (A), however for the purposes of this idea I will assume the yield will retrace to the 100% level, which is just above 5%.
If this were to play out, it would suggest incoming pressure to financial markets that will eventually subside, likely later in the year. Something else to look for is that if this (B) wave were to fit a Zig Zag structure, that would cause waves (A) and (B) to be of the same pattern, so we should anticipate an alternate pattern in (C), such as a flat, diagonal, or triangle.
The question on everybody's mind at the moment is if/when the next interest rate cut is coming. For today's announcement, I expect there to be no surprises, which can also be supported by short term technicals.
Looking at the 100R chart (right) and Daily chart (left) at the same time provides useful context. The yield bounced off the 0.618 retracement of the 4/4 - 4/11 rise (labeled as 0.382 on the fib extension) and should have upward momentum. On the contrary, the Daily chart shows resistance at what appears to be a more well-defined lower high, with imbalances below. On the 100R chart, I also have a box drawn to show the extremities of the 500R bar. I expect the yield to move higher without creating a new 500R bar - which means the max low would be just below 4.10%.
A retracement to this level would lead to the yield hitting the middle line of the lower imbalance, which should be a key liquidity zone. From there, a move to the 1.618 extension would take the yield to the targeted 5%.
Something else I look for when detecting reversals is divergence on the Fisher Transform oscillator. I have it on both charts, which suggests a near-term move to the downside. Divergences are even more reliable on the Range charts, so a slightly lower low on the yield occurring while Fisher makes a higher low would signal that yields are about to rise higher.
Assuming we see similar action play out, this would support my fundamental prediction that FOMC will temporarily provide relief to the markets - possibly from there being no surprises or dovish comments on rate cuts. I would, however, expect this to be short lived. Since I am already calling for stocks to be near a major reversal level, I expect a sharp rise in bond yields to correspond with a more powerful sell off of stocks than what we saw in February-April. More likely catalysts could be hot CPI and/or failure of US/China trade talks.
Since there isn't much left to comment about on the technical side of things, I'll leave it at that. I ultimately expect the yield to start moving to 5%, so if it starts moving higher from here (4.36% currently), it would invalidate the idea that this will make one more push lower this week. We'll see what happens. Thank you for reading and let me know what you think!

Will The FED cut rates? Maximum employment & stable prices were the choice of words from Jerome Powell last meeting addressing the economy.
While the headline Personal Consumption Expenditures (PCE) price index rose by 2.3% year-over-year in March 2025, the core PCE, which excludes food & energy, increased by 2.6%. Additionally the NY Fed's multivariate core trend suggests underlying inflation may be closer to 3.0%, indicating persistent inflationary pressures.
The April jobs report showed stronger than expected job growth, with unemployment remaining steady at 4.2%. This robust labor market reduces the urgency for immediate rate cuts.
Recent tariff implementations have contributed to rising inflation expectations, with a one year outlook projecting 6.5% inflation. This complicates the Fed's decision making, as cutting rates amid rising inflation expectations could undermine its credibility.
Now let's zoom out to June 2025 the probability of a rate cut at the June meeting has decreased to 37% following strong economic data.
My Chart gives a great outlook on rate cut possibilities and how we can take an overall outlook on the economy based on 10 yr Government Bond. I was able to add in a few important dates along with starting & ending points of rate cuts throughout those time frames. I did not include all the rate cuts in between. However, it can still serve as a great indicator moving forward. I hope this helps and let's hope for the best in our economy moving forward.

10Y Bond Yield Long: Riding Wave 3This is an update to my previous Elliott wave counts for 10Y yield. I believed we have completed a wave 2 and is now going into a wave 3. What this means is that if you are trading futures, it is the opposite: short futures (ZN1!).

Recession indicator #2 Just realized that measuring the spread between TVC:US02Y and FRED:FEDFUNDS gives you a pretty accurate heads up of looming recessions. We might be in one from a few months now.

US 10Y TREASURY: rollercoaster, againMarket movements in a previous period are clearly showing how high uncertainty is currently among market participants. The US Treasuries for one more time took the downtrend during the previous week, clearly testing the 4,2% level with 10Y US benchmark, but Fridays better than expected jobs report, was a trigger for a move back toward the higher grounds. The lowest weekly level of 10Y yields was 4,13% on Thursday, however, the rest of the trading week the market was looking at the upside. The strong move up, brought the 10Y yields toward the level of 4,30% where yields have closed the trading week.
The volatility might continue also during the week ahead. The FOMC meeting is scheduled for May 6-7th, while on Wednesday will be the interest rate decision day, and also Fed Chair Powell's address to the public. As per current market expectations, as posted by the CME Group FedWatch Tool, the Fed could leave interest rates unchanged at this meeting, considering stronger than expected jobs data posted during this week. In addition, the market is expecting that the Fed will not change interest rates until their meeting in July. At the same time, analysts are noting that it is too early to see the reflection of trade tariffs in real economy, concretely in jobs data, in which sense, they are taking precaution with current strong jobs data. In this sense, the Fed Chair Powell's speech, after the FOMC meeting will be closely watched by markets, for a standing of Fed on the current state of the US economy as well as their view on tariffs repercussions in the future period.
