Government bonds

US yeilds in a corrective rebound In analysis from a few weeks back, we talked about bearish USD and presented a bearish outlook. Since then dollar fall nicely and one of the reason are also lower US yields.
Looking at US yeilds I see bearish impulsive price action down from 4.8%, which could keep the US dollar in a downtrend. What we’ve seen so far is a strong rebound from 3.8%, as shown on the updated 4-hour chart. This rebound suggests that yields are stepping into a correction now, which could unfold as an A-B-C structure. So, it looks like we could see a bit more upside in the near term before US yields turn back to the downside. At the same time, this could mean the US dollar may find some support soon or remain in consolidation a bit longer.
GH

It’s the bond market that's putting Trump in his placeIt’s the bond market that's putting Trump in his place. Normally, when stocks fall, investors flock to U.S. Treasuries. But this week, long-term yields have risen sharply over the first three days. That means Treasuries aren’t being bought — they’re being sold. With America’s massive national debt, higher interest rates make debt servicing more expensive. Sure, they could fire up the printing press, but an abundance of dollars just fuels inflation.
At the same time, the dollar has weakened against the euro, and investors are net sellers of U.S. equities.
Trump doesn’t have good cards to play. He’s had to pull the emergency brake and put the retaliatory tariffs on hold. Officially, the reason given is public “nervousness and unrest” — an absurd excuse. Since when has he ever cared about that?

US10Y This break-out will be massive.The U.S. Government Bonds 10YR Yield (US10Y) is trading within a 2-year Triangle pattern and following this week's trade events, got back on its 1W MA50 (blue trend-line). A potential break-out either way from this long-term pattern will be massive.
We do believe though that there are higher probabilities for a bearish break-out as the 1W MA50 is about to cross below the 1W MA100 and form the first 1W MA50/100 Bearish Cross since July 22 2019. Interestingly enough, that was following the last Trade War between the U.S. and China.
At the same time, the 1W RSI has been within a Channel Down since late 2022, indicating a huge Bearish Divergence.
-------------------------------------------------------------------------------
** Please LIKE 👍, FOLLOW ✅, SHARE 🙌 and COMMENT ✍ if you enjoy this idea! Also share your ideas and charts in the comments section below! This is best way to keep it relevant, support us, keep the content here free and allow the idea to reach as many people as possible. **
-------------------------------------------------------------------------------
💸💸💸💸💸💸
👇 👇 👇 👇 👇 👇

Danger: Recession could be on the way - Yield Curve observationsThis chart shows the monthly yield curve, being the 10 year US Treasury yield - the 2 year bond curve.
In my previous charts, I had pointed out that 2 weeks after the yield curve curve uninverts that recessions are typically either just started or about to start.
This is shown on the charts by the white dotted line.
While looking at the charts, i noticed that the RSI has a tendency to go above 70 when there is a big crash in the markets - pointed out the previous 3 on the chart as the dot com bubble, 2007-2009 financial crash, and the covid crash.
Note that the Covid crash happened before the spike in the yield curve, and this probably has something to do with the global stimulus that was printed in quick response to the pandemic.
Currently, the RSI is NOT above 70. But it is showing evidance of wanting to break through.
I believed that the tariff war that is going on was not going to be as worrying as the previous crashes - but this chart is showing that we are in dangerous territory.
Will be following this chart carefully


US10Y - US03MY uninversionIt is uninverting for real now
Horizontal support shown took precedence over short term bear flag
Not financial advice

Giant 10 Year Yield to the Upside - The Economy is CookedThings are historically bad. The biggest reversal you can imagine. The economic situation has continued to decline.
How are you handling this?
The tariff make the headlines but why is the 10 year yield behaving this way.
Maybe a flight to safety. This is crazy this nuts. I can't even believe this is happening.

IT IS GETTING UGLY OUT THERE.IT IS GETTING UGLY OUT THERE.
Expect the Fed to cut rates real soon.
Then cut them again.
And again.
WHY EVERYTHING IS GOING DOWN? ANSWER IS HERE!Understanding the Simultaneous Decline in EVERYTHING!
1. The Influence of U.S. Treasury Yields and Interest Rates
The U.S. 10-year Treasury bond yield is a major benchmark in global finance. When yields rise, it signifies that bonds are becoming more attractive relative to riskier assets. Rising yields typically occur when:
Investor Demand Shifts: Investors move from risky assets (like equities or crypto) to safer, higher-yielding government bonds.
Inflation Expectations: Higher inflation expectations often lead investors to demand higher yields, which in turn increases borrowing costs.
Cause and Effect:
When Treasury yields increase, the opportunity cost of holding lower-yielding assets rises. This makes stocks, precious metals like gold, and speculative assets like cryptocurrencies less attractive. Even gold, typically seen as a safe haven, can lose its charm if fixed-income assets provide competitive returns with significantly lower risk.
2. M2 Money Supply Dynamics
The M2 money supply measures the total liquidity available in the economy, including cash, checking deposits, and easily convertible near-money assets. Changes in M2 can impact asset prices in several ways:
Expanding M2: More liquidity in the market initially can boost asset prices. However, if this expansion leads to rising inflation, it may eventually trigger higher interest rates and bond yields.
Contraction or Slowing Growth in M2: A tightening in liquidity can reduce the flow of money into various asset classes. This dampens overall market sentiment and makes riskier assets less attractive.
Cause and Effect:
If M2 growth slows or contracts, there is less capital to chase after higher returns in equities and crypto. At the same time, if there is an expectation of tightening monetary policy, investors recalibrate risk expectations, which leads to a broader sell-off across multiple asset classes.
3. Investor Sentiment and Risk-Off Behavior
In periods where both Treasury yields are rising and the money supply signals less liquidity, the overall investor sentiment often shifts toward a "risk-off" stance. This means:
Safe-Haven Demand: Investors move into safe assets like government bonds, which drives up bond prices and yields while pulling money out of riskier assets such as stocks, gold, and cryptocurrencies.
Correlation Effect: As riskier assets are sold off, their prices fall in tandem. Therefore, even if gold typically acts as a counterweight to stocks, in a severe risk-off environment, all asset classes might decline.
Cause and Effect:
With a risk-off sentiment dominating the market, traditional safe havens (like gold) and growth-oriented assets (stocks and crypto) can experience simultaneous declines. Rising yields encourage a rotation away from these riskier positions, which reinforces the downward trend across multiple markets.
4. Historical Context: The Trump Era and Beyond
During the Trump administration, we observed episodes where Treasury bond prices surged significantly (e.g., a 10% surge) as investors sought refuge during periods of political and economic uncertainty. Eventually, as market sentiment shifted, yields rose, and this led to higher borrowing costs. The resulting effect was a broad-based retreat in many asset classes.
Example: In those periods, as yields climbed to around 4%, investor appetite for risk diminished. The market corrected across equities, precious metals, and cryptocurrencies, with all asset classes experiencing pressure concurrently.
Cause and Effect:
In the current climate, if similar dynamics are at work—namely, rising yields accompanied by tightening M2 growth—then we might see a similar pattern: gold, the S&P 500, and crypto all experience declines together because investor risk appetite is sharply reduced.
Conclusion
The simultaneous decline in gold, the S&P 500, and cryptocurrencies can primarily be attributed to rising U.S. Treasury yields and tightening M2 money supply. As yields rise:
The relative attractiveness of low-risk government bonds improves, encouraging a shift in investment away from riskier assets.
Increased yields raise borrowing costs, which in turn dampens economic growth and investor sentiment.
Slowing liquidity (as measured by M2) further restricts the available capital chasing after higher returns.
This confluence of factors leads to a widespread "risk-off" environment where even traditional safe havens like gold may fall as the entire market adjusts to a higher interest rate and lower liquidity backdrop. Investors thus move across asset classes in a coordinated fashion, leading to declines in gold, equities, and crypto alike.
Understanding this cause-and-effect relationship is crucial for professional traders who rely on disciplined strategies. With a clear view of the broader economic signals, you can navigate these shifts with precision—helping you not only to avoid costly mistakes but also to capitalize on high-probability opportunities that emerge during these market transitions.

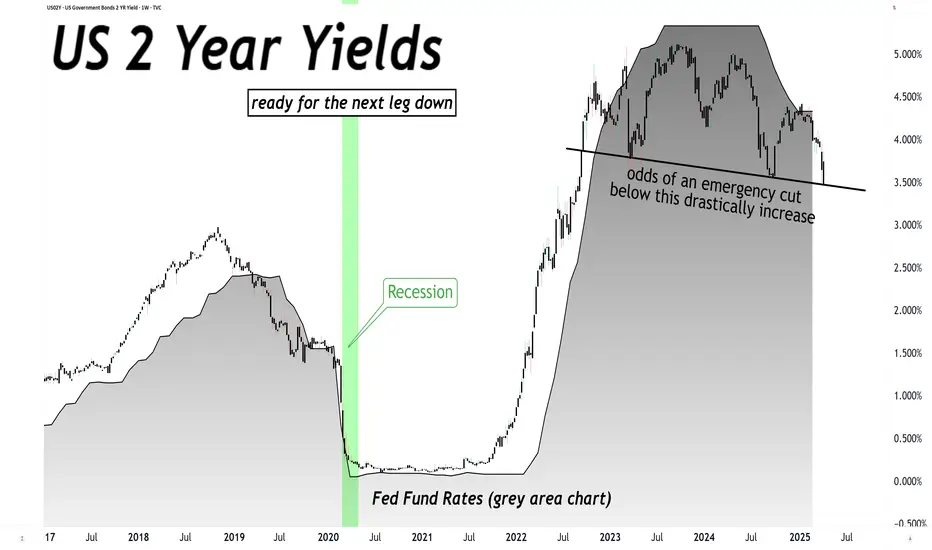
The weekly US02Y downtrend has started. As I have been expecting months ago, now the downtrend is been printed on the guppy emas. The trend is changing to red like in the past. This indicates that maybe a big correction might follow the SP500 in the coming months.

US10Y possible Wyckoff distribution patternAre we seeing distribution patterns here? Correlated, NASDAQ:TLT looks to be in an accumulative pattern.

US 10Y TREASURY: the Bad, the Good and TariffsAt the first look at the 10Y US benchmark chart, one might say that it looks pretty scary as of the end of last week. However, historically, it happens. Trade tariff war has started, which triggered a massive market uncertainty and a sell-off on financial markets. Naturally, the first idea in investors' perspectives for the future period is a recession on a world's scale and in the US and this was reflected in the US yields. It started at the beginning of the week, where yields from the 4,35% took the down course for the rest of the week, ending it with the 3,86% at the Fridays trading session. However, after reaching the lowest level, the yields reverted just a bit to end the week at the level of 3,99%. The strong move was also supported by Fed Chair Powell's comment that a trade war will have a negative effect on the US economy, which cannot be estimated at this moment.
The volatility of markets might continue for another week in a row. Markets will cope with estimation of countermeasures, which are slowly announced by other countries. Based on current probabilities there are equal chances that the market will test the 4,0% level, or it might move once again down, to test levels below the 4%.

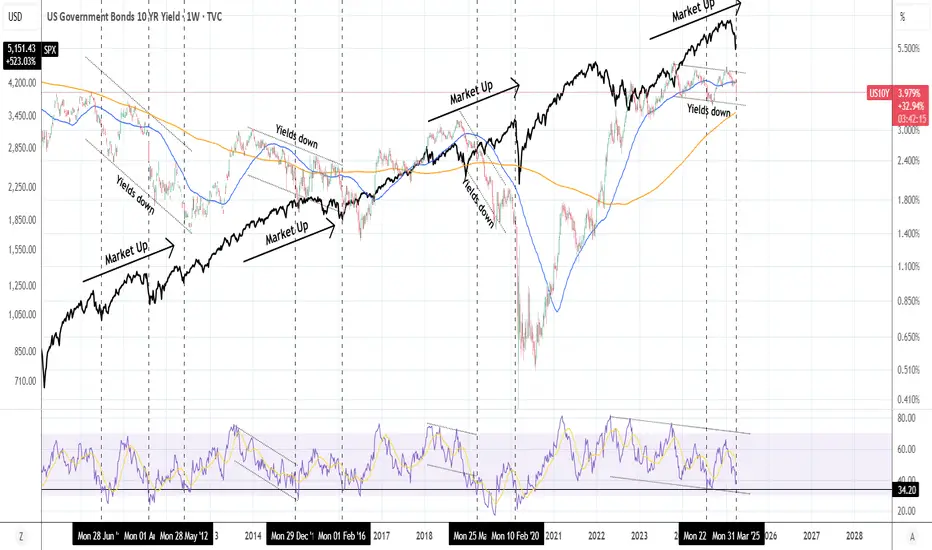
US10Y: This pattern has been extremely bullish for stocks.The U.S. Government Bonds 10 YR Yield is heavily bearish on its 1W technical outlook (RSI = 36.788, MACD = -0.034, ADX = 32.176) and that has historically been favorable for stocks. More specifically, when the Yields have been trending down inside a Channel Up since 2010, the S&P500 was on an uptrend. Going into more detail on the US10Y RSI on the 1W timeframe, it is almost on the 34.20 trendline, which is a key level as every time it hit that (see the dashed vertical lines), the S&P500 bottomed. The exception to the rule was, needless to say the COVID crash in Feb 2020. According to this, Trump's tariffs create the perfect market opportunity for a new long term buy.
## If you like our free content follow our profile to get more daily ideas. ##
## Comments and likes are greatly appreciated. ##
US 10-Year Yield Approaching the 0.236 Fibonacci RetracementThe US 10-year yield is approaching the 0.236 Fibonacci retracement level from the 1981 highs to the Covid lows. I expect this level to act as a temporary support, with yields rebounding higher for a bit. This should coincide with a relief rally in equities.

The global markets have spoken: The trade war is on. Hello traders
This chart layout is not new.
See my original Idea from February 23rd.
The wrecking ball is not gaining momentum. It reached supersonic speed yesterday and shattered the illusion that all is well on the blue planet.
The United States of America has upended the Global order that took 80 years to establish after WWII and financial markets that are still dealing with the Covid-19 pandemic on some levels.
And all of this to soothe the ego of the Narcissist in Chief.
If you have not grabbed these charts by now, I once again invite you to do so. Maybe it will help with trading decisions, maybe not.
As for my own portfolio of long term stocks, I cashed out in February and my FX trading is also on hold. I have no desire to chase my own tail at this point.
Best wishes to you all. And, mid terms are not that far away... Wisconsin has already spoken.

US Recession Imminent! WARNING!Bond traders are best when it comes to economics. Stock traders not so much.
As the chart shows, historically, when rates bunch up, what follows is a recession. During the recession, the economy tries to fix itself by fanning out the yield curve, marking it cheaper to borrow and boosting the economy.
The best time to be buying up stocks and going long the market is when the yield curve is uninverted and fanned out wide—not when it is bunched up like this.
My followers know this is my first warning of a recession since FEB. 2020.
WARNING! Things can get ugly from here very quickly!

H&S in US 10Y YieldH&S in US 10Y Yield, expecting downside as the neck line breakout today if it successfully closes below the neck line today in Daily TF.

Are longer term bonds really that bad of a buy?So many people I follow on X are very bearish the longer term bond cycle...claiming that the years of declining rates are over and that we are now in a new cycle of rising rates over the next 40-50 years. Even I have been a proponent of that language; writing up an idea on 3/31/2022 when rates were 2.326 and rising. But now it seems everyone is on that side of the boat which makes the contrarian view worth a look. Are longer term bonds really that bad of a buy right now?
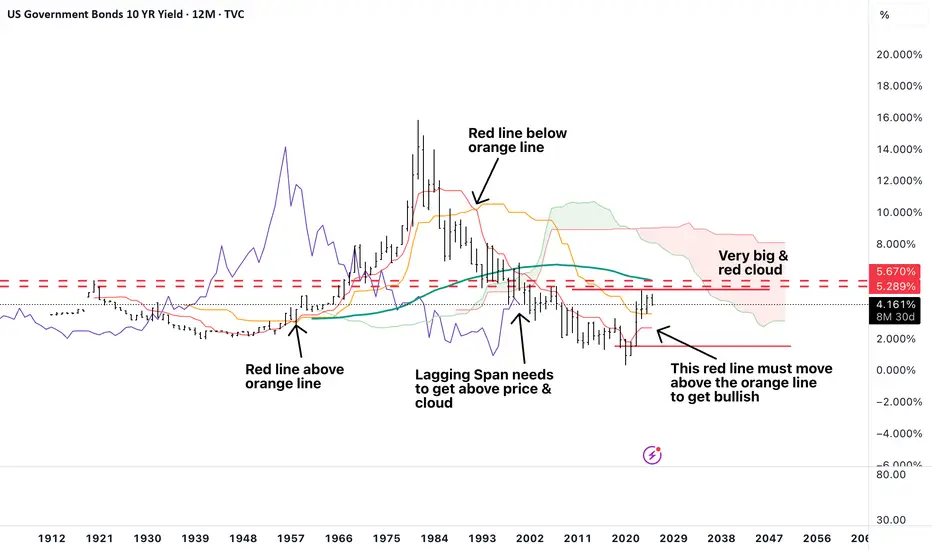
I decided to look at it from a simplistic Ichimoku point of view...using a yearly bar chart. Yes a really, really long term chart because if we are talking about the next 40-50 years then it's worth looking at a very, very long term chart.
However when looking at this long term Ichimoku chart; nothing about this chart suggests we are in a new cycle. In fact, nothing about this chart is bullish rising rates and you would just be trying to call a bottom out of thin air.
One of the first indications of a change in sentiment for Ichimoku is getting the Tenkan Sen (red line) to cross over the Kijun Sen (orange line). Even with the strength in rates over the following 5 years we are no where close to getting a cross over of those two lines to occur. In addition, the lagging span (purple line) is still below price and the cloud and the cloud is still hugely red.
In short, nothing about this chart screams longer term bonds are a bad buy...getting the 10 year rate chart to move from bearish (where it stands now) to bullish in the very long term will in fact be a fairly large task IMO.
Therefore, I am following the projection of the red & orange lines and right now they are suggesting a "flattening" out period...perhaps these two lines move closer over the next 10-15 years and then something occurs to spike rates and causes the red line to cross over the orange but until then people are just calling a bottom.
Basically rates would need to spike again this year or next to well over 6% to get the lagging span above price & the cloud and to cause the red line to move to an upwards trend...then and only then would I change my above stance.
10 year bond yield of indian govt bonds breaking down10 year bond yield of Indian govt bonds breaking down from weekly channel.
Foreign inflows (or macro tourists) helping Indian Rupee and Bond yields

US10Y - US03MY zoomed inBear Flag playing out. Zoomed in for easier viewing compared to old post.
Not financial advice.

US2Y - BUY (SELL BOND) strategy 3 hourly chart - regression The 2Y US yield has move lower and broken important yield level of 3.9650 area. The GAP lower 3.8500 currently, is providing an extremely oversold reading and other time frames are oversold as well but not as severe.
Strategy SELL BONDS @ 3.78-3.8350 yield and take profit with a 15 basis points toughly benefit. It does also support some US$ strength in coming sessions, is my personal view.

US 10Y TREASURY: emerging inflation? Another end of the week brought not so positive news to the markets, so some higher volatility was evident. The Michigan Consumer Sentiment came as a surprise, with increased inflation expectations from US consumers. Data showed that the sentiment for this year inflation has increased to 5,0%, while a five year sentiment is at the level of 4,1%. These figures strongly impacted US equity markets, the price of gold while the 10Y US Treasury benchmark yields dropped to the level of 4,25%, from 4,4% where they were traded on Thursday.
Friday's move was the strong one, in which sense, we could expect that the market will use the start of the week ahead to digest data. There is a high possibility that yields will revert a bit, at least to test the 4,3% level for one more time. However, it should be considered that uncertainty on markets caused by trade tariffs and inflation expectations are high at the moment, which will continue to be main drivers of market sentiment in the future period. For the week ahead, the NFP and unemployment data are set for a release, in which sense, volatility will most certainly continue.
