US 10-Year Yield: Recovery Under ThreatThe US 10-Year Treasury Yield, which dropped as low as 4.16% in February, has staged a modest recovery after finding technical support at that level—a move highlighted in our March 3 analysis.
However, yields now face a significant hurdle: a 5-month major resistance zone, sitting just below 4.40%. This area has historically acted as a pivot for medium-term direction.
A successful breakout above this resistance could lead to a move toward 4.44%, 4.47%, and possibly 4.52%.
On the flip side, a failure to break higher puts yields at risk of rolling over again, with 4.22% and 4.16% acting as the last lines of defence for the bullish structure.
Government bonds

US10Y H&S Reversal?This might be hopium.
For selfish reasons I'd like to see this 10Y come back down to earth.

US10Y - Will Donald Trumps Lower Interest Rates Come True?President Donald Trump late Wednesday criticized the Federal Reserve, urging the central bank to reduce interest rates, hours after it chose to leave borrowing rates unchanged.
He quotes “The Fed would be MUCH better off CUTTING RATES as U.S. Tariffs start to transition (ease!) their way into the economy,” Trump said in a post on Truth Social on Wednesday, adding “Do the right thing.”
On Thursday, we witnessed manipulation to the downside, indicating that in the short term we could be in for higher yields, with 4.267% being the 1st point of interest.
Reference: abcnews.go.com

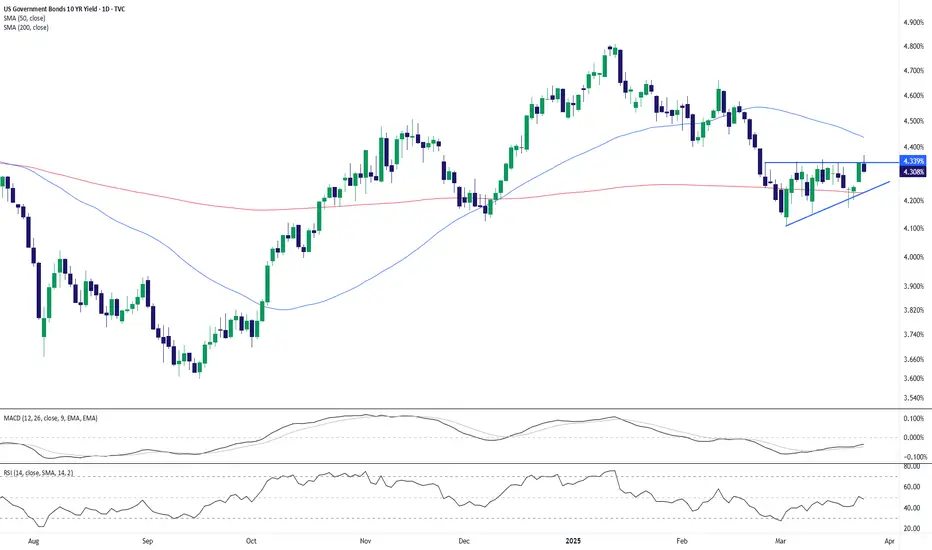
US 10yr Treasury Yields Press Against ResistanceThe U.S. 10-year Treasury yield is hovering just beneath the 4.34% resistance level, with price forming a tight ascending triangle just under this key level. Today’s pullback to 4.31% (-0.74%) suggests hesitation from bulls as momentum indicators turn mixed.
🔹 MACD is flat, showing a lack of directional conviction.
🔹 RSI sits at 47.94, neutral and non-committal.
🔹 Price remains sandwiched between the 50-day SMA (4.43%) and the 200-day SMA (4.22%).
A confirmed breakout above 4.34% could open the door for a run toward 4.50% or even 4.80%. Conversely, a drop below the rising trendline (~4.24%) would expose downside risk toward the 200-day SMA.
Watch for a catalyst (Fed commentary or inflation data) to break the deadlock.
-MW
US10Y: 10-Year Treasury Yield – Safe Bet or Yield Trap?(1/9)
Good morning, everyone! ☀️ US10Y: 10-Year Treasury Yield – Safe Bet or Yield Trap?
With the 10-year yield at 4.358%, is it time to lock in safety or wait for better rates? Let’s break it down! 🔍
(2/9) – YIELD PERFORMANCE 📊
• Current Yield: 4.358% as of Mar 25, 2025 💰
• Historical Context: Above pandemic lows (~1-2%), below early 2000s (5-6%), per data 📏
• Sector Trend: Inverted yield curve signals caution, per economic reports 🌟
It’s a mixed bag—let’s see what’s cooking! ⚙️
(3/9) – MARKET POSITION 📈
• Safe Haven: U.S. Treasuries are risk-free ⏰
• Income Appeal: 4.358% yield draws income seekers 🎯
• Potential Upside: If rates fall, bond prices rise 🚀
Firm in safety, with growth potential! 🏦
(4/9) – KEY DEVELOPMENTS 🔑
• Inverted Yield Curve: 2-year yield higher, hinting at slowdown, per data 🌍
• Fed Outlook: Expected rate cuts later in 2025, per posts on X 📋
• Market Reaction: Investors balancing income with economic risks 💡
Navigating through uncertainty! 💪
(5/9) – RISKS IN FOCUS ⚡
• Interest Rate Risk: If rates rise, bond prices drop 🔍
• Inflation Risk: Erodes real returns if inflation outpaces yield 📉
• Opportunity Cost: Missing higher returns from stocks ❄️
It’s a trade-off—risks are real! 🛑
(6/9) – SWOT: STRENGTHS 💪
• Risk-Free: No default risk, backed by U.S. government 🥇
• Liquidity: Active market for trading, per data 📊
• Tax Benefits: Interest exempt from state, local taxes 🔧
Got solid foundations! 🏦
(7/9) – SWOT: WEAKNESSES & OPPORTUNITIES ⚖️
• Weaknesses: Interest rate and inflation risks, per economic reports 📉
• Opportunities: Capital gains from falling rates, diversification benefits 📈
Can it deliver both income and growth? 🤔
(8/9) – POLL TIME! 📢
US10Y at 4.358%—your take? 🗳️
• Bullish: Buy now, rates will fall soon 🐂
• Neutral: Hold, wait for more clarity ⚖️
• Bearish: Wait for higher yields or better opportunities 🐻
Chime in below! 👇
(9/9) – FINAL TAKEAWAY 🎯
US10Y offers a steady yield with safety, but with an inverted curve, caution is advised. Gem or bust?

US 10Y TREASURY: two rate cuts?The Fed held interest rates unchanged at their FOMC meeting during the previous week. On a positive side is that they still perceive two rate cuts during the course of this year, which would account for 0.5 percentage points further drop in US reference rates. Fed officials noted that there are arousing uncertainties related to moves from the US Administration which could impact the US economy to some extent. For the moment the forecast for the economic growth for this year was decreased by 0,4 pp to the level of 1,7%. Inflation expectations have turned to higher grounds than previously estimated.
During the first half of the week, the US 10Y Treasury benchmark reached the highest level at 4,33%, while it ended the week at 4,25%. At this point on charts, it doesn't look like the market gave up on testing the 4,30% levels, meaning that the market might modestly revert back toward the higher grounds. It should be noted that the PCE data are set for a release on Friday, next week, which increases probability of a higher volatility of US Treasury yields.

The FED will cut rates.The FED will cut rates.
Then cut again.
Then cut some more.
Until there is nothing else left to cut.

Rate Announcement Will Cause EXTREME Levels Of Volatility!With a tremendous amount of high impact news being released next week, you can expect very high levels of volatility especially coming up towards the first rate announcement.
Last weeks price action delivered to the upside as expected but I do still believe there is unfinished business at the 4.343% - 4.404% weekly PD array.
I expect price to expand to the upside following the high impact news being released next week. This can lead to investors chasing higher yields in risk off conditions

US10Y decision comingUS10Y decision coming very soon.
Possible M Breakdown with 5th wave down, or retrace for shoulder.

US 10Y TREASURY: FOMC weekThe US February inflation data were posted during the previous week, and with 0,2% for the month, was in line with market expectations. However, the negative effects of the US Administration related to tariffs were reflected in the Michigan Consumer Sentiment Index, which dropped in March below market estimate. What is concerning is that consumers are now expecting the inflation of 4,9% for the year, which is much higher from previous posts. It is obvious that the tariffs-on, tariffs-off game is hurting consumers’ expectations. In addition, the FOMC meeting is scheduled for the week ahead, on March 19th, which might bring back some volatility across US markets.
The 10Y US benchmark started the previous week around the level of 4,15% and moved to the higher grounds through the rest of the week. The highest weekly level was 4,34% at one moment, but yields ended the week at the level of 4,31%. Some volatility could be expected at the beginning of the week ahead, and before the FOMC meeting. At current charts, there is still some space for the higher grounds, up to the level of 4,40%. Still, it should also be considered that some probability for 4,20% holds.

Clear Head&Shoulders TOP on the UST 10yYld Operating framework: How the mkt WENT IN (1st H&SBtm w/ measuring Obj VerticleUP) is how the mkt is going OUT (2nd H&STop with measuring Obj VerticleDN).
Not the Multi-pivot horizonal line acting a pivot/attractor confluence to the setp.
h/t Dan The MAN...

US02Y hidden bearish divergence and RSI rejection from level 40
US02Y could be repeating a pattern from August 2024. Hidden bearish divergence (continuation of lower highs) and rejection of RSI from level 40. Following the rejection, the yields went lower.
US02Y going lower is bullish for risk assets.
In addition, US02Y could be on the verge of a fifth Elliott wave to the downside. The second wave overshot a little the textbook 0.618 fib level. The fourth wave retraced a little less than the textbook 0.386 fib level. Given the RSI analysis above, the fifth wave could be starting now leading US02Y lower. This would be bullish for risk assets such as stocks and crypto.

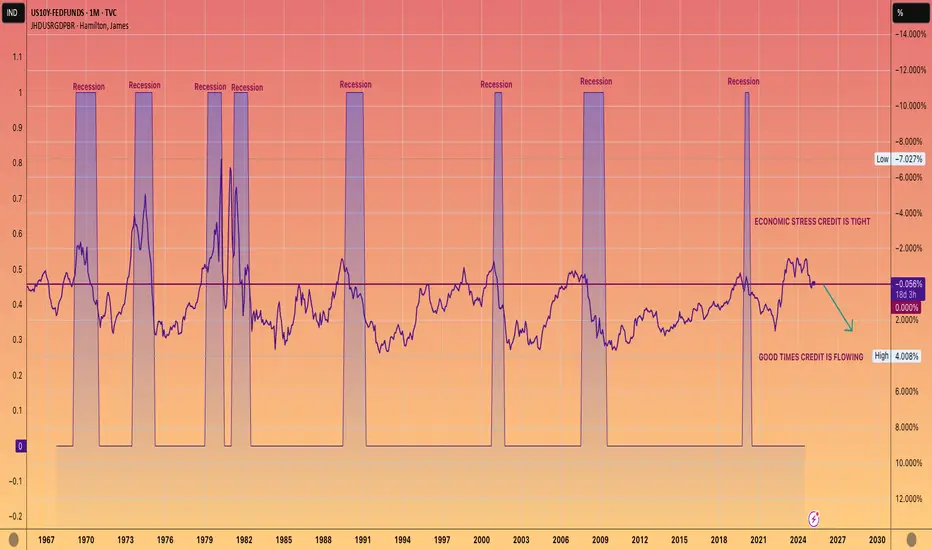
WE ARE COMING OUT OF A RECESSION. NOT GOING INTO ONE.This chart shows 10-year yield, which is closely tied to mortgage rates, minus the Federal funds rate.
When this figure is negative, it typically indicates that we are experiencing a recession or economic downturn.
Conversely, a positive number usually aligns with economic growth, often referred to as the good times.
While it's up to you to determine the reasons behind a official recession not being declared during the Biden administration, the undeniable data reflects a prolonged period of economic strain.
However, the current trend seems to be shifting towards a positive reading, which should lead to more accessible lending and economic growth.
AKA The good times are coming.
US10Y Strong sell signal below the 1D MA50.The U.S. Government Bonds 10YR Yield (US10Y) has been trading within a Channel Down since the October 23 2023 High. In the past 2 months it has been on a downtrend, which is the technical Bearish Leg of the pattern.
The 1D MACD is on its 2nd Bullish Cross on a decline, very similar with the previous Bearish Leg of the Channel Down. We are again on the 0.5 Fibonacci level and as long as any rebound gets rejected below or on the 1D MA50 (blue trend-line), the long-term bearish pattern remains intact.
We expect a similar Bearish Leg of -24% overall to target 3.685%.
-------------------------------------------------------------------------------
** Please LIKE 👍, FOLLOW ✅, SHARE 🙌 and COMMENT ✍ if you enjoy this idea! Also share your ideas and charts in the comments section below! This is best way to keep it relevant, support us, keep the content here free and allow the idea to reach as many people as possible. **
-------------------------------------------------------------------------------
💸💸💸💸💸💸
👇 👇 👇 👇 👇 👇

Bullish Bond BonanzaThis chart is simply ultra bullish.
This idea attempts to highlight a bullish pattern, within an ultra bullish pattern.
The first pattern is an Inverted Head and Shoulders pattern which has formed over 16 years!
In Oct 23, US30Y breached the 16 year Year High and since then we have created a double bottom (the second pattern) on the 3M chart at near equal lows around 3.9%
US30Y looks like it wants to break out very soon.
The red areas highlights the 3months selling Fair Value Gaps, however the closest unfilled 3M fair value gaps starts around 6.5%
I anticipate that the price will be initially attracted to the 6.5% area, but inverted head and shoulders pattern could play out over several years to get to the overall target.

relief pumpSeems like election bull was already priced in, new money got washed.
Bonds are making a comeback, cash is a position.
Expecting more downturn after a relief pump, coinciding with yields retracement.
Yields trending with equity price are usually signs of either economical expansion or economical fears, such as slowdown or recession, during up and downs. The markets just jumped from one narrative to the other:
expansion(trump gets in office) ---> slowdown(tariffs imposed)
I think the expansion narrative will take a while to settle back(end of Q2 at least) after all the executive orders signed.
Although, I'm still long for the month of March, nice opportunity for a relief pump, before resuming of slowdown narrative.

US10Y - You Can Make Money And Be WrongLast weeks bias was bearish and although we have closed out bullish this week, the bearish PD array @ 4.126% - 4.104% which I was expecting has materialised.
This goes to show that you don't have to predict the weekly close. It's the draw on liquidity that is important.

US10 Treasury Yield Stock Chart Fibonacci Analysis 031025Trading Idea
1) Find a FIBO slingshot
2) Check FIBO 61.80% level
3) Entry Point > 3.99%/61.80%
Chart time frame: D
A) 15 min(1W-3M)
B) 1 hr(3M-6M)
C) 4 hr(6M-1year)
D) 1 day(1-3years)
Stock progress: C
A) Keep rising over 61.80% resistance
B) 61.80% resistance
C) 61.80% support
D) Hit the bottom
E) Hit the top
Stocks rise as they rise from support and fall from resistance. Our goal is to find a low support point and enter. It can be referred to as buying at the pullback point. The pullback point can be found with a Fibonacci extension of 61.80%. This is a step to find entry level. 1) Find a triangle (Fibonacci Speed Fan Line) that connects the high (resistance) and low (support) points of the stock in progress, where it is continuously expressed as a Slingshot, 2) and create a Fibonacci extension level for the first rising wave from the start point of slingshot pattern.
When the current price goes over 61.80% level , that can be a good entry point, especially if the SMA 100 and 200 curves are gathered together at 61.80%, it is a very good entry point.
As a great help, tradingview provides these Fibonacci speed fan lines and extension levels with ease. So if you use the Fibonacci fan line, the extension level, and the SMA 100/200 curve well, you can find an entry point for the stock market. At least you have to enter at this low point to avoid trading failure, and if you are skilled at entering this low point, with fibonacci6180 technique, your reading skill to chart will be greatly improved.
If you want to do day trading, please set the time frame to 5 minutes or 15 minutes, and you will see many of the low point of rising stocks.
If want to prefer long term range trading, you can set the time frame to 1 hr or 1 day.

US10Y-JPY10YToday as of March, 10th 2025, we saw the spread between U.S. and Japanese 10-year yields break below a key support level at 2.80%, now trading around 2.66%. Tonight’s Japan session will be crucial, as the Japanese 10-year yield has climbed to 1.56%, breaking key levels. If the US10Y/JGB10Y spread continues to contract, the yen will keep strengthening.

US 10Y TREASURY: a roller coasterThe roller coaster continues to be in the heart of financial markets during the previous period. The uncertainty over the trade tariffs, mixed macro data, Fed President Powell`s notes, all contributed to the strong shift in prices of assets across financial markets during the last few weeks. Previous week the 10Y US benchmark started with a lowest level of 4,10% and then moved toward the higher grounds for the rest of the week. The highest weekly level was 4,33% reached on Thursday, while the level of 4,20 was tested on several occasions.
The US NFP data for February, with 151K was lower from market estimated 170K. At the same time, the unemployment rate jumped to 4,1%, from 4,0% posted previously. In this sense, analysts are currently calculating that the next Fed's rate cut might come in June this year. In this sense, the yields of US Treasuries were adjusted. However, the uncertainties over trade tariffs and its impact on the US economy continues to be a known-unknown, which might shape the sentiment of the market also in the future period and its roller coaster moves.

How we financing this¿Yields have been going down for 40 years while debt/gdp growing, how are we financing this hiking rates?

US 10YR Treaury Yield Stock Chart Fibonacci Analysys 030825Trading Idea
1) Find a FIBO slingshot
2) Check FIBO 61.80% level
3) Entry Point > 4.2/61.80%
Chart time frame: B
A) 15 min(1W-3M)
B) 1 hr(3M-6M)
C) 4 hr(6M-1year)
D) 1 day(1-3years)
Stock progress: A
A) Keep rising over 61.80% resistance
B) 61.80% resistance
C) 61.80% support
D) Hit the bottom
E) Hit the top
Stocks rise as they rise from support and fall from resistance. Our goal is to find a low support point and enter. It can be referred to as buying at the pullback point. The pullback point can be found with a Fibonacci extension of 61.80%. This is a step to find entry level. 1) Find a triangle (Fibonacci Speed Fan Line) that connects the high (resistance) and low (support) points of the stock in progress, where it is continuously expressed as a Slingshot, 2) and create a Fibonacci extension level for the first rising wave from the start point of slingshot pattern.
When the current price goes over 61.80% level , that can be a good entry point, especially if the SMA 100 and 200 curves are gathered together at 61.80%, it is a very good entry point.
As a great help, tradingview provides these Fibonacci speed fan lines and extension levels with ease. So if you use the Fibonacci fan line, the extension level, and the SMA 100/200 curve well, you can find an entry point for the stock market. At least you have to enter at this low point to avoid trading failure, and if you are skilled at entering this low point, with fibonacci6180 technique, your reading skill to chart will be greatly improved.
If you want to do day trading, please set the time frame to 5 minutes or 15 minutes, and you will see many of the low point of rising stocks.
If want to prefer long term range trading, you can set the time frame to 1 hr or 1 day.

Watch credit spread increase drive toward correction territoryThe Nasdaq is already flirting with correction territory, and other major market indices may follow as the credit spread increases. As the market indicates its perceived increased risk in corporate default, this spread (high-yield bond yield minus 10y bond yield) increases independent of what the Fed does.
If the recent mini-spike up to ~7.5% heads north of 10% in short order--6 to 9 weeks perhaps, I'll become proportionally bearish.
The calculation: Subtract the US10Y (left/middle blue line) from the High-yield bond yield (right purple line) to obtain the spread.
As of 7 Mar 2025, 11.95% - 4.305% = 7.65%
