Bitcoin - Ready for a new all time high! + ALT SEASON startingBitcoin is breaking out of the symmetrical triangle and showing major signs of strength, so we can expect to hit a new all-time high in the short term! Bitcoin was struggling in the past weeks compared to the stock market, but this should end!
Why do I think that the alt season is starting? To answer this question, we need to look at the BTC.D (Bitcoin dominance chart). if BTC.D goes up, that means money is flowing out of altcoins to Bitcoin, and when BTC.D goes down, that means money is flowing from Bitcoin to altcoins. And we want BTC.D to go up! So what is the chart telling us?
First of all, this is not exactly BTC.D on TradingView, but this is BTCDOMUSDT.P. I think this chart may give us a better outlook on the dominance at the moment. So what we can see here is that the long-term trendline is breaking down, that's a pretty rare event.
That's definitely great news! Time to buy some altcoins and prepare for a bullish altcoin season. I would say forget about Bitcoin and a 5% profit; let's buy some altcoins, and I want you to tell me in the comment section, what altcoin do you believe in?
Write a comment with your altcoin + hit the like button, and I will make an analysis for you in response. Trading is not hard if you have a good coach! This is not a trade setup, as there is no stop-loss or profit target. I share my trades privately. Thank you, and I wish you successful trades! Trading tip at the end: Learn to bear losses - A trader needs to accept the losses to maintain their emotional stability. Losses are a crucial internal part of trading that helps traders to learn how to grow from their losses. Traders learn from losses and implement required changes in their strategies for better results in future trades.
Crypto market

Bitcoin - Liquidity grab at $111.000?This 4-hour BTCUSD chart illustrates a potential short-term bullish continuation scenario followed by a deeper retracement, highlighting key liquidity levels and an important Fair Value Gap (FVG) support zone.
Liquidity sweep
At the top of the current price action, just above the $110,612.16 level, there is a clear area of resting liquidity. This zone has likely accumulated a significant number of stop-loss orders from traders who are shorting the market or who went long earlier and are protecting profits below previous highs. The market tends to seek liquidity to fill institutional orders, making this zone a high-probability target for a sweep. As a result, price is likely to take out these resting stop orders in a quick upward move, often referred to as a "liquidity grab" or "stop hunt", before potentially reversing or consolidating.
Bullish 4H FVG
Following this liquidity sweep, the chart suggests a retracement into a bullish 4-hour Fair Value Gap (FVG) located around the $106,600 to $107,400 region. This imbalance zone was formed during an impulsive move up, leaving behind a gap between the wicks of consecutive candles. Such gaps represent areas where demand previously overwhelmed supply, and they often act as strong support on a retest. If price revisits this zone, it is expected to offer support and could serve as a base for another upward push, assuming bullish momentum remains intact.
Downside risk
However, if the bullish FVG fails to hold as support and price breaks down through this imbalance zone, it would signal a weakening of bullish structure. In that case, the breakdown would likely lead to a deeper correction or even a trend reversal, with price seeking lower levels of support further down the chart. This would invalidate the short-term bullish scenario and suggest that sellers are gaining control, possibly triggering further liquidations and more aggressive selling pressure.
Conclusion
Overall, the chart is currently leaning bullish, anticipating a liquidity sweep to the upside followed by a potential pullback into the FVG. The reaction at the FVG will be critical in determining whether the market can continue higher or if it shifts into a deeper bearish correction.
Disclosure: I am part of Trade Nation's Influencer program and receive a monthly fee for using their TradingView charts in my analysis.
Thanks for your support.
- Make sure to follow me so you don't miss out on the next analysis!
- Drop a like and leave a comment!

Just Two Months Left: Navigating Bitcoin and Global ChangesGreetings to everyone reading these lines! Today, I want to share with you not just an analysis, but my personal reflections and feelings about the current situation in the financial and cryptocurrency markets, especially regarding Bitcoin.
Many of you already know that I have always been a firm believer in Bitcoin’s market cycles. Right now, we are approaching the final stage of another such cycle-the distribution phase. The past few months have seen considerable turmoil: Trump's election, escalating conflicts between India and Pakistan, Israel and Iran, rising tensions between Russia and Ukraine, and not to mention China’s increasingly assertive geopolitical moves. I can't shake the feeling that the world stands on the threshold of something significant, perhaps serious. I sincerely hope I'm mistaken, but signs of a global conflict or a substantial reset in the world order are undeniably in the air.
History shows us that after major upheavals and wars, the world undergoes profound changes. It seems we are nearing such a pivotal moment within the next couple of months. For a long time, I've highlighted September 2025 as a critical point in the current market cycle, and now everything confirms this scenario.
In these unstable times, participants in the financial markets face both risks and tremendous opportunities. The distinguishing factor today is the rapid integration of artificial intelligence into all areas of life. I firmly believe that if you don't begin incorporating AI into your activities now, you risk being left behind. Personally, I'm actively integrating artificial intelligence into my professional processes and everyday life, as I see it as inevitable in our near future.
Regarding the cryptocurrency market, I'll be frank: the past couple of years have significantly changed it and even somewhat disappointed me. Liquidity has become diluted, and the market has clearly become seasonal, with brief periods of explosive growth followed by long downturns. This has led me to return to trading Forex and gold, where the market is more transparent and predictable.
Many crypto projects that seemed promising in 2017 are now nearly forgotten and stagnating. Think of Dash, EOS, Litecoin, ZCash, and others-they haven't disappeared entirely, but they no longer play significant roles in the market. The battle for user attention has become overly aggressive, and competition has devolved into chasing short-lived hype. Nevertheless, there are exceptions, such as Solana—a project that achieved success thanks to a fortunate combination of factors. Yet such projects remain exceedingly rare.
Today, I see the most promising and powerful trend as the tokenization of real-world assets (RWA). It doesn’t matter so much which blockchain will be used-the concept itself has already proven effective. While this journey won't be easy, the involvement of giants like BlackRock indicates the trend is sustainable and promising in the long run.
Overall, I am confident that financial markets and digital currencies will continue to evolve and grow. However, in about two months, I plan to adopt a bearish stance. Unfortunately, there are few signs of a quick global economic recovery. The world needs significant restructuring and changes-new rules and agreements are inevitable, and the coming year promises many notable events.
Ask yourself: Are you ready for these changes? Are you prepared to adapt to new conditions, technologies, and realities? Personally, I'm fully ready, which is why I remain active in the market, continuing to share my thoughts, assist, and engage with each of you. If you have questions, ideas, or proposals for collaboration, I am always open to dialogue and eager for any interaction.
I sincerely thank each of you for your support, comments, and attention to my posts. I stay here because I believe in the enormous opportunities available even in the most uncertain times. We have an exciting journey ahead, and I invite you to travel it together with me.
Wishing you success, profits, and above all, peace and kindness on our planet. The time of change is already here. Let’s meet it together.
Warm regards,
Your EXCAVO.

Quantum Computing - Why BTC isn't the biggest worryYou’ve probably heard that quantum computing could break Bitcoin’s encryption—and that’s true. But here’s the thing: Bitcoin might not even be the biggest target.
The real risks? Financial systems, national security, healthcare, and even the internet itself. These areas rely on the same encryption methods that quantum computers could crack, and the fallout could be far worse than a Bitcoin hack.
Let’s break it down.
1️⃣ Financial Systems: A Global Crisis Waiting to Happen
Imagine if hackers could:
Drain bank accounts at will.
Manipulate stock markets.
Fake trillion-dollar transactions.
This isn’t just about stolen crypto—it’s about economic chaos. Banks, stock exchanges, and payment systems all depend on encryption. If quantum computers break it, we’re looking at a meltdown way bigger than Bitcoin’s $3 trillion market.
2️⃣ National Security & Internet Privacy: A Hacker’s Dream
Governments and militaries use encryption to:
Protect classified intelligence.
Secure communications between leaders.
Guard critical infrastructure (power grids, water supplies).
If quantum computers crack these codes, entire nations could be exposed to cyberwarfare. Your private data? At risk too—email, messaging, even your online banking could be decrypted years later.
3️⃣ Healthcare, Supply Chains & IoT: The Hidden Vulnerabilities
Medical records could be leaked, exposing sensitive health data.
Smart devices (like home security systems) could be hacked.
Supply chains might collapse if logistics networks are breached.
These systems weren’t built with quantum threats in mind—and upgrading them won’t be easy.
🔴 The Bigger Picture: A "Civilizational Upgrade"
Switching to quantum-resistant encryption is like rebuilding the internet’s foundation. It’s necessary, but messy. Some experts compare it to the Y2K bug—but way harder.
🔷 So, Is Bitcoin Safe?
Not entirely—about 25% of all Bitcoin could be stolen if quantum computers advance fast enough. But compared to the risks facing banks, governments, and hospitals? Bitcoin might be the least of our worries.
🔷 What’s Next?
Governments & companies are already working on fixes (like NIST’s post-quantum cryptography standards).
The transition will take years—and hackers might exploit weak spots along the way.
Staying informed is key. If you’re in tech, finance, or security, this affects you.
ℹ️ Want to Dive Deeper?
Deloitte’s take on quantum computing & Bitcoin
Forbes on quantum risks beyond crypto
🤷♂️ Bottom line?
Quantum computing is coming—and while Bitcoin has risks, the real danger lies in the systems we all depend on every day.
❔What do you think? Will we be ready in time? Let me know in the comments! 🚀

BITCOIN turning the Bull Flag into Support??Bitcoin (BTCUSD) has been trading sideways, almost flat, since the July 03 High, supported by the 1D MA50 (blue trend-line).
Perhaps the strongest development of the week though is the fact that this consolidation has been taking place at the top (Lower Highs) of what we previously identified as a Bull Flag pattern.
Together with the 1D MA50, this Lower Highs trend-line forms a formidable Support, which as long as it holds, can technically fulfil the technical expectations out of this pattern and target the 2.0 Fibonacci extension at $168500.
Is this one step closer to our 'fair valued' $150k Target for this Cycle? Feel free to let us know in the comments section below!
-------------------------------------------------------------------------------
** Please LIKE 👍, FOLLOW ✅, SHARE 🙌 and COMMENT ✍ if you enjoy this idea! Also share your ideas and charts in the comments section below! This is best way to keep it relevant, support us, keep the content here free and allow the idea to reach as many people as possible. **
-------------------------------------------------------------------------------
💸💸💸💸💸💸
👇 👇 👇 👇 👇 👇

SOLANA Loves THIS Pattern | BULLISHSolana usually increases alongside ETH. Possible because its a big competitor.
We can see SOL follows ETH very closely, with the exception of dipping earlier than ETH by a week:
In the 4h, we see a push to breakout above the neckline resistance:
In the daily timeframe, SOL is just about to break out above the moving averages - which would be the final confirmation of a bullish impulse to come:
Could this pattern be the confirmation of the start of another big pump for SOL?
_______________________
BINANCE:SOLUSDT

Bitcoin – Rejection Confirms Trap, Next Stop: $107kBitcoin attempted to take out the swing high around 110.5k but failed to clear the previous all-time high, resulting in a sharp rejection. This failure marks a significant turning point, suggesting a lack of bullish momentum at premium levels. The rejection came after a sweep of equal highs within a well-defined resistance zone, indicating a potential liquidity grab.
Highs Swept, But No Breakout
After dropping into support around the 107.5k region, price managed to push up and form a new swing high, but once again met heavy selling pressure after sweeping the prior equal highs. That sweep and the subsequent rejection give this structure the character of a classic liquidity trap, where smart money runs the highs only to reverse.
Weak Lows Below
The support zone has now been tapped multiple times, and the most recent low is structurally weak. It failed to produce a higher high, which makes it vulnerable to a clean stop hunt. Given this context, these lows are likely to be targeted next, as price seeks out sell-side liquidity resting beneath.
Expected Path Forward
I’m expecting further downside to unfold from here. The rejection from resistance, paired with the weak internal structure, suggests Bitcoin will take out the weak lows near 107.5k. Once those lows are swept, I expect a bullish reaction from the same demand zone, setting up a potential long opportunity back into the 109k–110k area. The plan is to look for signs of a reversal after the sweep, such as a 5M market structure shift or a fair value gap entry setup.
Liquidity Map and Trade Plan
The current price action is best viewed through the lens of liquidity. The highs were engineered to trap breakout buyers and then rejected. Now, the weak lows offer the next logical draw on liquidity. My focus is on short-term downside targeting that 107.2k–107.5k support region, followed by a potential bullish reversal setup once that liquidity is cleared.
Conclusion
This is a clean example of a failed breakout, followed by engineered liquidity moves in both directions. As long as price respects the current structure, my bias remains short into the weak lows, followed by a high-probability long setup once those lows are swept and the market shifts.
Disclosure: I am part of Trade Nation's Influencer program and receive a monthly fee for using their TradingView charts in my analysis.
___________________________________
Thanks for your support!
If you found this idea helpful or learned something new, drop a like 👍 and leave a comment, I’d love to hear your thoughts! 🚀

SOL/USD 2H chart PATTERN.SOL/USD 2H chart, the price is forming a bullish ascending triangle breakout, and it's approaching the upper resistance trendline. If it breaks out with volume, a strong move upward is expected.
📈 Bullish Target Points:
1. First Target:
✅ $157.80 — This is the first horizontal resistance and initial breakout target.
2. Second Target:
✅ $162.00 — A higher resistance level based on previous highs and projected breakout momentum.
---
🔎 Additional Notes:
Support Level: Around $149.90 — also near the ascending trendline.
A confirmed breakout above the triangle with a daily candle close and strong volume would validate these targets.
Consider using a stop-loss below $149.00 if you're trading this setup.
Let me know if you want a trade entry suggestion or risk management strategy.

ETHBTC Opportunity Buy: Major 2025 AltcoinSeason & Bull MarketThis is the big one and the good one. ETHBTC was bearish since December 2021 but this cycle finally came to an end in April this year. After the initial bullish breakout and higher low we can clearly see some bullish action developing; three consecutive weeks green. The bullish bias is now confirmed. It is still early.
We are looking at 200% potential. The "back to baseline" target. This is a price range where ETHBTC traded sideways as part of a distribution phase for more than two years. This is a must-to-be-tested resistance zone and thus opens up a sure 200% profits potential for this newly developing bullish wave.
Ethereum's ETFs are coming, Bitcoin already has its ETFs. This can mean Ethereum outperforming Bitcoin, and many altcoins, in so many ways. This also opens up the potential for a new all-time high on this pair.
The same sequence of 'low-higher low' happened in the last bull market. ETHBTC hit bottom in September 2019 then produced a higher low and this signaled the start of a major, long-term 447% rise. The conditions are similar now but the rise will be faster.
We have two main targets for the all-time high in late 2025 or early 2026.
1) 0.13207. With 442% profits potential from current price.
2) 0.20278. With 733% profits potential.
The entire bullish cycle for this pair can unravel within 4-6 months. If it becomes extended, it can last one year or longer. Both scenarios are possible.
It is 100% certain that ETHBTC will go on a major bullish cycle together with the rest of the altcoins market. Bitcoin will also grow.
Thanks a lot for your continued support.
If you are bullish on Crypto, comment below.
Namaste.

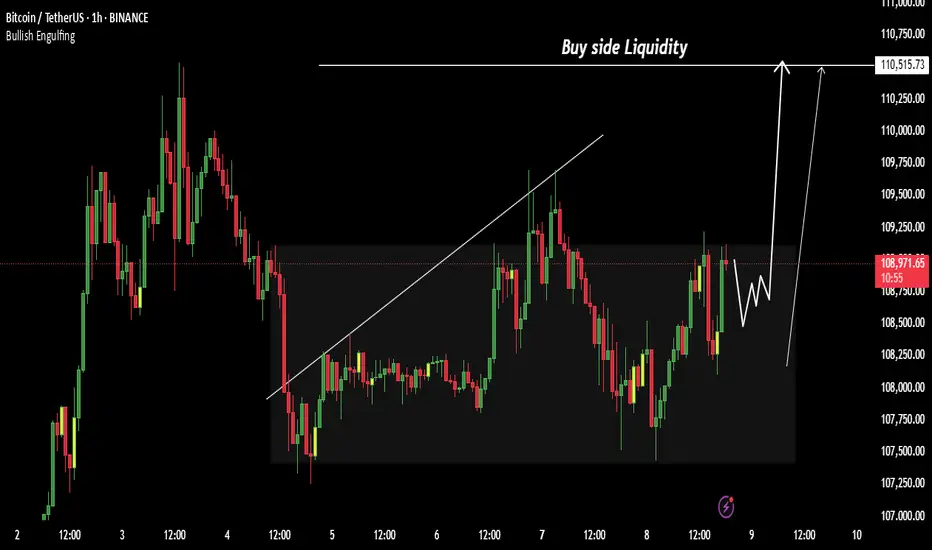
Lingrid | BTCUSDT Short-Term Bullish Momentum The price perfectly fulfilled my last idea . BINANCE:BTCUSDT continues to trade within a strong upward channel, supported by consecutive higher highs and an ascending trendline. After breaking above the range near $108,200, price briefly peaked above $110,000 before pulling back to retest the mid-support zone. Current action shows a rebound from the upward trendline, suggesting buyers are preparing for another leg up toward $110,500 and possibly the $112,000 resistance zone.
📈 Key Levels
Buy zone: around 108,000 or below
Sell trigger: break below 107,000 with close under channel
Target: 110,500 – midpoint resistance, followed by 112,000
Buy trigger: bounce from trendline and reclaim of 109,000
💡 Risks
Weak rebound could signal range re-entry and stall upside
Break below the trendline may shift bias to 105,000
Multiple rejections near 110,000 could indicate topping pressure
If this idea resonates with you or you have your own opinion, traders, hit the comments. I’m excited to read your thoughts!

BTC/USD 1H chart Pattern.BTC/USD 1H chart I shared, the chart shows a bullish breakout pattern forming (likely a symmetrical triangle breakout).
Target Points Identified:
1. First Target:
📍 109,750 USD
2. Second Target:
📍 110,750 USD
---
Key Notes:
Breakout above the descending trendline signals a bullish move.
Ichimoku cloud is thinning, suggesting possible momentum if price breaks upward.
Make sure to confirm the breakout with strong volume.
Let me know if you want stop-loss levels or a detailed trade setup.

Lingrid | AVAXUSDT Bullish Surge Potential After BreakoutBINANCE:AVAXUSDT is attempting a breakout from the long-standing downward trendline after rebounding from the 17.62 support area. Price is consolidating just beneath the descending resistance, hinting at an imminent breakout toward the 21.30 target level. If bulls maintain pressure above the breakout zone, this move could invalidate the previous bearish momentum and initiate a mid-term bullish reversal.
📈 Key Levels
Buy zone: 17.60–18.00 (above rebound base and trendline test)
Buy trigger: confirmed breakout above 18.50 with strong volume
Target: 21.30 intermediate resistance zone
Sell invalidation: break below 17.00 may reintroduce selling pressure
💡 Risks
Failed breakout may trap buyers and push price back below 17.60
Broader bearish structure still intact unless price clears 21.30
Thin momentum could result in choppy price action before breakout
If this idea resonates with you or you have your own opinion, traders, hit the comments. I’m excited to read your thoughts!

Bitcoin Dominance, RSI Bearish Divergence & Decreasing VolumeThis is a classic signal and we are going to be looking at it on two different timeframes, daily and weekly.
Bitcoin Dominance (BTC.D) is producing a strong bearish divergence with the RSI. The weekly timeframe is very pronounced and I will show you the details below. This type of signal tends to support a change of trend. It appears before the reversal happens but sometimes it can take years before it goes into effect.
» BTC.D Weekly RSI
Here you can see the RSI peaked October 2023. Then a lower high October 2024, then again in April 2025 and finally last month.
As the RSI produces lower highs BTC.D is producing higher highs.
This signal is supported by decreasing volume. Bitcoin Dominance continues to climb higher while trading volume continues to drop. Both signal support a change of trend soon and together they become stronger.
» BTC.D Daily RSI
The daily RSI peaked June 2023 but we will focus on the short-term as we already have a strong signal coming from the weekly.
Here we have a peak in May 2025 and a strong lower high in June. Needless to say, BTC.D peaked 27-June thus the divergence but the action is clearly weak.
» Bitcoin daily
There is a long-term rising wedge on the weekly timeframe and this pattern can also support a reversal.
All these signals are bearish but not very strong, still, there is some weakness on the bearish side for this index. This means that the action can turn bearish tomorrow or it can continue rising for weeks or months before turning red.
These signals are pointing to a reversal but they do not give us a specific date. Can happen next week, next month or in seven months. If we focus on the altcoins, the way they are looking and how long will it take for them to grow, then this index can turn bearish within 2-4 weeks. Bitcoin will also grow as the altcoins market grow. Everything Crypto will grow in late 2025.
Thanks a lot for your continued support.
Namaste.

Bitcoin Expecting Bullish FormationBitcoin could be triggered by negative news from the U.S. regarding tariffs, which may create market uncertainty and push investors toward risk-off or alternative assets like crypto.
Currently, Bitcoin is reacting to the decline caused by fundamental negative data, but bullish sentiment remains alive as buyers attempt to hold key support zones. The focus now shifts to the psychological resistance near 110K
You may find more details in the chart.
Ps support with like and comments for more better analysis.
SOL Harmonic Setup — $95 Sweep May Precede Rally Toward $200 +Solana may be forming a rare bullish harmonic pattern, suggesting a possible sweep of the $95 low before a reversal targets the $200 region. Critical resistance levels remain key in the short term.
Solana is showing early signs of a high-probability harmonic setup that could lead to a powerful bullish reversal — but not before a potential sweep of the recent $95 low. From a technical perspective, price is currently trading near the point of control, battling resistance layers that may trigger the next corrective leg in the pattern. If confirmed, this harmonic could produce a textbook C-to-D leg completion before launching a move toward the $200+ zone.
Key Technical Points:
- Point of Control Battle: Price is currently testing the POC with weak momentum
- Resistance at Value Area High + 0.618 Fib: Confluence zone could trigger rejection
- C-Leg Completion Around $95: Potential low before bullish harmonic activates toward $200+
Solana’s price action has entered a critical zone of decision. Price is hovering near the point of control — the highest volume-traded level in the current range — and is now contending with a strong confluence of resistance just above. This includes the value area high and the 0.618 Fibonacci retracement, both of which have historically produced strong rejections.
If Solana fails to break through this resistance cluster with conviction, it increases the probability of a C-leg rejection within the emerging bullish harmonic pattern. This corrective move could send SOL back down toward the $95 region, sweeping the previous low and completing a technical bottom.
Such a move — while bearish in the immediate short term — would not invalidate the bullish thesis. In fact, a sweep of $95 could act as the final leg (D) completion of what may evolve into a textbook “godly harmonic” pattern. These structures are rare and powerful, typically resulting in sharp reversals when key conditions align. The eventual upside target for this move lies in the $200+ region, in line with the prior macro swing highs and high time frame resistance levels.
Until this scenario is confirmed or invalidated, Solana remains range-bound between major high time frame levels. Traders should stay alert for signs of rejection at current resistance — or, conversely, a volume-backed breakout above the value area high that would negate the harmonic setup.

Bitcoin can rebound up from support line of upward wedgeHello traders, I want share with you my opinion about Bitcoin. In this chart, we can see how the price dropped from the 102800 support level, which coincided with the buyer zone, and later entered to wedge upward. In this pattern, price made an impulse up from the support line of the wedge pattern and broke the 102800 support level, after making a retest, and continued to move up. Bitcoin rose to the current support level, which coincided with a support area and even entered this area, but soon turned around and fell below. Next, price rose to this area again and then made a correction movement, after which it turned around and made an impulse up to the resistance line of the wedge, breaking the 108000 level. After this movement, the price bounced from this line and fell back to the current support level, where it some time traded in the support area. Later price rebounded and continued to move up. Now, I expect that BTC can correct to support line of the wedge and then rise to the resistance line of this pattern. That's why I set my TP at the 112600 points, which coincided with this line. Please share this idea with your friends and click Boost 🚀
Disclaimer: As part of ThinkMarkets’ Influencer Program, I am sponsored to share and publish their charts in my analysis.

PEPEUSDT Critical Decision Zone – Massive Move Incoming?🧠 Macro Technical Analysis
PEPEUSDT is currently hovering within a critical demand zone (0.00000095 – 0.00000110), an area that has historically acted as a strong accumulation base and a launchpad for previous rallies. The chart structure shows multiple interactions with this zone, highlighting its significance as a key inflection level.
This zone is not just a support — it’s a make-or-break battlefield between bulls and bears. Price is consolidating within this zone, setting the stage for a potential explosive breakout or a dangerous breakdown.
🔍 Pattern Breakdown & Key Technical Levels
Accumulation Zone (Yellow Box):
Seen from April 2024 to now, price has bounced several times from this region. The multiple touches and long wicks confirm strong buying interest here.
Sideways Channel / Range-Bound Structure:
Price action between 0.00000110 and 0.00000283 has formed a clear horizontal range, and the current price is once again testing the lower boundary of this range.
Implied Move Projection (Yellow Arrow):
A potential breakout from this range could trigger a measured move to the upside, aiming for the previous high at 0.00000283 — representing a +150% upside potential from current levels.
📈 Bullish Scenario:
1. Price holds above 0.00000100, maintaining structure above demand.
2. Break and daily close above:
0.00000127 (minor resistance)
Then 0.00000140, which could trigger acceleration.
3. Target levels to watch:
🟡 0.00000162 – Intermediate resistance
🟡 0.00000180 – Confluence zone
🟡 0.00000211 – Mid-range mark
🟡 0.00000240 – Major breakout checkpoint
🟡 0.00000283 – Range high and final bullish target
Break above 0.00000283 could open a parabolic rally.
📉 Bearish Scenario:
1. Breakdown below 0.00000095, followed by rejection from the bottom of the demand zone.
2. This could signal:
Weak market structure
Failed accumulation
Invalidation of the bullish setup
Key downside levels:
🔻 0.00000080 – Local support
🔻 0.00000065 – Historical low defense
🔻 0.00000038 – Macro capitulation zone
⚠️ Breakdown from current levels will turn this accumulation into distribution.
🧭 Strategic Takeaway:
PEPE is trading at a decisive zone. A bounce from this level could signal the start of a new bullish phase, while a breakdown could usher in a deeper bearish trend. Traders should closely monitor volume spikes, breakout candles, and confirmations above 0.00000127 to validate bullish momentum.
This is a low-risk, high-reward setup for disciplined traders with proper risk management.
#PEPEUSDT #PEPE #CryptoTechnicalAnalysis #AltcoinBreakout #MemeCoinSeason #CryptoTrading #AccumulationZone #BreakoutAlert #BullishCrypto #BearishScenario

ETH Pullback Before Next Rally? Hello guys!
Ethereum is currently testing a strong resistance zone around the $2,678 level, which has previously acted as a key barrier. Price action has been climbing steadily within an ascending channel, indicating a clear bullish trend in play.
However, since ETH is right at the resistance, we could see a short-term correction or pullback toward the $2,560–$2,580 support range (highlighted zone), which also aligns with the midline of the channel and previous consolidation structure.
If this support holds, a healthy bounce from this area would likely push ETH toward the next bullish target around the $2,760–$2,800 zone, which sits near the upper boundary of the current channel.

Cronos (CRO) Soars +20% – Can the Rally Push to $0.10?Over the past 24 hours , the Cronos project with the CRO ( COINBASE:CROUSD ) token has seen a price increase of nearly +20% .
Let's see if we can still profit from the movement of the CRO token .
What is Cronos (CRO)?
Cronos is an EVM-compatible blockchain built on the Cosmos SDK. It supports DeFi, NFTs, faster payments, and even AI‑capable dApps. Its native token, CRO, powers fees, staking, and ecosystem activities.
Why CRO Jumped +20% Today (July 8)
Technical leap: Sub-second block times and faster throughput
Better UX: Real-world ready for fast DeFi, payments, and AI dApps
Increased adoption: Greater utility across CAPITALCOM:CROUSD ecosystem
Trader momentum: Volume surges and speculative interest
Strategic roadmap alignment: Upgrades following gas fee improvements ---------------------------------------------------------------------
Now let's examine the CRO token chart on the 4-hour time frame from a technical analysis perspective.
CRO token is currently trying to break the Resistance zone($0.0960-$0.0925) .
Also, in terms of Elliott wave theory , this CRO token price increase with high momentum should be in the form of wave 3 and we can expect a correction to the Potential Reversal Zone(PRZ) for CRO .
I expect CRO to re-attack the Resistance zone($0.0960-$0.0925) after entering the PRZ and rise to at least near $0.1(Round Number) .
Note: Stop Loss (SL) = $0.847= Worst Stop Loss(SL)
Note: If the CRO token breaks the Resistance zone($0.0960-$0.0925) without correction, we can expect a break of the Resistance lines.
Note: It is better to enter a trade if you find the right trigger for a Long position, as a Short position is more risky.
Please respect each other's ideas and express them politely if you agree or disagree.
Cronos Analyze (CROUSD), 4-hour time frame.
Be sure to follow the updated ideas.
Do not forget to put a Stop loss for your positions (For every position you want to open).
Please follow your strategy and updates; this is just my Idea, and I will gladly see your ideas in this post.
Please do not forget the ✅' like '✅ button 🙏😊 & Share it with your friends; thanks, and Trade safe.

BTC – Bullish Continuation Ahead ?Bitcoin has been trading within a well-defined rising channel since mid-2023, respecting both upper and lower bounds beautifully.
After each impulsive move, we’ve seen healthy corrections followed by bullish continuations — a classic market structure in play.
🟦 Accumulation Zone: After a long accumulation phase, BTC kicked off a strong bullish cycle.
🟥 Correction Phases: Each major move was followed by a red correction zone before resuming the uptrend.
🟧 Current Phase: BTC is consolidating just below the upper channel boundary. A breakout above this zone could confirm the next bullish wave toward $140K+.
🔵 Key Observations:
Structure remains intact within the channel
Previous breakout zones now acting as support (blue arrows)
Continuation patterns are forming, signaling potential upside
🏹As long as the orange zone holds, BTC remains in a bullish structure, and a breakout would likely push us to new highs.
📍Will history repeat and BTC continue its journey toward the upper channel boundary? Let’s wait for confirmation!
💬 What’s your bias here? Are you bullish or waiting for a deeper pullback?
📚 Always follow your trading plan regarding entry, risk management, and trade management.
Good luck!
All Strategies Are Good; If Managed Properly!
~Richard Nasr

BITCOIN → Market manipulation. Chance for growth to 110KBINANCE:BTCUSDT , as part of a correction triggered by negative news from the US regarding tariffs, is testing liquidity in the support zone. There is a chance of recovery to 110K.
Bitcoin is reacting with a decline to fundamentally negative data on tariffs from Trump. Technically, the price is facing support and forming a false breakdown, the purpose of which was to capture liquidity. This could lead to a recovery within consolidation in an uptrend, but again, there are conditions...
Countries that have received notification of tariffs are responding positively to cooperation (if this trend continues, Bitcoin could receive a local bullish driver).
The market perceives this as positive, and after liquidity is captured, the price could recover to the resistance of the trading range.
Resistance levels: 108230, 109690
Support levels: 107500, 106500
Bulls are trying to hold the local interim bottom at 107500. There is a reaction to the false breakdown of support. The focus is on 108230; if the market can break through this level, we will have a chance to grow to 110K.
Best regards, R. Linda!

Delayed Cycle Kicks Off This March? (Chart)🚀📈 Delayed Cycle Kicks Off This March? 🔥💡
March has (almost) arrived, and Bitcoin has officially confirmed $79,478 as major structural support—a critical level that had to be checked before the next move. This aligns perfectly with my previous idea of a delayed cycle playing out.
📌 Long above 79K
📌 Short below 79K
📌 Short-term target: GETTEX:87K+
With this structural support holding, I expect Bitcoin to push toward the next major test: $113,800. This is the all-time trendline, a level of historical significance.
🔑 What happens at 113K?
This is where Bitcoin’s fate for this cycle will be decided:
✅ A breakout above 113K could unlock a run to 150K - 200K, a true extension of this cycle.
❌ A terminal rejection at 113K could mark the end of this cycle, signaling a broader correction phase.
At the moment, the probabilities lean toward further upside, with an 80% chance of continuation. The 20% downside risk remains for a dip to FWB:65K-66K, but as long as Bitcoin stays above 79K, the bullish thesis remains intact.
💡 March looks strong, and I’m stepping on the gas today.
Let’s make it a powerful month! 🚀
One Love,
The FXPROFESSOR 💙
video:

FLOKI/USDT — Major Breakout Incoming? The Calm Before a BullishThe daily chart of FLOKI/USDT reveals a highly compelling technical setup. After a prolonged downtrend that started in late 2024, FLOKI is now testing a key descending trendline — signaling a potential trend reversal and the beginning of a new bullish phase if a breakout is confirmed.
📊 Detailed Technical Analysis:
🔍 Pattern Formation:
Descending Trendline Resistance: Acting as a dynamic resistance since the November 2024 high, capping every major rally attempt.
Consistent Higher Lows: Since March 2025, FLOKI has been forming a series of higher lows — an early bullish sign of accumulation.
Volatility Squeeze: Recent candles are consolidating near the apex of the triangle, suggesting a breakout move is imminent.
Bullish Structure Forming: A successful breakout would complete a bullish reversal pattern on the daily chart.
🟢 Bullish Scenario (Breakout Confirmation):
If the price closes above 0.0001079 on the daily timeframe and confirms a clean breakout above the descending trendline, we can anticipate an extended move to the upside.
🎯 Key upside targets based on historical resistance zones:
1. Target 1: 0.00011535 → Previous minor resistance
2. Target 2: 0.00013414 → March 2025 supply zone
3. Target 3: 0.00016078 → Strong horizontal resistance
4. Target 4: 0.00020000 → Major psychological level
5. Target 5: 0.00028779 → Previous swing high (November 2024)
💥 A full breakout move to the top could offer over 200% potential upside, making it a high-reward setup for well-managed long entries.
🔴 Bearish Scenario (Rejection):
If FLOKI fails to break above the descending trendline:
⚠️ We could see a retracement to lower support levels:
Minor Support: 0.00007500
Key Support: 0.00005700
Last Defense: 0.00004548 → Previous cycle low
A breakdown below these support levels would invalidate the bullish setup and shift momentum back in favor of the bears.
🧠 Pro Tips:
Watch for Volume Confirmation during the breakout — high volume adds credibility.
Focus on Body Closes, not just wicks, when identifying valid breakouts.
Manage Risk Wisely — a stop loss just below the trendline offers solid risk-to-reward.
📅 Conclusion:
FLOKI/USDT is at a critical technical juncture. A confirmed breakout above the descending trendline could spark a strong bullish trend, while a rejection may lead to deeper correction or consolidation.
💡 The next few candles will likely determine the medium-term direction for FLOKI.
#FLOKI #FLOKIUSDT #AltcoinBreakout #CryptoSetup #TechnicalAnalysis #BullishCrypto #BreakoutTrade #TrendReversal #CryptoSignals
