Are you falling for 141k?The bull run on BTCUSD was not sudden, it corrected properly making a flat from 98K and breaking out the structure. this upward impulse looks too sharp to peirce 120-122k range its 1.618 fib extension of the broken structure.
Be cautious with the sell though, any rejection followed by a bear flag could be a great short with Stop above the top.
Good luck.
Crypto market
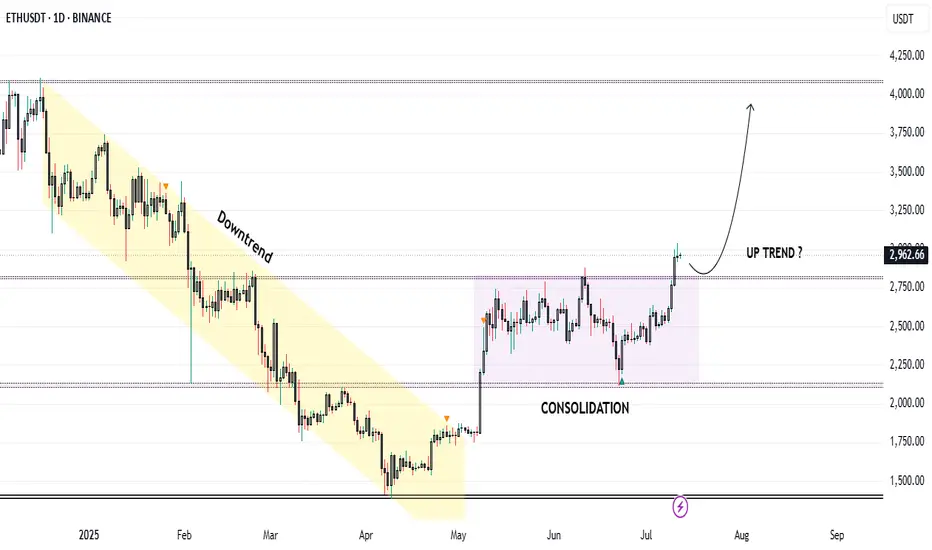
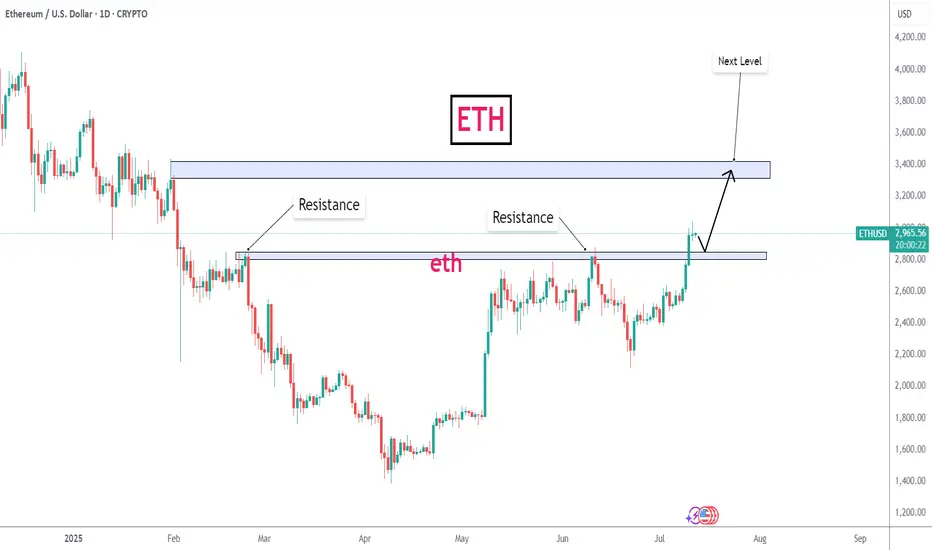
Trend Resumes: Ethereum Breaks Consolidation, Eyes $4050Market Structure Overview:
Markets typically move in two major phases:
🔹 Trend Phase (directional movement)
🔹 Consolidation Phase (sideways movement or accumulation/distribution)
These phases repeat as: Trend → Consolidation → Trend → Consolidation
Ethereum Price Action Breakdown (Daily Timeframe):
Mid-December to End-April: Clear downtrend phase.
May to Early July: Entered a consolidation zone, forming a tight range.
Current Status (July):
🔹 Ethereum has broken out of the consolidation range.
🔹 Currently trading around $3000, confirming strength.
🔹 This breakout may potentially signal the start of Altcoin Season.
Trade Setup – Long Position Idea:
Entry (Buy Zone): Around $2850 (retest of breakout resistance).
Target:
🔹 Primary Target: $4050
🔹 This aligns with a major resistance and Fibonacci extension zone.
Stop Loss: $2600 (below key structure support).
Technical Confluences:
* Breakout above multi-week range.
* Retest of resistance turned support at \$2850.
* Psychological round level near \$3000 acting as a magnet.
* Volume confirmation on breakout (optional to mention if on chart).
Risk Note:
⚠️ Caution: The Market may turn volatile due to unexpected geopolitical or macroeconomic news. Always follow risk management and avoid overleveraging.
Conclusion:
Ethereum’s breakout from a multi-month consolidation phase indicates a potential shift in momentum. If retest levels hold, this could be the beginning of a strong upside rally, possibly leading to a broader Altcoin Season. Traders can position themselves accordingly with a well-defined risk-reward setup.
FILUSDT_1D_BuyFILUSDT Cryptocurrency Analysis Daily Medium and Long Term Time Frame Main Support 2.320 Targets 3.486 and 5.948

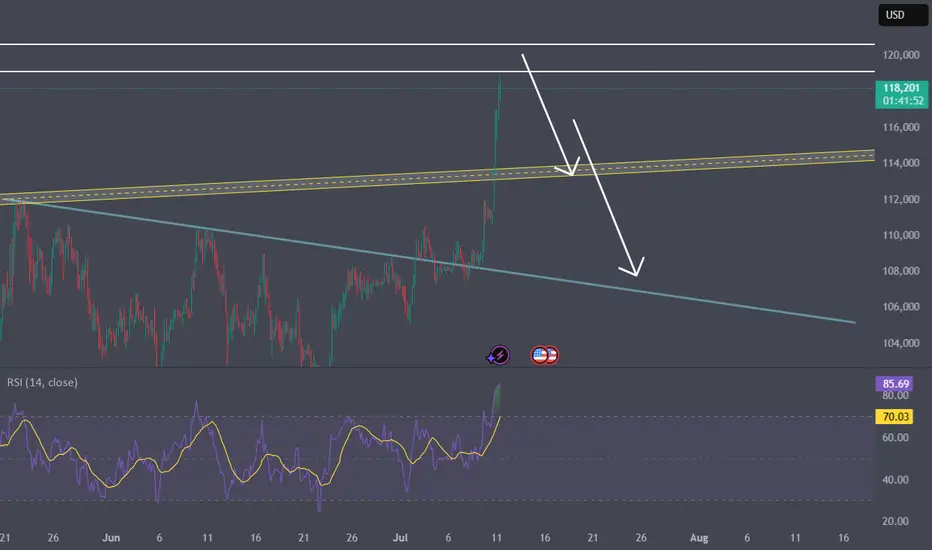
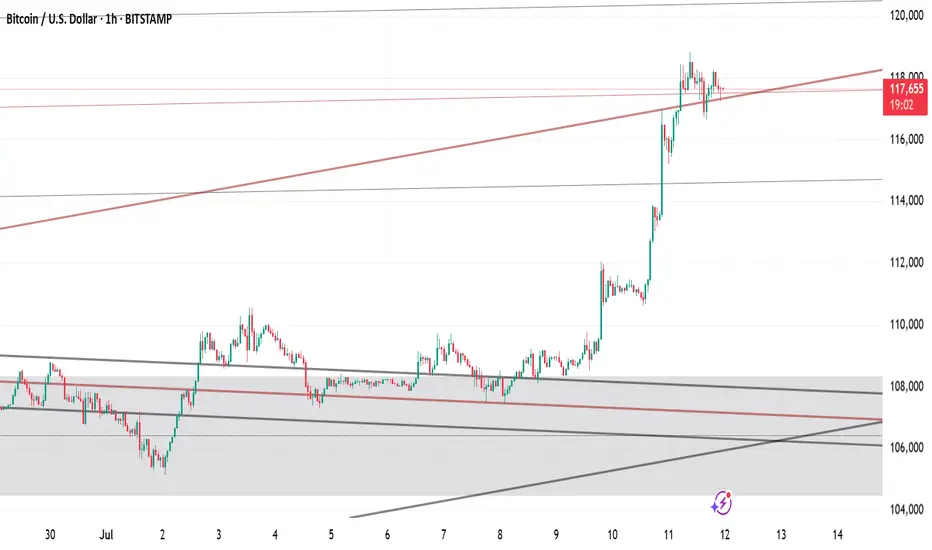
BTCUSDT – Market Update & RecommendationBTCUSDT – Market Update & Recommendation
In my previous analysis published on June 1, 2025 (TradingView), I mentioned the corrective pullback towards the $100k area before BTC resumed its next upward wave.
My latest evaluation (posted recently on my personal blog, linked in my TradingView signature) stated clearly that BTC would rise toward $110k, then experience a minor retracement to around $108.2k before consolidating and reaching new ATH between $118k–$125k.
At present, BTC has successfully touched the $118k mark and is undergoing a minor correction—this is a critical consolidation phase before price approaches the significant $125k distribution zone.
Recommendation:
Investors holding BTC purchased below $108k should closely monitor price action to secure profits as necessary.
Consider signals for potential Swing Short positions based on monthly (M) timeframe bottoms. This is a powerful and extended signal, potentially lasting until the end of 2025.
Caution is advised for any new BTCUSDT positions at this time.
Link:

XRPRipple’s CEO Brad Garlinghouse has made bold statements in 2025 about XRP’s potential to disrupt and capture a significant share of SWIFT’s cross-border payments market. Here are the key points:
Ripple’s Ambition vs. SWIFT
Goal: Ripple aims to capture up to 14% of SWIFT’s current cross-border payment volume within five years. SWIFT currently handles over $5 trillion daily in money transfers and more than 45 million financial messages.
Focus on Liquidity, Not Just Messaging: Garlinghouse emphasizes that SWIFT’s traditional strength is in messaging between banks, but the real value lies in liquidity—the actual movement of funds. Ripple’s blockchain-based XRP Ledger offers both messaging and instant liquidity, enabling faster and cheaper cross-border transfers.
XRP as a Bridge Currency: XRP facilitates instant currency conversions, reducing the need for banks to hold large foreign currency reserves in multiple countries, freeing up capital and improving efficiency.
Why XRP Could Gain Market Share
Speed and Cost: XRP transactions settle within 3–5 seconds and cost less than a cent, compared to SWIFT transfers that can take days and cost $20–$50 per transaction.
Central Bank and Institutional Interest: Several central banks are reportedly studying Ripple’s network alongside SWIFT’s systems in pilot programs, signaling growing institutional acceptance.
Blockchain Integration: Ripple is launching an Ethereum Virtual Machine (EVM)-compatible sidechain on the XRP Ledger, expanding its ecosystem and utility for decentralized applications, which could enhance adoption.
Legal Clarity: Following the SEC’s dismissal of remaining claims against Ripple in mid-2025, XRP’s legal status as not being a security has boosted confidence among investors and institutions.
Potential Impact on XRP Price
Experts suggest that if XRP captures a significant portion of SWIFT’s liquidity layer, its price could rise substantially, potentially reaching three-digit levels in USD.
Current XRP price is around $2.25–$2.92, up over 300% since late 2024, but many analysts believe it remains undervalued relative to its utility and potential market share.
Summary
Aspect Details
SWIFT Daily Volume $5 trillion+ in cross-border payments
Ripple’s Target Market Share Up to 14% within 5 years
XRP’s Role Bridge currency providing instant liquidity
Transaction Speed & Cost 3–5 seconds, <$0.01 vs SWIFT’s days and $20–$50
Institutional Adoption Increasing, with central bank pilots underway
Legal Status SEC claims dismissed; XRP not a security
Price Potential Analysts project possible three-digit USD price
Conclusion
Ripple is positioning XRP as a disruptive alternative to SWIFT’s legacy system, focusing on liquidity and speed rather than just messaging. With growing institutional interest, blockchain innovation, and a clearer legal environment, XRP could capture a meaningful share of global cross-border payments, potentially driving significant price appreciation over the next five years.
#XRP

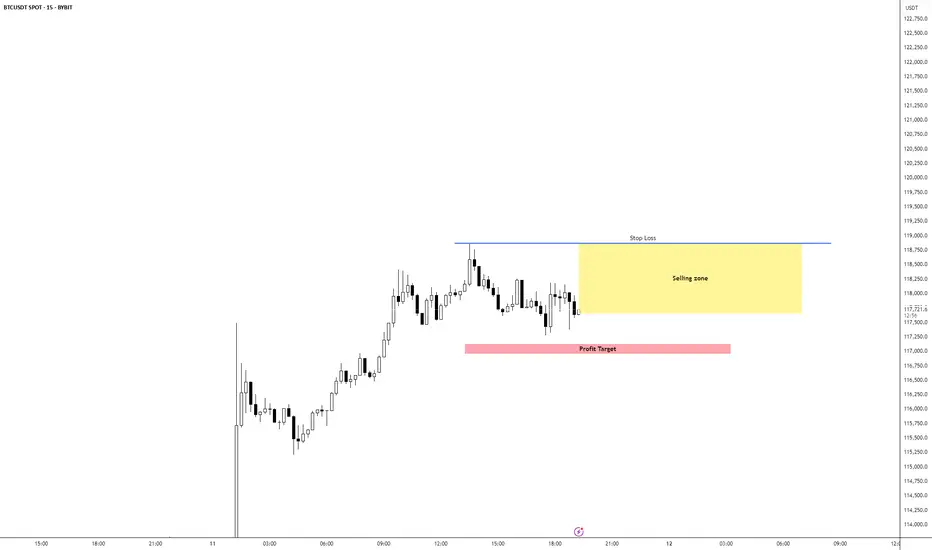
BTC/USD Short IdeaBTC/USD is currently bullish overall but seems overextended, Expecting a pullback to the 5m Equilibrium levels which would be our TP area. 1M has switched bearish adding confluence to our setup.
I would be layering short positions inside the yellow selling zone
Altcoin Season loading?Arbitrum has broken out of the descending wedge, reclaimed the POC and is headed to higher levels. We went long at the breakout and stop loss has been placed at break even.
Not financial advice, do what’s best for you

PORTALUSDT CHART ANALYSİS ISTRADING CRYPTO PROFITABLE?
Crypto trading is profitable but only if done correctly. Follow the
steps, strategies, and tips shared throughout our guide, and you will be
in a better position to make profitable trades. And a golden rule:
Plan your trade, trade your plan.
Never Forget: 90/90/90 trading rule.
90% of traders will lose 90% of their account value within 90
days.
1. No matter how much profit you make; what matters is how
much you keep.
2. No matter how much you keep, what matters is how much you
re-invest.
3. No matter how much you re-invested, what matters is your
total return on investment (ROI).

APT/USDT undervalue !!APT is currently an undervalued project, consolidating in a tight range for over 150 days, signaling significant accumulation. The price is sitting below a key liquidity zone, which has historically acted as a launchpad for major moves. This extended sideways movement hints at suppressed volatility, often preceding explosive breakouts.

PORTAL (SPOT)BINANCE:PORTALUSDT
#PORTAL/ USDT
Entry .0385
SL 4H close below .0354
T1 0.0525
T2 0.0642
_______________________________________________________
Golden Advices.
********************
* collect the coin slowly in the entry range.
* Please calculate your losses before the entry.
* Do not enter any trade you find it not suitable for you.
* No FOMO - No Rush , it is a long journey.

Wyckoff Structure Targets 92K–94K Retest Before Continuation!A rare and highly instructive market structure is currently unfolding, presenting a textbook case of Wyckoff pattern integration across multiple timeframes.
Over the past weeks, I’ve been tracking a series of smaller Wyckoff accumulation and distribution patterns nested within a larger overarching Wyckoff structure. Each of these smaller formations has now successfully completed its expected move — validating the precision of supply/demand mechanics and the theory’s predictive strength.
With these mini-cycles resolved, the spotlight now shifts to the final, dominant Wyckoff structure — a larger accumulation phase that encompasses the full breadth of recent market activity. According to the logic of Phase C transitioning into Phase D, price appears poised to revisit the key retest zone between 92,000 and 94,000, a critical area of prior resistance turned demand.
📉 Current Market Behavior:
📐 Multiple minor Wyckoff patterns (accumulations/distributions) have played out as expected, both upward and downward — lending high credibility to the current macro setup.
🧩 All formations are nested within a major accumulation structure, now in the final phase of testing support.
🔁 The expected move is a pullback toward the 92K–94K zone, before the markup phase resumes with higher conviction.
📊 Wyckoff Confidence Factors:
✅ All Phase C spring and upthrust actions respected
✅ Volume behavior aligns with Wyckoff principles (climactic action → absorption → trend continuation)
✅ Clean reaccumulation signs within current structure
✅ Institutional footprint visible through shakeouts and well-defined support/resistance rotations
💬 Observation / Call to Action:
This setup is a rare opportunity to witness multi-layered Wyckoff theory in motion, offering not only a high-probability trading setup but also an educational blueprint. I invite fellow traders and Wyckoff analysts to share their interpretations or challenge the current thesis.
➡️ Do you see the same structural roadmap?
Let’s discuss in the comments.

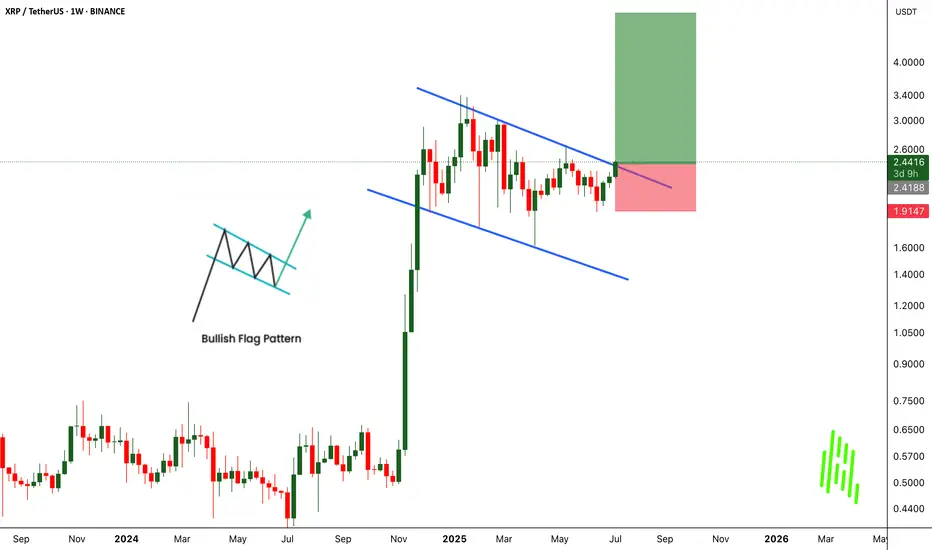
XRPUSDT Breaks Out of Bullish Flag - Big Moves Ahead!BINANCE:XRPUSDT has broken out of a classic bullish flag pattern on the weekly chart, signaling a strong continuation to the upside. This textbook setup is known for its high success rate, and the breakout suggests the potential for significant gains if momentum continues.
The CRYPTOCAP:XRP community remains strong, with long-term holders showing confidence and resilience. With the current market structure and support from loyal investors, there’s a real possibility for the price to double from this breakout zone.
The strategy is simple. Buy and hold for the long term. But as always, traders must manage risk carefully and use a proper stop loss. Let the flag fly high. CRYPTOCAP:XRP could be ready for a major pump from this level.
BINANCE:XRPUSDT Currently trading at $2.43
Buy level : Above $2.4
Stop loss : Below $1.9
Target : $5
Max leverage 3x
Always keep stop loss
Follow Our Tradingview Account for More Technical Analysis Updates, | Like, Share and Comment Your thoughts
Could Cardano become a crypto unicorn?And make a 3rd new all time high in subsequent cycles.
One fib extension certainly suggests that is possible pointing towards around $4.80
Let's see ... things can mover very fast during altseason.

WAVES ON WAY TO $2waves have a high chance to enter a new break to 2 usd, since the last data.
When there is more confirmation, the updates will be below.

BITCOIN ABOUT TO BLOW UP OR TOP NEAR? Read my thoughts below Definitely Bitcoin looks strong compared to the rest of the crypto market.
we have been consolidating on top of the previous all time highs, and that is bullish, now price has broken out from its resistance and strong support remains around 108K area.
If momentum continues, 120K could be strong target, and if broken 135K is next by end of July.
BUT... Predictions is only in our minds, we need to look at Daily, Weekly and Monthly open and closes to determine bullishness or either momentum to the Upside, Distribution or Downside.
The fact that Bitcoin is making new ATH and the media is silent is a good thing.. But right now is trying to break the long top trendline that goes from 2017 top.
To me distribution and consolidation before the last leg makes sense. but nothing really does, markets can remain unpredictable and crazy more than you stay solvent. So if you are trading the move, use stop loss depending on your time horizon and timeframe.. AND DONT TRY TO PREDICT TOPS unless you are going for quick scalps or you might burn your money away.
SOLANA IDEA For solana traders
Price is heading to a daily supply
On the hourly we're seeing a retracement
Confirmation before entry is advised on the M30 Demand
Good luck and happy weekend trading

Hype - Resistance Levels to HigherCurrently you are looking at a rising wedge retest on Hype I
It will now either
1) Reject Here
2) Attempt to avoid having to go the full short target by pumping back up through the wedge.
Main Resistance Points coming up that makes be think we see a wick and through, failure to flip the wedge and back down lower
Daily Resistance / Fib Pivot Points
(Labeled On The Chart)
R3 / R2 / R1 / PP S1/S2/S3
$53.66 / $47.96 / $44.45 / $38.7 / $33.03 / $29.55 / $23.86
Fib 1.6 April Swing Low (TOP TOP) is $59 which likely is explored later t

#BTC Update #6 – July 11, 2025🟠 #BTC Update #6 – July 11, 2025
Bitcoin has surged nearly 9% from the supply zone and is currently trading around the $119,000 level. However, looking at the current volume, the momentum seems to be fading.
If a correction takes place, the potential support zones are:
✨First stop: $114,000
✨Second stop: $113,000
✨Third stop: $111,500
After a pullback, the next target may be around $122,000. However, macroeconomic risks are rising. The U.S. is considering a 500% tariff on Russia imports, and in the past, even a 100% tariff triggered a sharp drop in Bitcoin.
Since BTC has already made a significant move up, I don’t think opening a Long or Short position is wise at the moment. Just observing for now.

#DOGS/USDT Breakout in Play ?#DOGS
The price is moving within a descending channel on the 15-minute frame and is expected to break it and continue upward.
We have a trend to stabilize above the 100 moving average once again.
We have a downtrend on the RSI indicator that supports the upward move with a breakout.
We have a support area at the lower boundary of the channel at 0.0001527, acting as a strong support from which the price can rebound.
We have a major support area in green that pushed the price upward at 0.0001493.
Entry price: 0.0001570.
First target: 0.0001610.
Second target: 0.0001650.
Third target: 0.0001712.
To manage risk, don't forget stop loss and capital management.
When you reach the first target, save some profits and then change the stop order to an entry order.
For inquiries, please comment.
Thank you.

Monero pump to $339 soonJust now went long on monero.
Stop: $321.58
Tp: $339
3RR trade.
Surprisingly the pa on monero right now is slow. I think structurally its at a good low point. It did just break the 1hr HL structure but i think its fakeout. Besides the market will likely correct to make a LH still even if not a fakeout so odds are it will likely push a bit.
Based on the overall market momentum as well with everything pumping I think monero can at least push to $339. It spiked up to that point last week and I think the bulls more than likely will attempt to push it again.
Other than that it aligns with my DTT strategy

HolderStat┆ETHUSD seeks to $3200KUCOIN:ETHUSDT surged after breaking out of a triangle and pushing through multiple resistance levels. The latest move above $2,900 confirms a bullish continuation, with $3,200 as the next major zone. Consolidation below resistance has built the base for the current rally.

LINK Breaks Out of Multi-Month Range – Is $17 Next?Chainlink (LINKUSDT) just broke above a key resistance near $15.30 on the 8H chart, shifting market structure from lower highs into potential uptrend. Momentum is strong, with Stoch RSI deeply overbought, signaling possible short-term cooling before continuation. If LINK holds above $15.30, upside targets include $16.50 and $17.20 based on prior highs.
📊 Watching for a retest and hold of the breakout zone.
#LINK #Chainlink #CryptoBreakout #Altcoins #QuantTradingPro #TradingView
