SOL – Compression at ResistanceAfter retracing up toward the 50% Fib level (around 154.3–154.4 on the daily chart), SOL/USDT has now stalled beneath key resistance and is rolling back into the reaction range. A close look at both the 1D and 2H charts reveals a clear case of a failed swing high rather than a trend reversal.
1. Structural Context
SOL remains inside its broader downtrend channel (green lines). The bounce off the June low carved out a higher low, but the subsequent rally ran into:
The daily descending trendline (red) from the June high
The 50% Fib retracement of the June down-leg (154.3–154.4)
A sell-side order block (red volume bars on the left VPVR)
The daily 20-period SMA and upper Bollinger Band
Because price could not clear these layers, the move shows the characteristics of a lower high inside a downtrend rather than a genuine breakout.
2. Multi-Timeframe Confirmation
Daily (1D) Chart
Retracement: Peaked at 50% Fib then reversed.
Volume Profile: Thick VPVR node at 154–156 acted as a supply shelf.
Bollinger Bands: Upper band contained the rally.
RSI: Pulled back from ~55 and printed a lower high as price challenged 50%.
PVT: Flat, indicating no real net buying during the bounce.
2-Hour (2H) Chart
Trendlines: A shorter-term red downtrend line capped the local rally near 154.
Order Blocks: Green buy-block around 137–140 held the low; red sell-block around 154–157 limited upside.
RSI: Printed a lower high on the second leg up, even as price revisited prior highs.
Volume: Tapered off on the approach into the 50% Fib zone, then increased on the pullback — a sign of distribution.
3. Key Levels & Next Moves
Immediate Support:
152.2–152.5 (38.2% Fib)
151.1–151.9 (23.6% Fib & daily BB midline)
Structural Support Zones:
146.1–144.6 (prior consolidation & lower Bollinger band)
141.5–140.9 (secondary order block)
134.0–137.0 (major demand cluster)
Immediate Resistance:
154.3–154.4 (50% Fib + daily trendline + SMA)
156–158 (78.6–100% Fib band + higher-timeframe supply)
If SOL fails to hold 152.2–152.5, look for a retest of the 146–144 zone. A breach below 144 opens the path back toward the 137–134 order block. Conversely, a sustained reclaim of 154.4 on volume would be needed to shift the short-term bias neutral.
4. Conclusion
This sequence—bounce into 50% Fib, capped by overlapping resistance, followed by divergence in momentum and rising volume on the pullback—confirms another lower high in SOL’s downtrend. Until price can clear 154.4 with conviction, the path of least resistance remains downward.
Crypto market

#ARB Can Long Soon#ARB
The price is moving within a descending channel on the 1-hour frame and is expected to break and continue upward.
We have a trend to stabilize above the 100 moving average once again.
We have a downtrend on the RSI indicator that supports the upward move with a breakout.
We have a support area at the lower boundary of the channel at 0.3190, acting as strong support from which the price can rebound.
We have a major support area in green that pushed the price upward at 0.3180.
Entry price: 0.3200
First target: 0.3297
Second target: 0.3393
Third target: 0.3513
To manage risk, don't forget stop loss and capital management.
When you reach the first target, save some profits and then change your stop order to an entry order.
For inquiries, please comment.
Thank you.

Bitcoin takes a deeper dive on wave 4!The Daily: Dormant Bitcoin wallets wake after 14 years to move billions of dollars in BTC, House GOP declares ‘Crypto Week,’ and more!

HYPE Swing Long – 5.2R Setup on Fib PullbackI’m planning to enter a HYPE swing long on a golden pocket pullback during a bullish structure continuation, with confluence from EMAs, fibs, and demand volume. The setup is based on the daily chart for trend structure and 1-hour chart for entry timing.
My stop is placed below structural invalidation, and I have two profit targets: one conservative (TP1) and one trend-continuation (TP2). I plan to move my stop to breakeven after TP1 is hit in order to protect the trade and let the rest run risk-free.
Entry at $39.20 – Inside the golden pocket (0.618–0.786 fib), where bullish pullbacks often reverse. Confluence with 21 and 50 EMA on the daily and high-volume support just below.
Stop-loss at $37.80 – Below structure and golden pocket. If broken, the setup is invalid and trend may shift.
TP1 at $43.00 – Previous local high and supply zone. Strong resistance and logical partial profit zone. Locks in ~2.7R. I plan to secure partial profits here and move my stop to breakeven.
TP2 at $46.50 – Full fib extension and psychological resistance. If trend continues, this is where momentum likely tops out short term. Gives ~5.2R.

BTC - Bullish retest to ATH?Made a composite profile of that little range we had last week.
We took out the lower npoc, then took out the higher npoc and the internal equal highs (which was the only short I see for now)
I'm looking for 107.2-3 to get a bullish reaction, long from there into a clean-up of the 112k highs.
If the July 2nd lows don't hold, I'd look for the 101k npoc, or maybe a frontrun of that at the imbalance fill around 103k.

Ena to 0.4$?I like it and i like it from here.
Looks like 7th july will be gud
Looks gud and bullish.
Send it .
NFA

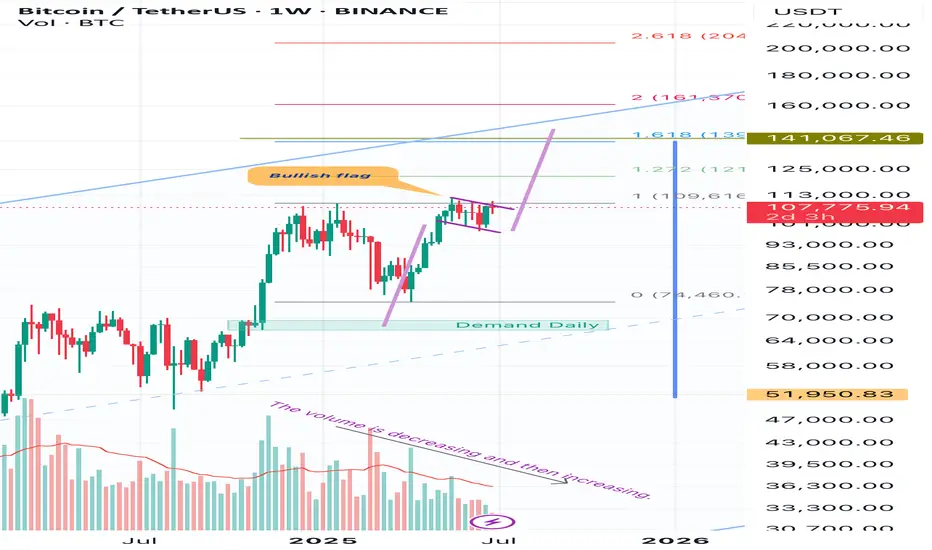
BtcusdtHello friends, in these important days of the markets, I wanted to share an analysis of Bitcoin with you. I think it is in a bullish flag and the target is 136,000 and within reach. It is 140,000. And I think that considering that the volume is decreasing, this indicates that with a sudden increase in volume, it will exit this bullish flag upwards with great intensity and speed.
ETH/USDT – 4H Chart AnalysisEthereum is currently trading within a broad consolidation range between $2,387 (support) and $2,657 (resistance) on the 4H timeframe. After a sharp pullback from range highs, price is retesting the mid-range and Fibonacci levels, offering a potential bullish setup.
Trading Plan:
Buy Stop: $2,501 (confirmation of upward momentum)
Stop Loss: $2,363 (below key support zone)
Take Profit 1 (TP1): $2,657 (range resistance)
Take Profit 2 (TP2): $2,853 (projected breakout target
) Key Levels to Watch:
Support Zone: $2,387 – $2,363
Resistance Zone: $2,657 – $2,853
Fib Retracements: 38.2% @ $2,554 & 61.8% @ $2,472
📊 Bias: Bullish above $2,501, caution if price dips below $2,363.
RSI is hovering near 44, suggesting neutral momentum with potential room for upside if buying pressure increases.

ETH BEARISH AT RESISTANCE ETH rejecting daily resistance, likely price will look to find supports at zones marked below
DYOR

BTC Bearish at 1DBTC printing bearish engulfing candlestick pattern on 1D, rejecting previous resistance
we are likely going to see price test 98k, 92k and worst scenario 86k
DYOR

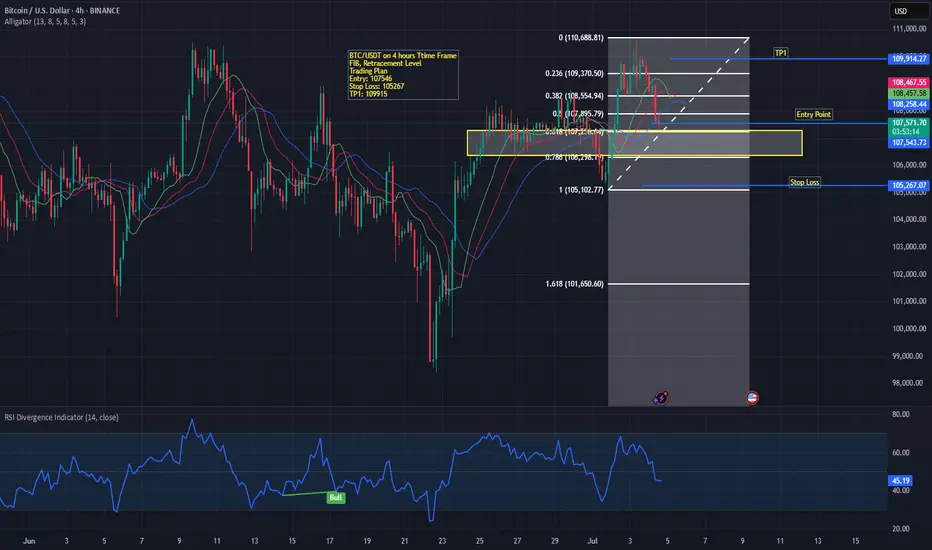
BTC/USDT on FIB Retracement LevelsThe price is currently retracing after a recent upward move and is testing the 38.2% Fibonacci level (≈107,805).
The entry zone is defined around 107,546, marked in yellow, suggesting a possible support area where buyers may step in.
The stop loss is placed slightly below at 105,267, around the 78.6% Fibonacci retracement level, to manage risk if the market breaks this zone.
The take-profit (TP1) target is set near 109,867, close to the previous high and aligning with the 0.236 Fib level (≈109,370).
📉 Indicators & Patterns
EMAs are converging, with price slightly under them, showing possible weakness but not a confirmed downtrend yet.
RSI (Relative Strength Index) at the bottom is around 45, signaling neutral momentum—neither overbought nor oversold.
A bullish divergence was marked earlier on RSI, which supported the previous price rise.
📈 Trading Plan Summary
Entry: 107,546
Stop Loss: 105,267
TP1: 109,867
Bias: Watching for a bullish reversal from the yellow support zone.
If price fails to hold above 106,296, it may head toward 105,102 and the 1.618 Fib extension (101,650).
This setup suggests a high-risk, reward potential if price bounces in the support zone, but caution is advised as RSI and EMAs currently show mixed signals.
All this just before Fedwire implements ISO20022?#bitcoin #btc price attempted a breakout but today failed with dumps. There "may" be other attempts but while ISO20022 subject is approaching, isn' t it wise to think about #xrp and other ISO20022 licenced coins will overperform the others (BTC, ETH, SOL and all other non iso certified coins) in near future? Not financial advice.

Bitcoin Cash Rebounds from VWAP-Backed SupportBitcoin Cash eased from $528.3 to $469.8, finding support backed by the anchored VWAP and ascending trendline. BCH trades at $485.0, with Stochastic at 17.0 signaling oversold conditions.
A bullish wave may emerge if $469.8 holds, targeting $500.0 and $515.2.

Bitcoin [BTC1!] Draw and Bias. 05.07.25, SaturdayLooking for bullish action on BTC. No stance on alts.

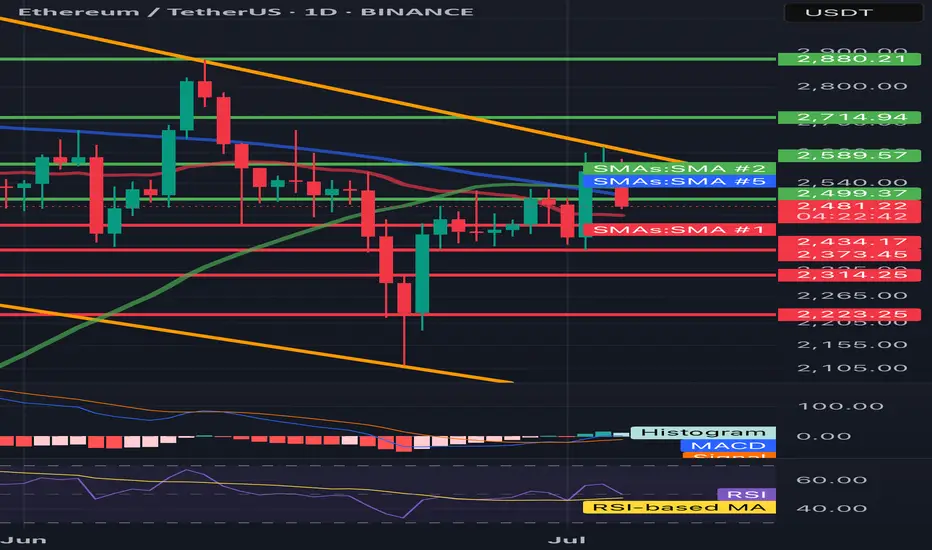
ETH/USDT 1D🔍 ETH/USDT - technical analysis (1D interval):
📉 Price: 2478 USDT (-4.36%)
🔧 Resistance:
• SMA 200 (green): ~ 2589
• Resistance zone: ~ 2715 → 2880 USDT
• SMA 100 (blue): ~ 2500 (just rejected)
🔧 Support:
• SMA 50 (red): ~ 2434 - currently tested
• Strong support: 2373, 2314, 2223 USDT
📊 indicators:
• MacD: freshly intersected, but the momentum is weakening
• RSI: ~ 45 - neutral/weak, under 50 (no bull strength)
• Trend: Still in the downward channel (yellow trend lines)
⸻
⚠️ Conclusions:
• Price rejected from 2500 (SMA 100) and flies down.
• If 2434 falls, a further discount is possible to 2373–2314.
• Lack of bulls with key resistance - the inheritance scenario dominates.
• Watch behavior at 2434 - this is now a key level.
PENGU's RSI Signals Possible Pullback AheadPENGU may be at risk of a short-term correction as buying pressure cools off. The RSI currently sits at above 70, placing the altcoin firmly in overbought territory.
RSI values above 70 typically signals unsustainable momentum and hints at an upcoming pullback or consolidation phase.
Trader are advised to watch for weakening momentum as buyers become exhausted. Once selloffs commence, the token's price could fall to $0.0037.
On the other hand, if demand swells, the meme coin's price could reach $0.018.

TAIKO/USDT NEW INCREASE VIEWThe latest data shows that this coin is entering a new uptrend, which can be confirmed in the coming time frames, see the last update.
In trading, it's about building a real, confirmed trend, starting with building and holding levels.
The keys are: Start of a new cycle, start of new smart money
This coin is at the first level of scan, and time frames should confirm if it's an interesting coin or not. Until now, there is no confirmation; only the first scan shows it can be interesting.
* This coin is a high-risk coin.

Bitcoin will Bearish conformed Structureon Thursday Bitcoin Price briefly reclaimed at 110K this morning as macro tailwinds and institutional flows lifted crypto but analysis say clear catalyst is still needed to break all time high after the long impulsive rally earlier in the year.
BTC has been trading with in descending channel on the daily time frame looking after the Long time price will needs break and catch there Support 105K Level if the price stays below more then could next zone formed 102K
You may find more details in the chart i need support from you Guys And feel free to share your thoughts other views in the comments.

BTCUSD Daily TF Bull FlagThe daily timeframe bullish flag is a strong indication that the market is preparing for another bull run. The target for this will be around $140k - slightly higher.
I am anticipating a minor pullback to either one of the daily demand zones - (most likely the highest one) before the bulls take over.

PLUME/USDTKey Level Zone: 0.1030 - 0.1060
LMT v2.0 detected.
The setup looks promising—price previously trended upward with rising volume and momentum, then retested this zone cleanly. This presents an excellent reward-to-risk opportunity if momentum continues to align.
Introducing LMT (Levels & Momentum Trading)
- Over the past 3 years, I’ve refined my approach to focus more sharply on the single most important element in any trade: the KEY LEVEL.
- While HMT (High Momentum Trading) served me well—combining trend, momentum, volume, and structure across multiple timeframes—I realized that consistently identifying and respecting these critical price zones is what truly separates good trades from great ones.
- That insight led to the evolution of HMT into LMT – Levels & Momentum Trading.
Why the Change? (From HMT to LMT)
Switching from High Momentum Trading (HMT) to Levels & Momentum Trading (LMT) improves precision, risk control, and confidence by:
- Clearer Entries & Stops: Defined key levels make it easier to plan entries, stop-losses, and position sizing—no more guesswork.
- Better Signal Quality: Momentum is now always checked against a support or resistance zone—if it aligns, it's a stronger setup.
- Improved Reward-to-Risk: All trades are anchored to key levels, making it easier to calculate and manage risk effectively.
- Stronger Confidence: With clear invalidation points beyond key levels, it's easier to trust the plan and stay disciplined—even in tough markets.
Whenever I share a signal, it’s because:
- A high‐probability key level has been identified on a higher timeframe.
- Lower‐timeframe momentum, market structure and volume suggest continuation or reversal is imminent.
- The reward‐to‐risk (based on that key level) meets my criteria for a disciplined entry.
***Please note that conducting a comprehensive analysis on a single timeframe chart can be quite challenging and sometimes confusing. I appreciate your understanding of the effort involved.
Important Note: The Role of Key Levels
- Holding a key level zone: If price respects the key level zone, momentum often carries the trend in the expected direction. That’s when we look to enter, with stop-loss placed just beyond the zone with some buffer.
- Breaking a key level zone: A definitive break signals a potential stop‐out for trend traders. For reversal traders, it’s a cue to consider switching direction—price often retests broken zones as new support or resistance.
My Trading Rules (Unchanged)
Risk Management
- Maximum risk per trade: 2.5%
- Leverage: 5x
Exit Strategy / Profit Taking
- Sell at least 70% on the 3rd wave up (LTF Wave 5).
- Typically sell 50% during a high‐volume spike.
- Move stop‐loss to breakeven once the trade achieves a 1.5:1 R:R.
- Exit at breakeven if momentum fades or divergence appears.
The market is highly dynamic and constantly changing. LMT signals and target profit (TP) levels are based on the current price and movement, but market conditions can shift instantly, so it is crucial to remain adaptable and follow the market's movement.
If you find this signal/analysis meaningful, kindly like and share it.
Thank you for your support~
Sharing this with love!
From HMT to LMT: A Brief Version History
HM Signal :
Date: 17/08/2023
- Early concept identifying high momentum pullbacks within strong uptrends
- Triggered after a prior wave up with rising volume and momentum
- Focused on healthy retracements into support for optimal reward-to-risk setups
HMT v1.0:
Date: 18/10/2024
- Initial release of the High Momentum Trading framework
- Combined multi-timeframe trend, volume, and momentum analysis.
- Focused on identifying strong trending moves high momentum
HMT v2.0:
Date: 17/12/2024
- Major update to the Momentum indicator
- Reduced false signals from inaccurate momentum detection
- New screener with improved accuracy and fewer signals
HMT v3.0:
Date: 23/12/2024
- Added liquidity factor to enhance trend continuation
- Improved potential for momentum-based plays
- Increased winning probability by reducing entries during peaks
HMT v3.1:
Date: 31/12/2024
- Enhanced entry confirmation for improved reward-to-risk ratios
HMT v4.0:
Date: 05/01/2025
- Incorporated buying and selling pressure in lower timeframes to enhance the probability of trending moves while optimizing entry timing and scaling
HMT v4.1:
Date: 06/01/2025
- Enhanced take-profit (TP) target by incorporating market structure analysis
HMT v5 :
Date: 23/01/2025
- Refined wave analysis for trending conditions
- Incorporated lower timeframe (LTF) momentum to strengthen trend reliability
- Re-aligned and re-balanced entry conditions for improved accuracy
HMT v6 :
Date : 15/02/2025
- Integrated strong accumulation activity into in-depth wave analysis
HMT v7 :
Date : 20/03/2025
- Refined wave analysis along with accumulation and market sentiment
HMT v8 :
Date : 16/04/2025
- Fully restructured strategy logic
HMT v8.1 :
Date : 18/04/2025
- Refined Take Profit (TP) logic to be more conservative for improved win consistency
LMT v1.0 :
Date : 06/06/2025
- Rebranded to emphasize key levels + momentum as the core framework
LMT v2.0
Date: 11/06/2025

ETH could be about to rip into a short-term rallyWhile the stock market has seen surprising upside in the past weeks (presumably due to pricing in rate cuts / a more positive liquidity picture / high expectations for Q2), crypto has lagged behind. I don't believe anything significantly above current prices - no matter in which market - is sustainable for now, but we can certainly milk it for whatever it's worth.
Notably, BTC has shown way more resilience and dominance in the current cycle so far. This makes sense in a high interest environment. However, within the bias of the markets pricing in expectations for rate cuts and as such more liquidity, we could also assume that demand for assets other than "safe havens" would now increase as well, leading us to the biased conclusion that we could see altcoins wildly outperforming BTC over the next weeks.
Indeed, if we look at the BTC chart, technicals such as VWAP stddevs show significantly less potential for upside if compared to ETH in the current moment in time. We therefore would focus on ETH at this point (as money flow seems to cycle BTC->ETH->Others).
PLEASE NOTE: SL and TP are not accurate. This is not a precise trading idea. Please use your own judgement in accordance with your trading style.

BTC Maintained Bullish Structure Above Key SMAsAs of now, the trend remains bullish, with $112,000–$115,000 as the next levels to watch. If those break, the $124,000 inverse H&S target is in play.

