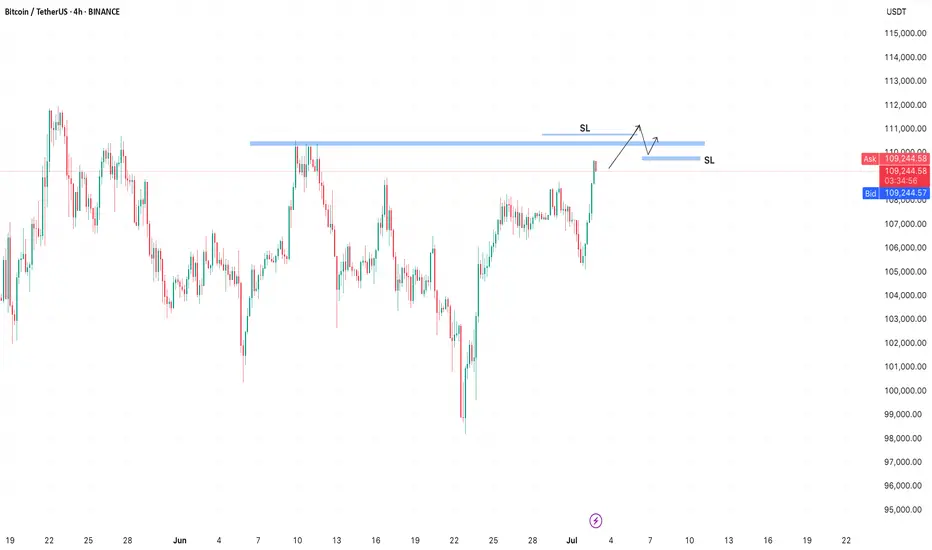
BTC is approaching a strong zone!BTC has a strong zone around 110,500 where a large number of orders are stacked.
In crypto, it’s common for stop losses to be taken on both sides.
After a breakout above the zone, short sellers get liquidated, while buyers enter the market — only to be stopped out by a false breakout when the price drops below the zone to trigger their stops.
Crypto market
XRP 4H TIMEFRAME ANALYSISXRPUSDT strcuture shifted into bullish after CHoCH, Thats why I have marked OB+FVG as POI for long.

SOLUSDT Bullish Flag Pattern!Price has formed a Bullish Flag pattern on the daily timeframe. After multiple touches of both support and resistance, the price has now broken out above the falg resistance, signaling a potential trend reversal. and price trading above 50 and 100 EMA
Currently, SOL is bouncing from the channel breakout level, indicating strong bullish momentum. A clean breakout candle confirms buying interest, and the setup favors a strong bullish continuation if the breakout sustains.
Entry: Above $150
Stop-loss: Below $135
CRYPTOCAP:SOL TRADENATION:SOLANA

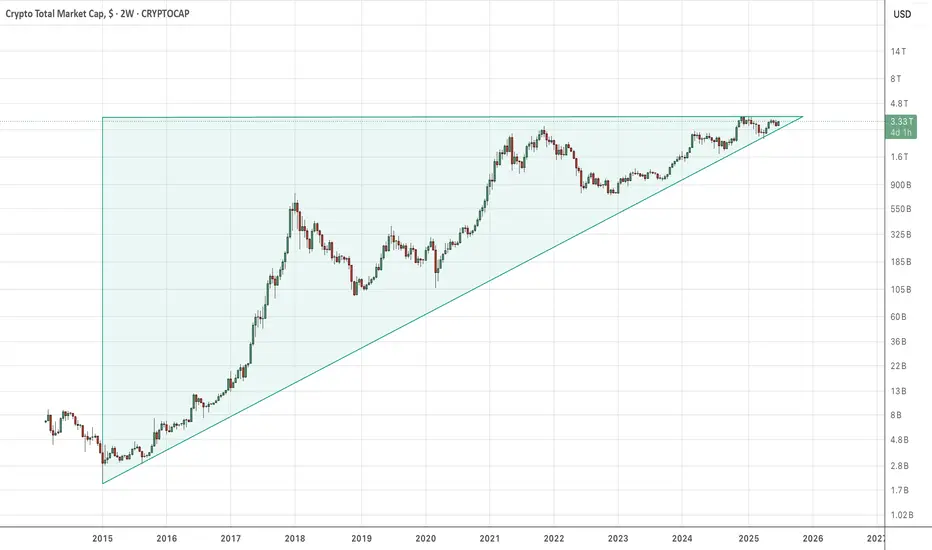
Total Crypto MarketcapHi ladies.
Is it "diminishing log returns" or ascending triangle? We're going to find out soon. I think there are too many data pieces coming in that point to BTC $1M.
Miners like RIOT and MARA are touting reaching their "BTC Reserve" targets. What it means is Bitcoin is no longer for sale. The only theoretical limit to BTC price is amount of fiat in the system, because it's designed to absorb it all. But keep talking about diminishing log returns, because you sound foo-lish.
DOTUSDT is BullishPrice was in a strong downtrend, however the breakout from the descending channel hints a potential reversal. If a proper higher high is defined followed by a higher low then we can expect a bullish reversal as per Dow theory. Targets are mentioned on the chart.

XRP is about to break out again, on its way to our $10 target.XRP is finally breaking out of consolidation — momentum is building towards our first major target at $10!
🎯 Target 1: $10
🎯 Target 2: $15–$20
Let’s go! 🚀 Good luck, everyone!

ETH could be about to rip into a short-term rallyWhile the stock market has seen surprising upside in the past weeks (presumably due to pricing in rate cuts / a more positive liquidity picture / high expectations for Q2), crypto has lagged behind. I don't believe anything significantly above current prices - no matter in which market - is sustainable for now, but we can certainly milk it for whatever it's worth.
Notably, BTC has shown way more resilience and dominance in the current cycle so far. This makes sense in a high interest environment. However, within the bias of the markets pricing in expectations for rate cuts and as such more liquidity, we could also assume that demand for assets other than "safe havens" would now increase as well, leading us to the biased conclusion that we could see altcoins wildly outperforming BTC over the next weeks.
Indeed, if we look at the BTC chart, technicals such as VWAP stddevs show significantly less potential for upside if compared to ETH in the current moment in time. We therefore would focus on ETH at this point (as money flow seems to cycle BTC->ETH->Others).
PLEASE NOTE: SL and TP are not accurate. This is not a precise trading idea. Please use your own judgement in accordance with your trading style.

BTC Looking To Break Above Resistance Of Bull-FlagBTC showed a strong move off support at 100310 that is now looking to break above resistance of the bull-flag, which will signal the end of the decline. A daily break above 106800 is confirmation of the uptrend continuation, which should target ATH in the first instance. Following a pullback, BTC should then make its way to new highs, with a first target at 138000, which is a 100% extension from 74500, with a bull-flag mid-point.
Trades
Long on a break above the descending resistance (close on the 30min chart)
Add to long position on a break above 106800
Reduce position size at 112000, to allow for a brief pullback or potential consolidation at ATH
Return to 100% allocation on a solid close above 112000 or a pullback to 106800

DeGRAM | BTCUSD once again trading above $105k📊 Technical Analysis
● Fresh bounce off the confluence of the 8-month up-sloping purple trend-line and 102-103 k green demand box prints a higher-low inside the rising wedge, keeping bulls in control despite June’s pull-back.
● Price is reclaiming the minor down-trend line from the 12 Jun high; a daily close above 106 k confirms a bear-trap and unlocks the 111.8-112.5 k supply at the wedge cap.
💡 Fundamental Analysis
● Spot-ETF desks absorbed >5 400 BTC in the last three sessions while exchange reserves fell to a four-year low, signalling supply drain.
● Cooling US PCE expectations trimmed real yields, and Mt Gox repayment delays ease overhang fears—both supportive for risk assets.
✨ Summary
Long 102–104 k; hold above 106 k targets 111.8 k → 115 k. Bull thesis void on a 16 h close below 99 k.
-------------------
Share your opinion in the comments and support the idea with a like. Thanks for your support!

BTC Setup: 2.7 R:R"Bitcoin Poised for New Uptrend After Bull Flag Breakout Retest"
Bitcoin appears ready to begin a new uptrend after successfully retesting the breakout from a bull flag pattern and completing consolidation above key support.
This setup offers a 2.7:1 risk-to-reward ratio, with the following trade parameters:
Entry: $109,965.79
Stop Loss: $106,300
Target: $120,000
BTC Leg2 115KBINANCE:BTCUSDT major movement from base 98K S to 106K $.BTC want to next movement to 115K $ but in middle of way 110K $ level there are sellers.
Support: 106.000 - 102.000
Resistance: 110.400 - 115.000
⚠️Control Risk Management

BTC UP OR NO📈 Bitcoin to Reach $113K, With a Breakout Path to $120K – A Professional Outlook
After analyzing the macro trend, technical structure, market sentiment, and on-chain behavior, I strongly believe that Bitcoin is on a clear trajectory toward $113,000, with a potential extension to $120,000 if key resistance is broken.
---
🔍 1. Technical Analysis Perspective
Macro Bullish Structure: Since the 2022 bear market bottom, Bitcoin has maintained a consistent higher highs and higher lows pattern, confirming a long-term uptrend.
Fibonacci Extension: The 1.618 Fibonacci extension from the $15.5K bottom to the $69K peak gives a projected target of around $113K.
Historical Fractal Patterns: In previous cycles, Bitcoin has always broken past previous all-time highs by 1.5x to 1.75x, placing this cycle's peak in the $110K–$120K range.
Ascending Triangle Breakout: On the weekly chart, BTC is forming a bullish ascending triangle with the top resistance at ~$73K. A confirmed breakout targets $113K as the next major supply zone.
---
🧠 2. Market Psychology & Cycle Timing
Halving Effect: Historically, Bitcoin peaks occur 9–12 months post-halving. The most recent halving was in April 2024, aligning a potential peak by Q1 or Q2 of 2025.
Psychological Resistance Zones: The $100K–$113K range is not only a Fibonacci target but also a powerful psychological barrier. Once breached, FOMO and institutional momentum could push BTC rapidly to $120K.
Retail vs Institutional Flows: Data shows increased ETF inflows and long-term holder accumulation — a classic pre-peak indicator.
---
🔗 3. On-Chain and Whale Behavior
Realized Price vs Market Price: BTC market price is well above long-term holder realized price, signaling bull market phase 2 (the steep climb).
Dormant Supply: Over 70% of BTC has not moved in 6+ months, showing strong holder conviction. This reduces sell pressure as price increases.
Whale Accumulation Zones: Whales are heavily positioned around $60K–$65K, and there is minimal sell volume above $100K on major exchanges, opening the path to $113K with low resistance.
---
🚀 Conclusion:
> Based on comprehensive technical patterns, market structure, psychological phases, and on-chain behavior, Bitcoin is highly likely to reach $113,000.
If momentum continues and $113K is breached with volume confirmation, a sharp move toward $120,000 becomes not only possible — but likely.

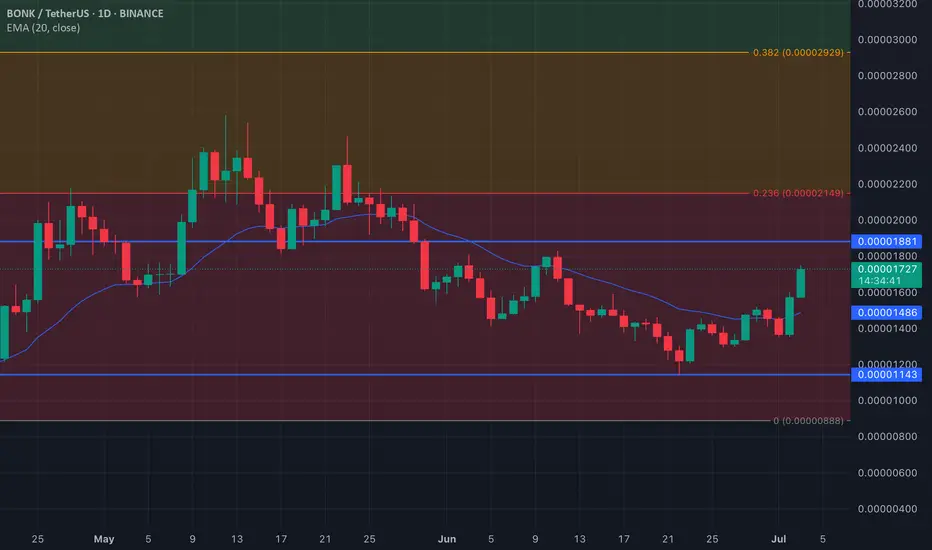
BONK Price Climbs Above 20-Day EMABONK has broken above its 20-day Exponential Moving Average (EMA), now acting as dynamic support at $0.000014. This move indicates short-term bullish momentum, as trading above the 20-day EMA typically suggests increased buying pressure.
If bulls maintain control, BONK could rally toward the $0.0000184 resistance level.
However, a drop in demand could invalidate the uptrend, with downside targets around $0.0000114.
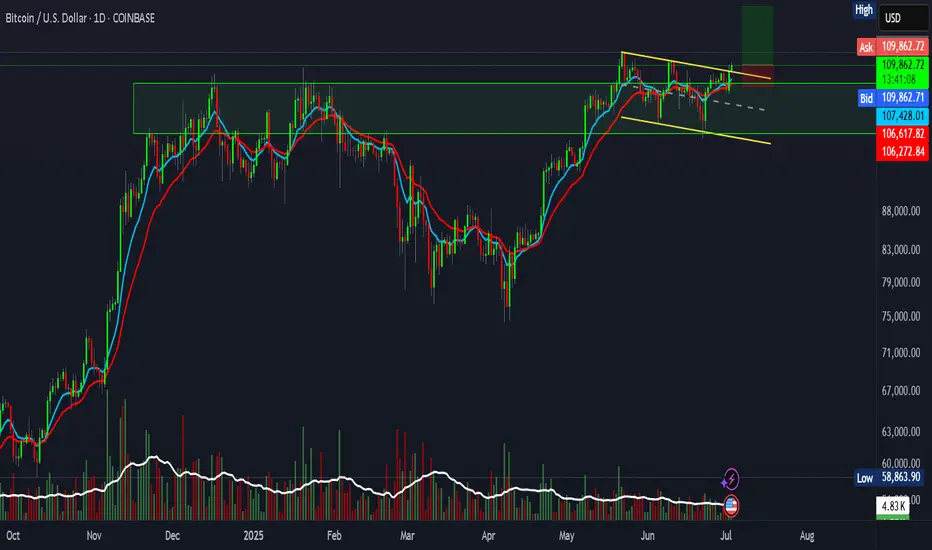
Bitcoin Awaits Breakout Above $114K🪙 Current Price: ~$109,500
📈 Trend: Bullish but facing strong resistance at $114,000
📉 Support: $106,000–$107,000
📌 Outlook: Breakout above $114K could lead to $130K+. Otherwise, possible pullback to $106K.
📊 Key Drivers: ETF inflows, Fed rate cut expectations, weak USD.
💡 Strategy:
🔺 Buy: $107,000 – $107,500 → TP $114,000 | SL $106,000
🔻 Sell (take profit): $114,000 – $115,000 → SL if closes below $112,000

WIF will now say Uff!WIF and FART had same patterns but just have got out of the phase on conjunction, little steep moves to the tops then it starts to mend down, observe for momentum and then take a play

FART _ You dont realise he farts on us? All day?If you look at this Farts - Comes two perspective here - One - This is retracement, i.e it took all sellers wrecked - took buyers on top and would break the skyblue line and eventually come to the red one - But the fact is - if we see another prespective - We see it can just go up at 1.26 also -- For me I would follow this what I have learnt, And am pretty sure it would retrace back the red box as well in full

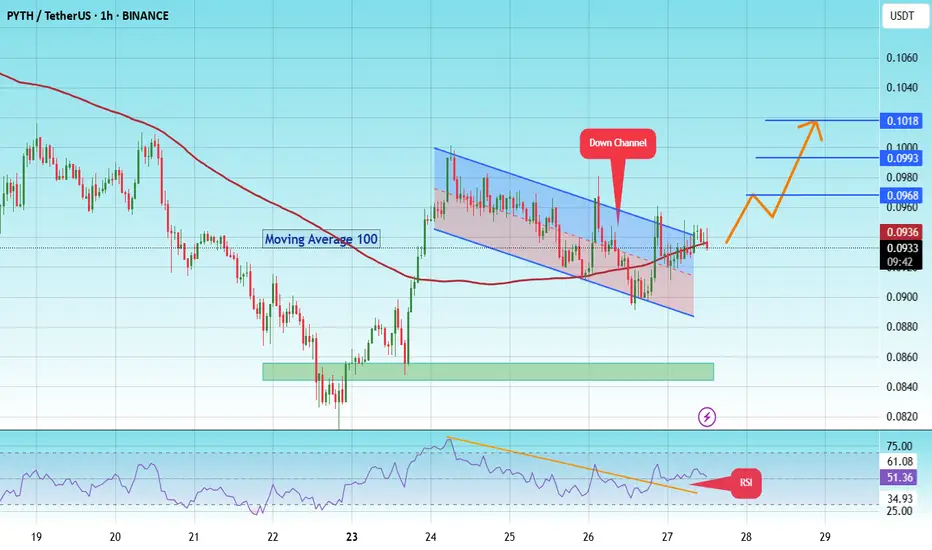
Pyth pump to $0.1018 soon! #PYTH
The price is moving within a descending channel on the 1-hour frame and is expected to break and continue upward.
We have a trend to stabilize above the 100 moving average once again.
We have a downtrend on the RSI indicator that supports the upward break.
We have a support area at the lower boundary of the channel at 0.0895, acting as strong support from which the price can rebound.
We have a major support area in green that pushed the price upward at 0.085.
Entry price: 0.0936
First target: 0.0968
Second target: 0.0993
Third target: 0.1018
To manage risk, don't forget stop loss and capital management.
When you reach the first target, save some profits and then change the stop order to an entry order.
For inquiries, please comment.
Thank you.
SANDUSDT Forming Bullish ReversalSANDUSDT is showing a promising technical setup that could attract more attention in the coming days. The chart clearly highlights a well-defined downward channel which many traders recognize as a potential bullish reversal zone, similar to a falling wedge pattern. The good trading volume adds more conviction to this setup, indicating that larger market participants may already be accumulating positions before a breakout. A projected gain of 70% to 80%+ could be realistic if this breakout plays out as expected, making it an exciting watch for swing traders and investors.
The Sandbox (SAND) project has been a popular topic in the crypto community thanks to its role in the metaverse and NFT ecosystems. With the broader market showing signs of recovery and investors regaining confidence, altcoins with strong fundamentals and favorable technical structures like SANDUSDT could outperform. Traders will want to monitor key resistance levels along the descending trendline for confirmation of a breakout, while also keeping an eye on rising volume to validate momentum.
Community sentiment and on-chain data suggest that interest in SAND is steadily picking up again. This aligns perfectly with the technical picture, offering a solid blend of narrative and chart strength. As more traders and investors look for the next big mover, SANDUSDT could easily become a standout performer if this pattern confirms. Always manage risk properly and watch for any signs of rejection to adjust your strategy accordingly.
✅ Show your support by hitting the like button and
✅ Leaving a comment below! (What is You opinion about this Coin)
Your feedback and engagement keep me inspired to share more insightful market analysis with you!

ETH/BTC At 50 MA ResistanceEthereum is battling the daily 50 MA on the ETH/BTC chart, a key area of resistance. If it beaks above, we could see a nice altcoin rally and Ethereum outperforming. If it gets rejected… more of the same.

BTCUSDT daily analysisia have shared one hour timeframe analysis and this is daily timeframe and i am following priceaction candle and volume with SMC and more my own personal and private strategies

TRBUSDT Setup – Staggered Exits, Smart Profits📌 Entry: 36.70
🎯 TP1: +10% → Secure 50% of position
🛡️ Move to risk-free after TP1 to protect capital
🎯 TP2: Take 50% of remaining volume
🎯 TP3: Close all remaining volume
Calculated exits. Risk-managed. Momentum-ready.

#DOGS/USDT#DOGS
The price is moving within a descending channel on the 1-hour frame and is expected to break and continue upward.
We have a trend to stabilize above the 100 moving average once again.
We have a downtrend on the RSI indicator that supports the upward move with a breakout.
We have a support area at the lower limit of the channel at 0.0001230, acting as strong support from which the price can rebound.
Entry price: 0.0001261
First target: 0.0001286
Second target: 0.0001314
Third target: 0.0001352

$FET Breakout Targeting 41% GainNYSE:FET has broken out of its descending channel on the 8H chart with strong momentum.
If it holds above the breakout zone $0.66–$0.68, we could see a move toward $0.92, a potential 41% upside.
Watch for a successful retest to confirm the breakout.
DYRO, NFA
