#CGPT/USDT 10 % Summer ?#CGPT
The price is moving within a descending channel on the 1-hour frame, adhering well to it, and is on its way to breaking it strongly upwards and retesting it.
We have a bounce from the lower boundary of the descending channel, this support at 0.08870.
We have a downtrend on the RSI that is about to be broken and retested, supporting the upside.
There is a key support area (in green) at 0.08630, which represents a strong basis for the upside.
Don't forget one simple thing: ease and capital.
When you reach the first target, save some money and then change your stop-loss order to an entry order.
For inquiries, please leave a comment.
We have a trend of stability above the Moving Average 100.
Entry price: 0.09450
First target: 0.09644
Second target: 0.09930
Third target: 0.10266
Don't forget one simple thing: ease and capital.
When you reach the first target, save some money and then change your stop-loss order to an entry order.
For inquiries, please leave a comment.
Thank you.
Crypto market

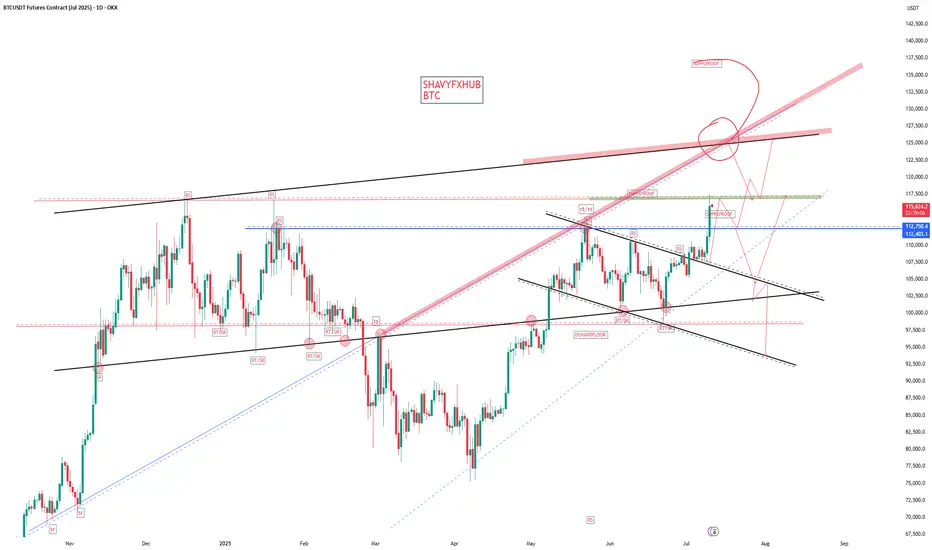
BITCOIN =140-150kThe X-wave has formed in the form of a neutral triangle pattern, and eventually Bitcoin could once again touch $106,000 and move towards $140,000-150,000 with the completion of wave-e.
Good luck
NEoWave Chart

BTC BULLS IS IN CONTROL Bitcoin holds strong in its bullish sentiment, securing a fresh high at 111K.
With momentum on its side, a new projection toward 120K is now firmly in play — the bullish trajectory stays intact. 📈
Momentum traders, stay alert. This leg might just be getting started. follow for more insights , comment and boost idea .

#DYM/USDT#DYM
The price is moving within a descending channel on the 1-hour frame, adhering well to it, and is heading for a strong breakout and retest.
We are seeing a bounce from the lower boundary of the descending channel, which is support at 0.2729.
We have a downtrend on the RSI indicator that is about to be broken and retested, supporting the upward trend.
We are looking for stability above the 100 Moving Average.
Entry price: 0.3390
First target: 0.3056
Second target: 0.3210
Third target: 0.3390

#DYM/USDT#DYM
The price is moving within a descending channel on the 1-hour frame, adhering well to it, and is heading toward a strong breakout and retest.
We are experiencing a rebound from the lower boundary of the descending channel. This support is at 0.2480.
We are experiencing a downtrend on the RSI indicator, which is about to break and retest, supporting the upward trend.
We are heading toward stability above the 100 Moving Average.
Entry price: 0.2537
First target: 0.2640
Second target: 0.2713
Third target: 0.2800

HolderStat┆BNBUSD breakoutBINANCE:BNBUSDT has reclaimed $670 support after breaking out from a long-term falling wedge. The bounce has been strong, and the rising structure now targets the $735–$740 resistance zone. Price action confirms bullish intent with consolidation beneath resistance before breakout.

#WLD/USDT#WLD
The price is moving within a descending channel on the 1-hour frame, adhering well to it, and is heading towards a strong breakout and retest.
We are experiencing a rebound from the lower boundary of the descending channel, which is support at 0.950.
We are experiencing a downtrend on the RSI indicator that is about to be broken and retested, supporting the upward trend.
We are looking for stability above the 100 moving average.
Entry price: 1.20
First target: 1.04
Second target: 1.07
Third target: 1.10

JASMY to 0.036$ in March 2024?we now are having a major breakout of the major resistance that stands near 0.012$, having previously smashed through all the resistances after accumulation is done, we now after 600 days are in a zone of comfort bulls here.

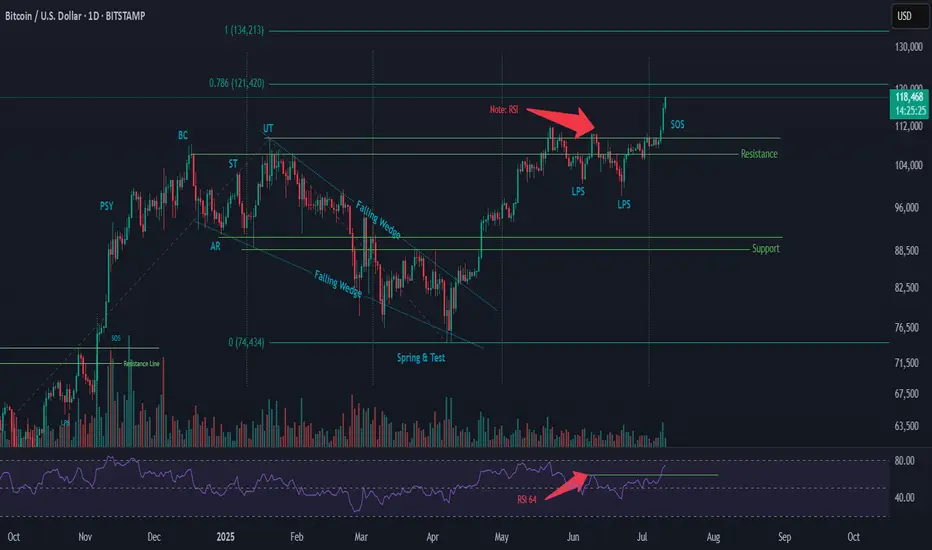
Wyckoff Re-Accumulation (Phase 2) – BTC Market Structure AnalysiThis is an updated outlook on BTC’s current price structure based on Wyckoff methodology.
🔹 Structure Overview:
BTC has broken out above its previous resistance and reached a new ATH. Based on current price action and volume behavior, I believe we are at the Sign of Strength (SOS) phase in a Wyckoff Re-Accumulation Phase 2.
Key Wyckoff Labels in this structure:
PSY – Preliminary Supply
BC – Buying Climax
AR – Automatic Rally
ST – Secondary Test
UT – Upthrust
LPS – Last Point of Support
SOS – Sign of Strength
(For those unfamiliar with the terms, I suggest looking up the Wyckoff Method for detailed definitions.)
The breakout is happening with volume support, and we’ll need to observe how sustained the demand is.
🔹 RSI Observation:
In June, RSI pivoted at 64, and has now reached 73
Both price and RSI are printing higher highs
Daily RSI has not yet reached overbought territory (80+)
If RSI crosses above 80 and then rolls over, it could signal a bearish divergence → followed by a retracement
🔹 Possible Scenarios (3 Outcomes I’m Watching):
📈 Another Re-Accumulation Phase forms after this move
🧊 Market tops out at ATH and enters a Distribution Phase
🚀 A parabolic move (Blow-off Top) happens, followed by a sharp crash and Distribution
🔹 My Personal Trading Plan:
As price enters the next phase, I’ll be watching closely for signs of PSY and BC (Preliminary Supply & Buying Climax). If bearish divergence aligns with these, it may indicate an upcoming retracement.
Once BC forms, I expect an AR (Automatic Reaction) to follow
I’ll look for short entries during the retracement
A Trading Range could form between the BC (resistance) and AR (support)
⚠️ Be cautious of fakeouts, especially during breakout attempts at the range boundaries.
🔹 Price Projection (Fibonacci Extension – For Reference Only):
Using Fibonacci Extension based on the following price coordinates:
Point A: 49,577
Point B: 109,356
Point C: 74,434
🎯 Target Zones:
0.786 extension → 121,420
1.000 extension → 134,213
Again, these are not predictions — just reference points based on market structure.
🔹 Final Note:
This analysis reflects my personal interpretation of the current market structure. Price action can change rapidly based on macro and technical factors. Patterns and phase transitions may take days or even weeks to fully develop.
Feel free to share your thoughts, criticisms, or alternate views — I’m open to feedback from fellow traders.
#Wyckoff #BTC #Bitcoin #CryptoTA #Reaccumulation #TradingPlan #TechnicalAnalysis #RSI #FibExtension #MarketStructure
BTC - I made this chart in early 2021Shocking to login in to Trading View after 4 years to see this chart saved and how well the fib targets and channel is playing out.

SUI - SUI SUI in your ears!Hellooo so SUII moves are marked till the blue line - as stated but beyond it if it goes just in case, you know the path

BTC/USD 30MCHART PATTERNThis chart shows the price action of Bitcoin (BTC/USD) on a 30-minute timeframe, with a variety of session-specific high and low labels and possible trade setup zones. Here's a breakdown of the key components and what they indicate:
---
1. Timeframe & Instrument
Instrument: Bitcoin vs. U.S. Dollar (BTC/USD)
Timeframe: 30-minute candles
Exchange: Bitstamp
Date Range: July 8–11, 2025
---
2. Session Labels
The chart includes key session high/low markers which are common in institutional trading analysis:
NYAM.H / NYAM.L: New York AM session High/Low
NYPM.H / NYPM.L: New York PM session High/Low
AS.H / AS.L: Asia session High/Low
LO.H / LO.L: London Open High/Low
NYL.H / NYL.L: New York Lunch High/Low
These session levels are often used to identify liquidity pools or areas where price might react due to prior institutional activity.
---
3. Trade Setup Zones
Orange box (top): Likely a sell-side liquidity or resistance zone, possibly a target for a long trade.
Green box (bottom): Likely a buy-side liquidity or support zone, possibly a stop loss or retracement target.
These zones often represent risk-reward blocks based on prior session data or imbalance fill areas.
---
4. Price
Current Price: ~$116,586
Recent High (AS.H): $116,992
Key Support Levels: $113,065 and $110,193 (from prior session lows)
---
5. Price Structure
The chart shows a clear uptrend, with higher highs and higher lows.
Breakouts followed by consolidations near session highs suggest bullish momentum.
Potential continuation of the uptrend unless the price breaks below the previous session low (marked NYPM.L or NYL.L).
---
Conclusion
This is a well-marked institutional-style price action chart, likely using ICT (Inner Circle Trader) or SMC (Smart Money Concepts) principles. It’s showing bullish strength with multiple liquidity grabs followed by expansions to the upside. Key levels for future movement include:
Break and close above AS.H → Potential continuation toward next liquidity zone.
Drop below NYPM.L or NYL.L → Potential reversal or retracement.
Let me know if you'd like help planning a trade based on this chart!

Bitcoin Breaks Out — Major Momentum ShiftBTC/USDT has officially broken out of the descending channel it was consolidating in for over a month. The breakout was strong, clearing the horizontal resistance at $111,862, flipping it into support.
Chart Structure:
Descending channel broken to the upside
Horizontal resistance is flipped to support
Volume confirmed breakout momentum
Key Levels:
Support: $111,862 → Newly flipped support
Resistance Zones Ahead:
$116,818
$122,342
Upside Targets:
Immediate: $116,818
Extended: $122,342
Caution: Avoid FOMO. Wait for a retest near $111,800–$112,200 to confirm breakout strength.
Bias: Bullish
Timeframe: 4H
Wait for confirmation before fresh entries.
DYOR | Not financial advice
#BTC #Bitcoin

Bulish on Link The trend line weakly broke strong. Also on RSI. Also de MACD is pointing up. And also … everything else is aligning.
Hope this time is the one.

KAMINO: looks like is a breakoutThis breakout on daily timeframe looks pretty clean although the volume isn't picking up much.
Even on higher timeframe the compression of the price over the last weeks and the current breakout are visible:
So far KAMINO has done well during the "bad times" of the cycle, I expect great things once the liquidity starts to flow into crypto and alts starts flying.
I hope anyone has a bag of this. Thank me later.
Good luck!

#DYM/USDT#DYM
The price is moving within a descending channel on the 1-hour frame and is expected to break and continue upward.
We have a trend to stabilize above the 100 moving average once again.
We have a downtrend on the RSI indicator, which supports the upward move by breaking it upward.
We have a support area at the lower limit of the channel at 0.2232, acting as strong support from which the price can rebound.
Entry price: 0.2316
First target: 0.2384
Second target: 0.2461
Third target: 0.2532

MTV - bottom almost in...MTV playing with nerves but we see it's oversold with bullish divergence and pattern very similar to AIOZ before it reversed. I expect same move from MTV - bounce and push up to test November 2021 ATH pivot.

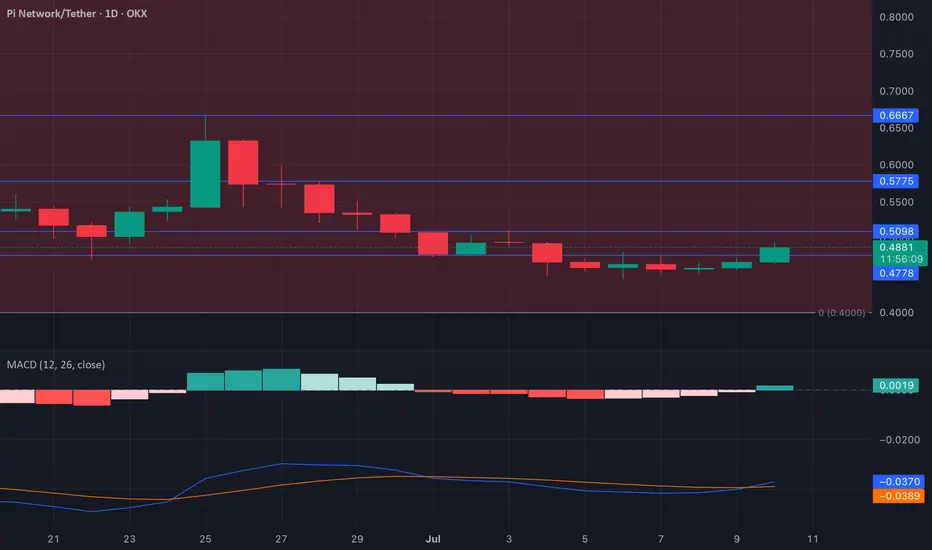
PI | Bullish MACD Crossover Signals Rebound AttemptPI has seen a 2% price uptick, triggering a bullish crossover on the MACD indicator—the first since July 1. This technical setup occurs when the MACD line crosses above the signal line, often viewed as a shift toward bullish momentum. It suggests increasing buying interest as bears begin to lose control.
Though both MACD and signal lines are still below zero—a sign of the meme coin’s prolonged downtrend—the crossover indicates a possible change in sentiment. For traders, this move is often interpreted as a buy signal, hinting at a short-term price rebound if bullish momentum continues to build.
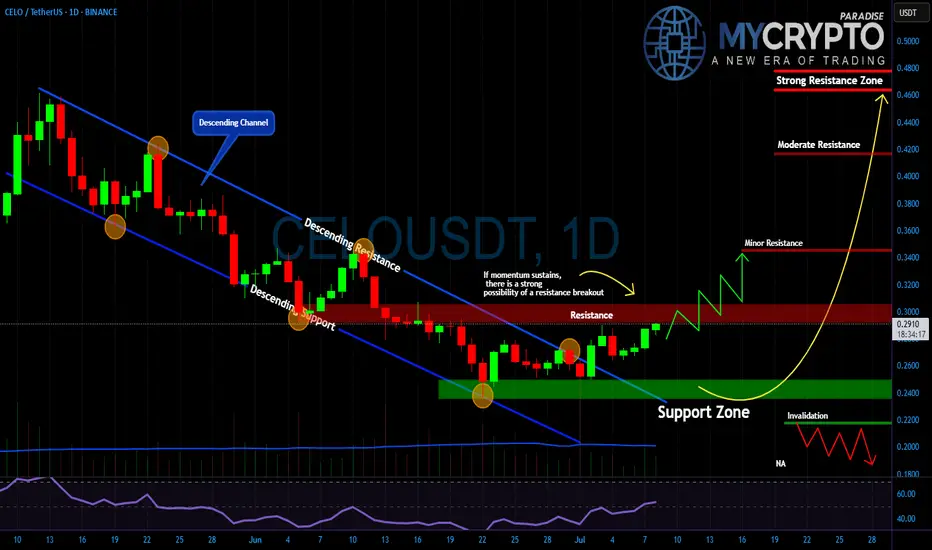
CELO About to Explode or Fakeout Incoming?Yello, Paradisers! Is this the breakout we’ve been patiently waiting for or just another trap to liquidate late buyers?
💎After weeks of grinding lower inside a clear descending channel, #CELO/USDT has finally broken out to the upside. That breakout alone isn’t enough, but it’s a critical first signal that sellers are losing control. Price is now pushing right into the key resistance zone at $0.29–$0.30, and what happens here will decide the next major move.
💎If momentum holds and price reclaims this level with conviction, we could see an explosive move toward $0.34 and potentially even the stronger resistance zones at $0.41 and $0.47 in the coming weeks. But if buyers fail to defend this push, and price rolls over, then the bullish setup quickly falls apart.
💎What gives us more confidence? The support zone at $0.24–$0.25 held beautifully buyers stepped in hard, and the market reversed cleanly from there. But if #CELO drops back below $0.22, the setup is invalidated and we'll wait patiently again for the next high-probability entry.
This is where most retail traders get trapped, they chase the move too late or panic-sell too early. Don’t be that trader. Stay focused. Be precise.
MyCryptoParadise
iFeel the success🌴
BTC Peak forecastedHI,
This is the weekly candle on BTC… showing in orange, a likely topping fractal, which would also likely propagate into something more like the dark orange, as we seek historic resistance levels to test for support.
As an interesting side note… i see DOGE coin as showing increasing strong bullish signals, which could indicate we are in the much prophecized decoupling of the DOGE-BTC pair… which will be a spectacular transfer of wealth from the dying giant to the intrepid coin of unconditional love! Thats what Dog’s represent… and it’s how the tribe feels about their coin too.
Biggest pump and dump of all time… the crypto geeks Pump btc, get the military dark money to buy in, and then dump it… empty bag. And where are they moving their money too? The favorite alt coins… and DOGE moves the biggest and fastest when it jumps and runs!
Good Luck!

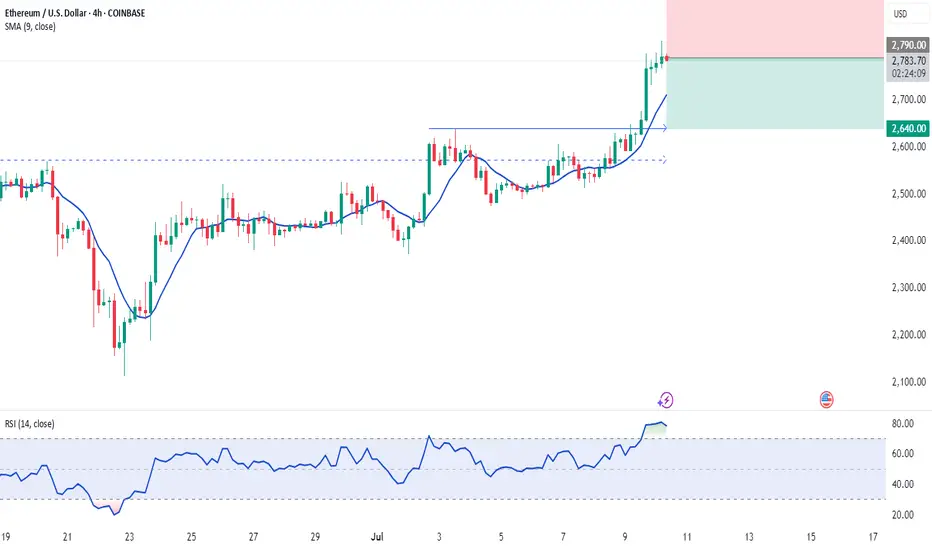
ETH/BTC Reclaiming Macro Bottom — Altcoin Momentum Incoming?ETH/BTC tagged its 2019 cycle low back in April 2025 — a key macro support level that’s held up for nearly six years. Since then, it’s printed a clean rebound followed by a textbook retest. Now it's threatening to break out of the pullback structure formed over the past few months. If this breakout plays out, ETH could lead the charge for altcoins, signaling the early stages of an altcoin rotation.