XLM Stellar - Classic Lesson 15 said Long Lesson 15 methodology (annotations in sync with the chart):
1. Support (this where buyers can come in)
2. Largest dn volume wave after a while - Look left - buyers came in previously at the same location.
3. Placed AVWAP and waited for price to cross upwards and pullback again on AVWAP
4. Entry signal PRL with abnormal SI 11.2 (price has a hard time to move down - absorption) after the pullback and that's our entry.
Enjoy!
Crypto market

Sei long to $0.2845Sei long to $0.2845. Just went long.
Currently attempting to flip bullish on 1hr tf and will also likely push to flip bullish on 4hr tf as well based on my analysis.
Roughly 3RR setup

Wait for something more reliableMorning folks,
Since our last update action was anemic. Nothing has changed seriously. BTC was able to show just minor upside action. Based on current performance, I do not want to take long position right here and prefer to wait for something more reliable. Because BTC action stands rather different from the one that we expected to see.
For example it might be H&S pattern on 1H chart. Thus, an area around 103K seems the one that we will keep an eye on.

NEARUSDT 1D#NEAR is trading inside a descending channel on the daily chart and has recently bounced off a strong support zone.
It’s now on the verge of breaking above the channel resistance.
If a breakout occurs, the next targets are:
🎯 $2.453
🎯 $2.625
🎯 $2.796
🎯 $3.040
🎯 $3.351
⚠️ As always, use a tight stop-loss and follow proper risk management.

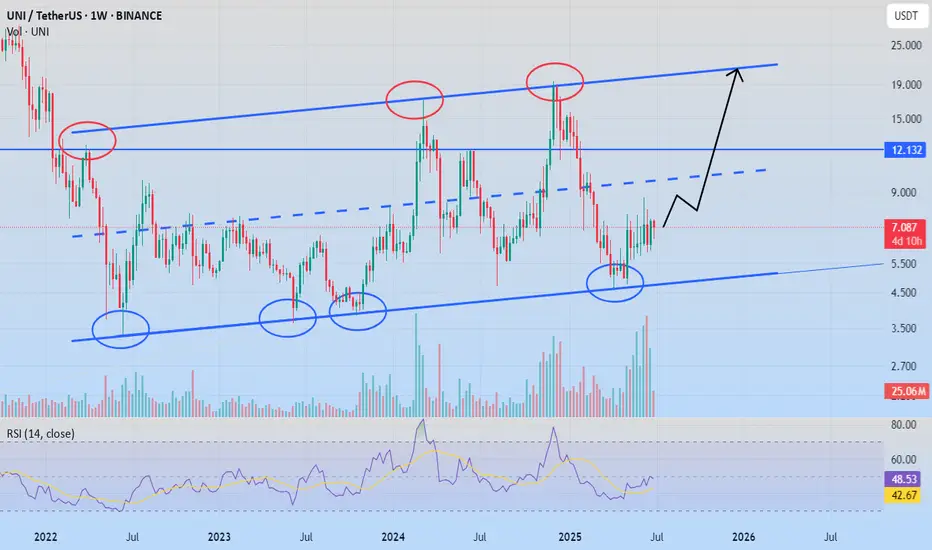
UNI TO 20$Uniswap
Uniswap protocol is the largest Automated Market Maker (AMM) DEX on the Ethereum Virtual Machine.
The chart only shows where the price is heading. Get ready to take profits.
I wish everyone abundant profits.
Like and follow
for more.
Bitcoin Approaches the $110,000 Level Once AgainDuring the latest trading session, Bitcoin gained over 3%, as renewed buying momentum entered the market. For now, the cryptocurrency appears to be approaching its historical highs once again, driven largely by the growing weakness of the U.S. dollar. This is reflected in the DXY index, which measures dollar strength and is now hovering around 96 points, consolidating a bearish trend not seen in years. As the dollar continues to weaken, BTC could benefit from the environment, maintaining consistent buy-side pressure in the short term.
Lateral Range Still Intact
Despite recent upward movements visible on the chart, it’s important to highlight that BTC has begun to consolidate within a defined short-term lateral range, marked by a ceiling at $110,000 and a floor near $100,000. While buying pressure has shown signs of resurgence, it remains insufficient to break out of the range, which continues to dominate in the short term. If price fails to break through these key levels, a wider consolidation channel could develop in the coming sessions.
Indicators:
MACD: The MACD histogram continues to hover near the neutral zero line, indicating a stable balance between buying and selling forces. If this behavior persists, neutrality could become more dominant in the short term.
ADX: A similar pattern is emerging on the ADX indicator, as the line remains below the neutral 20 level. This suggests that the average volatility of recent moves is steadily decreasing, and unless the ADX starts to climb, Bitcoin may struggle to sustain the current bullish momentum recently seen on the chart.
Key Levels to Watch:
$110,000 – Major Resistance: This level marks Bitcoin’s historical high. If buying pressure pushes price back to and above this level, it could signal the reignition of a strong bullish bias and set the stage for a resumption of the previous uptrend.
$106,000 – Mid-Range Support: The midpoint of the current consolidation range. It acts as nearby support and may serve as a barrier against short-term pullbacks.
$100,000 – Psychological Support Zone: This level aligns with recent multi-week lows. A return to this level could jeopardize the short-term bullish bias that has attempted to hold over recent sessions.
Written by Julian Pineda, CFA – Market Analyst

Xrpusdt 4hr tf bearishA bearish head and shoulders pattern is forming.
If it closes below 2.0811 on the 4-hour timeframe, the pattern may be activated.
Targets are 1.95, 1.80, and 1.65.
Invalidation occurs if the high of the right shoulder (2.3355) is broken.

BTC Just Breakout! Are we ready for new ATH? BTC just breakout from 4h trendline and anticipate for any retracement soon before sky rocket into new ATH, historically saying my target will be on $148k.
NFA!!
DYOR!!

HOOK/USDT – Successful Retest of BreakoutHOOK has successfully retested its downtrend breakout zone and is now attempting a fresh leg up, signaling renewed bullish strength. The previous resistance is now acting as solid support.
Analysis Highlights:
Breakout from multi-week downtrend line
Sharp pullback → clean retest of the breakout line
Buyers are stepping back in from the $0.095 zone
Support Levels:
$0.0950 – Immediate support (trendline retest zone)
$0.0996 – Strong horizontal support
$0.0890 – Key invalidation level (SL zone)
Resistance / Targets:
$0.1063 – First target
$0.1234 – Mid-term resistance
$0.1508 – Extended bullish target
Stoploss: Below $0.0890 (close below trendline)
Structure looks bullish for continuation if HOOK holds above $0.0950 and breaks $0.1063 with volume.
DYOR
Not Financial Advice

BTC Weekly Analysis : Rise or Fall ? Let's SeeBy analyzing the #Bitcoin chart on the weekly timeframe, we can see that last week’s candle closed at $108,350, and BTC is currently trading around $107,500. If the price manages to hold above $105,700, we could expect further upside momentum. The next potential bullish targets are $111,700, $124,000, and $131,800.
So far, this analysis has yielded over 9% return, and we’ll be sharing more updates soon from lower timeframes!
🎥 If you enjoyed this video analysis and found it helpful, please show your support with a LIKE and COMMENT below!
These video-style breakdowns take time and effort, and I’ll only continue them with your support 🙌
Your engagement is my biggest motivation to keep going 💛
Thanks for being part of the journey!

BTCUSDT: Trend in 2H time frameThe color levels are very accurate levels of support and resistance in different time frames.
A strong move requires a correction to major support and we have to wait for their reaction in these areas.
So, Please pay special attention to the very accurate trend, colored levels, and you must know that SETUP is very sensitive.
BEST,
MT

Solana (SOL/USDT) 4H Reverse H&S PatternSolana (SOL/USDT) – 4H Market Outlook | July 1, 2025
Introduction
SOL has formed a reverse head and shoulders pattern, followed by a clean breakout above resistance. While the lower time frame is bullish, the higher time frame remains bearish, creating a short-term opportunity within a broader downtrend.
Context 1: Key Zones
Supply Zone: 176 – 187
Demand Zone: 126 – 143
Psychological Levels: 140 and 160
Context 2: Technical Structure
Pattern: Reverse Head & Shoulders
Breakout: Confirmed above neckline/resistance
FVGs:
One below price (within demand)
One above price (potential target)
Golden Pocket: Sits just above lower FVG and inside demand — strong confluence support
Context 3: Volume Insight
OBV Indicator: Shows a sudden volume spike, adding strength to the breakout and the bullish pattern confirmation.
Bullish Scenario
Price pulls back into the golden pocket + FVG + demand zone
Finds support → bounces to form higher low
Second leg of the move breaks swing high → targets upper FVG and 160 psychological level
Bearish Scenario
Price breaks back below demand zone and invalidates the golden pocket
Fails to hold structure → reverts to macro bearish trend
Potential retest of previous swing low below 126
Summary
SOL is showing bullish momentum on the 4H after completing a reversal pattern and spiking in volume. A pullback into the demand zone confluence may offer a strong long setup — but failure to hold could revalidate the higher timeframe downtrend.

Continue analysis on VRACompleting my analysis of this currency from a year ago, we find that it has actually fallen, and according to the new data that has appeared, a triple flat has been formed, and a new strong fall to the area below is expected, and all the data is shown on the chart.
*In principle, I am not a supporter of any direction, but I am only giving my point of view, which may be right or wrong. If the analysis helps you, then this is for you. If you do not like this analysis, there is no problem. Just ignore it. My goal is to spread the benefit. I am not one of the founders of the currency.

Map Of FillIt has been moving sideways for more than two years and a head and shoulders pattern has been formed on a large monthly fact first glance at the chart, we find that it has been moving sideways for more than two years, forming a head and shoulders pattern, which indicates a further decline. On the other hand, a sideways wave has been formed, which is an X wave, and we are preparing for a large bearish W wave to come.rame, so it is expected to fall again strongly to one of the two areas specified below.
Note: There is a previous analysis of this currency on my page and all its legacies were explained before.
*In principle, I am not a supporter of any direction, but I am only giving my point of view, which may be right or wrong. If the analysis helps you, then this is for you. If you do not like this analysis, there is no problem. Just ignore it. My goal is to spread the benefit. I am not one of the founders of the currency.

ETH | Long | 3 Hrs | Target: 2,540This technical analysis is for informational and educational purposes only. It does not constitute financial advice. Remember to always research and consult with a professional before making investment decisions. Good luck! 📈💼🚀

ETH/USDT : Gearing Up for a Major Breakout? (READ)By analyzing the Ethereum chart on the weekly timeframe, we can see that the price has started rising just as expected and is now approaching the first target. For now, ETH faces major resistance in the $2,600–$2,900 zone.
If price breaks above this key area, I expect a strong bullish move from Ethereum!
Based on the main analysis, the short-term targets are $2,700 and $2,890, while the mid-term targets are $3,100 and $4,100.
Please support me with your likes and comments to motivate me to share more analysis with you and share your opinion about the possible trend of this chart with me !
Best Regards , Arman Shaban

AVA/USDT – Long-Term Bullish Reversal in PlayAVA has been trading within a well-defined downward channel for weeks, making consistent lower highs and lower lows. However, price has now broken above the upper boundary of the channel with strong volume and momentum, signaling a potential trend reversal.
Technical Analysis:
Channel Breakout:
Price has successfully closed above the descending trendline (channel top), confirming breakout and bullish intent.
RSI Surge:
RSI has shot past 80, a sign of strong bullish momentum. Short-term pullbacks may occur, but long-term sentiment is shifting.
Higher Lows Forming:
Structure is starting to shift from bearish to bullish, especially with current candle body closings above $0.03016.
Volume Spike:
Notable increase in buying volume, often seen before trend flips in micro caps or small altcoins.
Key Levels to Watch:
Support Zones:
$0.03016 – Key breakout level; should act as support now
$0.02440 – Historical accumulation zone
$0.02100 – Long-term base support
Resistance / Target Zones:
T1: $0.04026 – Local structure and previous consolidation
T2: $0.05550 – Psychological and technical resistance
T3: $0.07971 – Major reversal zone
T4: $0.10185 – Long-term target from macro high
Stoploss:
$0.02400 (close below re-enters channel and invalidates breakout)
Entry Idea:
Accumulation Zone: $0.029–$0.031
This is the ideal area for positioning with minimal risk and a good reward ratio.
Not Financial Advice | DYOR Always

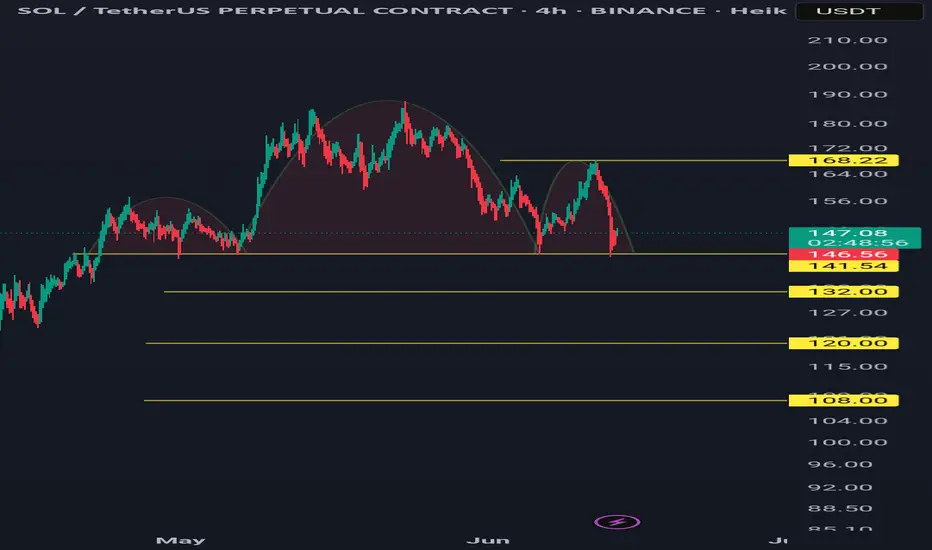
Solusdt 4hr tf bearishA bearish head and shoulders pattern is forming.
If it closes below 141.54 on the 4-hour timeframe, the pattern may be activated.
Targets are 132, 120, and 108.
Invalidation occurs if the high of the right shoulder (168.22) is broken.
$DEEP bottomed?It seems to be the case, the SUI eco seems to have found a bottom, good time to load up and allocate to defi there. Momentum finance, Ensofi, Suilend, Cetus, VoloSUI, all are good to get involved with in the most capital efficient manner, to name a few.
Best of luck!
Cheers,
Ivan Labrie.

BTC with potential for $115,000/$120,000🔍 Market structure (Price Action)
📈 Trend:
The market previously formed higher highs (HH) and higher lows (HL) – a classic uptrend.
Then there was a correction and a lower high (LH) and lower low (LL) appeared – a potential change in the trend to a downtrend.
The last two lows are again HL (Higher Lows) – suggesting an attempt to return to the uptrend.
🔄 Key support and resistance levels
✅ Resistance (green horizontal lines):
117.469 – local resistance and potential breakout target from the current range.
115.802 – confirmed resistance from previous consolidations.
111.814 – strong local resistance (LH – Lower High formed there).
109.341 – current resistance, the price is currently testing it.
🛑 Support (red horizontal lines):
105.370 – local support, price reacted at this level in recent days.
102.650 – important support, level of previous HL.
100.095 – consolidation level before breaking out upwards.
98.213 – last LL – very important level in the context of defending the structure.
🧭 Structure of peaks and troughs
HH: Higher High – confirmed the previous uptrend.
LH: Lower High – first warning about changing the structure to down.
LL: Lower Low – confirmed a potential change to downside.
HL (x2): two more higher lows – suggest a possible return to growth.
📊 Stochastic RSI (at the bottom of the chart)
The oscillator is currently in the overbought zone (>80), approaching a downward crossover.
It suggests a possible short-term halt in growth or correction.
But in strong trends it may "stick" to the upper range.
📌 Potential scenarios:
🟢 Bullish:
If the price breaks above 109.341, it may test 111.814 and then 115.802.
Continuation of the HL → HH formation will confirm a trend reversal and further growth.
🔴 Bearish:
If the price does not stay above 109k and breaks below 105.370, there is a risk of a test of 102.650 and lower.
A break of 100.095 and especially 98.213 will negate the growth structure.
🧠 Conclusions:
The market is at a key decision point - HL formation vs. resistance zone.
Buyers' strength will be confirmed only after breaking 111-112k.
Stochastic RSI warns of potential pullback or consolidation.

OP 5$ SOONOptimism
Optimism is an EVM-compatible optimistic rollup blockchain platform built on top of Ethereum.
We note that the currency has been undergoing a deep correction for a long time due to the ongoing downward pressure and market negativity.
Note that the currency made a strong rebound after a false break on the RSI.
I expect this currency to achieve a historic high once the currency season begins.
This analysis fails to break the historic low and trade below it.
I wish everyone abundant profits.
Like and follow
for more.

That's why everyone should have LINK⚡️ Hello, everyone! I decided to continue exploring fundamental altcoins. Next up is LINK. This is definitely a key project in terms of technology, and without it, the crypto ecosystem we know today would not exist. Their oracle technology is used by approximately 90% of ALL protocols.
So it's hard to underestimate its importance, but let's take a look from a technical point of view. How much trading potential does LINK have?
➡️ The token has been in correction for a long time, like practically the entire market. During the decline, it formed a GAP at the level of $25.65 - $20.55. And as we know, 95% of GAPs tend to close sooner or later.
Globally and locally, the token is currently in a flag pattern. Therefore, high volatility and a period of consolidation can be expected in the near future. During this period, the further direction of the token's movement will become clear.
⚙️ Metrics and Indicators:
Volume - a divergence with the price has formed. Throughout the correction, sales volumes have decreased. This signals the exhaustion of sellers.
Money Flow - harmony with the price. Liquidity continues to slowly decline, but at the same time, it does not form new lows, which means that demand for the token remains.
Support/Resistance - LINK has now reached a key level at $12.64, which could trigger a surge in buyer interest. However, if it cannot hold, the next strong support is at $10.09. At the same time, slightly higher, at $15.52, there is strong resistance, which is also a strong psychological resistance (round number).
📌 Conclusion:
LINK certainly still has potential for decline. It is quite undervalued, even with Bitcoin being so expensive. But if Bitcoin falls, LINK will fall even lower, as will the entire market.
And at times like these, everyone's attention turns first to fundamental assets that are truly valuable and currently too cheap. No one is rushing to buy HarryPotterObamaSonicInu10 because no one knows its true value.
🔥 So be patient, LINK is definitely a fundamental asset, and if you want to add it to your portfolio, now is definitely not the time.

AERO Long Swing Setup – Strong Pullback into Fibonacci SupportAERO has shown notable strength in recent months and is now retracing into a key support zone, aligning with the 38.2% Fibonacci level. The $0.75–$0.80 area offers a solid long swing opportunity.
📌 Trade Setup:
• Entry Zone: $0.75 – $0.80
• Take Profit Targets:
o 🥇 $1.04 – $1.32
o 🥈 $1.60 – $2.05
• Stop Loss: Daily close below $0.70
