League of Kingdoms · Back to Baseline 1,300% Profits TargetLeague of Kingdoms has been dropping since March 2022 vs Bitcoin, LOKABTC. A more than 3 years strong downtrend. The chart is telling me that this downtrend is coming to an end. We have a volume signal, together with price and marketwide action.
Growth potential is huge, it goes beyond 3,700%. For this chart setup, we are going to be focusing only on the "baseline." That is, 1,296% profits potential. This is an easy target.
To get a better picture of this chart you can always disable the log. scale and you will get a better view of reality. LOKABTC is trading at true bottom prices. Once the bottom is in, a reversal can happen any day. The reversal can lead to long-term growth. It will be the first bull market for this pair.
We do not use leverage on this type of setup, very low risk. The strategy is simply to buy and hold. Accumulate long-term as much as you can and want.
Make sure to do your own planning before trading. Market conditions can always change.
Thank you for reading.
Namaste.
Crypto market

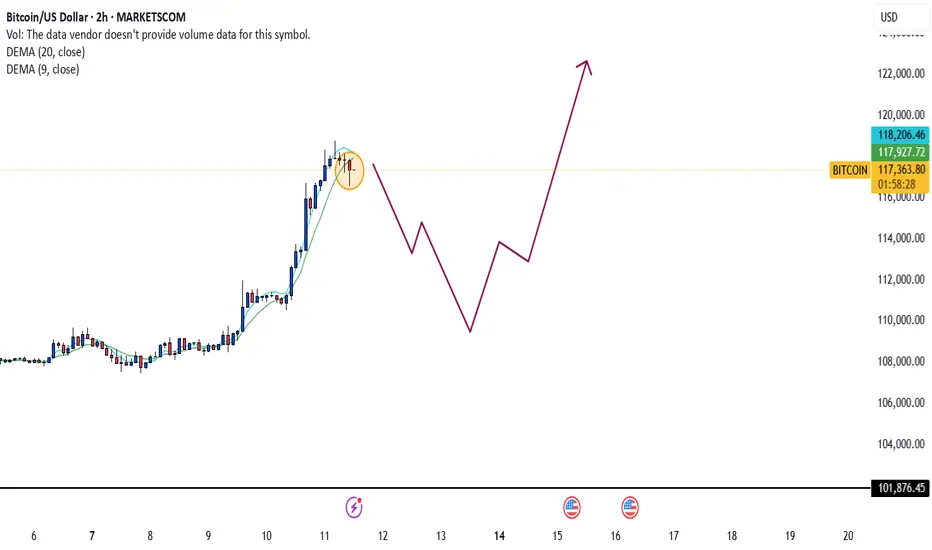
Evolving Price & Candle Patterns: BitcoinLook what is happening here with the candle patterns and price action. In the most recent challenge of resistance something changed. Change is good. It can mean the end of this sideways period.
At (1) Bitcoin finds resistance and immediately starts a decent. The same happens at (2). When we reach (3) everything changes. (1) & (2) produced a low and lower low. The down-move was extended. (3) produced only two red candles, a strong higher low and the third day was a full green candle moving above the descending trendline resistance. The price pattern is now erratic, completely different to previous moves.
Now, consider (4). If the strong green candle was intended as a bull-trap, then we would expect a down-move to follow right after the peak, just as it happened with (1) and (2). But nothing, after (4), Bitcoin has been sideways within the bullish zone.
This change is good, bullish.
A drop can develop anytime but the market already had two changes to produce a down-wave, (3) and (4). The fact that a down-move didn't materialize means that the market has something different in store for us, change. This change is good because when resistance is challenged, prices tend to drop when the market is moving within a range. No drop can signal the end of the range trading which in turn can translate into the start of the next bullish wave.
If this idea turns out to be true, Bitcoin will start growing within days. Growth should be strong because consolidation has been happening for months.
Namaste.

BTCUSD supported at 114,000BTCUSD broken a major resistance at 113,000.
I would be buying any dip towards 114,000 for higher levels.
The target is located at 150,000 and 160,000 in coming three months.

PORTALUSDT CHART ANALYSİS ISTRADING CRYPTO PROFITABLE?
Crypto trading is profitable but only if done correctly. Follow the
steps, strategies, and tips shared throughout our guide, and you will be
in a better position to make profitable trades. And a golden rule:
Plan your trade, trade your plan.
Never Forget: 90/90/90 trading rule.
90% of traders will lose 90% of their account value within 90
days.
1. No matter how much profit you make; what matters is how
much you keep.
2. No matter how much you keep, what matters is how much you
re-invest.
3. No matter how much you re-invested, what matters is your
total return on investment (ROI).

XRP SKYROCKETS AND BREAKSOUT PRICE RANGE! ⭐️In a pretty crazy twist and turn of events we're seeing XRP absolutely skyrocket and breakout with this morning's announcement on behalf of President Donald Trump with his Truth Social media platform announcing it had filed for a Crypto Blue Chip ETF with the SEC.
⭐️ The Blue Chip ETF proposal includes 70% holdings in Bitcoin, 15% in Ethereum, 8% in Solana alongside 5% in XRP and 2% in CRO which is from Crypto.com. This notably has led to the breakout with XRP that we're currently seeing with the crypto already up 12% since the day started and news broke out. It's still early morning too so we'll see how the market reacts as the day continues and traders wake up to the news.
⭐️The past few weeks have seen XRP stuck within this horizontal channel and constant tug a war between $1.90-$2.30 with this breakout and the last week signaling bullish optimism towards the crypto alongside news of the BNY-Mellon deal with BNY Mellon set to become the Custodian for Ripple's RLUSD Stable coin. And for those that don't know BNY-Mellon is America's oldest bank having been founded in 1784 and with an estimated $45.7 trillion in assets under custody and/or administration. To say in the least this is a big step for Ripple showing more institutional growth.
⭐️To note also is this as I'll show below on Bitcoin's chart:
⭐️ It's crazy to say but we've just seen Bitcoin form a new All-Time High at $118,100 alongside the Crypto Blue Chip announcement, more than likely with investors and institutions flocking to buy in before the ETF get's approved and likely in anticipation of a bullish shift.
⭐️ We've already seen the crypto space weather the storm through the last few weeks and months with everything that's happened from global escalations to all the new bills and changes in the government. Through thick and thin the crypto space has proved resilient and investors are taking note.
⭐️ Have to run for work but wanted to get a quick idea out there, especially since this news just broke out. Some pretty crazy stuff and I'll be watching these levels here to see if things continue or if the news has simply given us a breakout, regardless it's a win-win with all this news only pushing the directive and story towards crypto and digital assets for many. I'll attach a link below to an article on the Blue-Chip ETF for reference as well.
⭐️ Thanks so much as always and all the best till then, feel free to keep posted for more updates and ideas as we continue on this journey we've been riding the last few years already. It's been a lot but it's got much more to go. Let's keep at it and keep our heads up.
⭐️ Reference on Crypto Blue Chip ETF:
apnews.com
Best regards,
~ Rock'

Historical Top?It wasn't triangle. Just one of the bull trap.
But how about this ath?
I think this is trap, too.
2021 April~December movement.
Do you remember at that time?
If you do, you won't open a short postion.
Finale makes incredible Alt BullRun, always.
This month is the most important for checking annual trend.
ETH Ascending TriangleETH has formed a clear ascending triangle pattern with a possibility of imminently breaking out to the upside. If rejected, we could see a breakdown to the ~2,300 support and subsequent rebound.
My bias is still bullish. We'll let the market tell us what happens and respond accordingly. Worst case scenario is more boring consolidation.
Stay patient.
Happy trading,
Melonfarmer

$160K BTC by AUG 11thI think we are in the 2nd to last leg up to top of Bull run. 5 waves to this one should put us at $160k, then a 3 wave down before the last 5 waves up for top by end of year. this could all be done in Aug or sept. Will have to check then to see what happens. But I call for $160k within 30 days. Bold I know. Lets go Moon shot. Top of bull run. $190k ? thoughts?

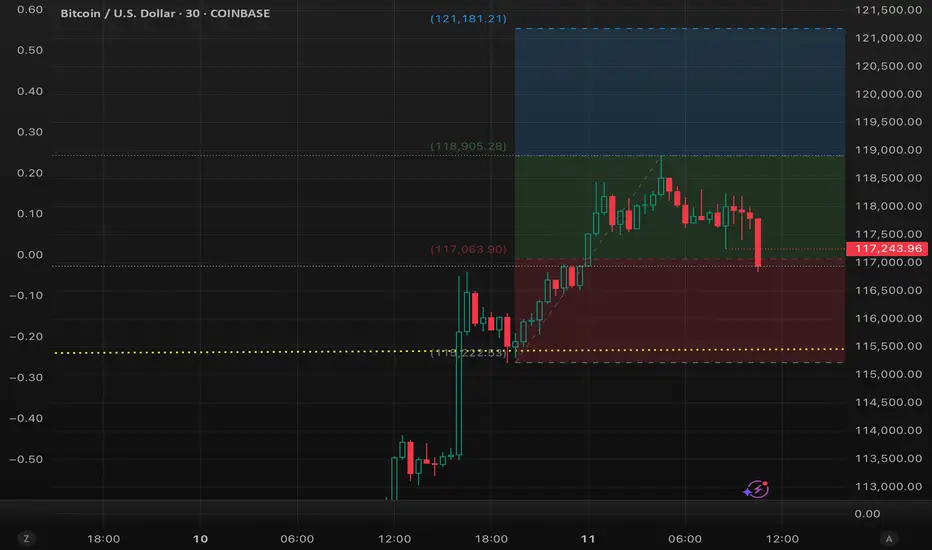
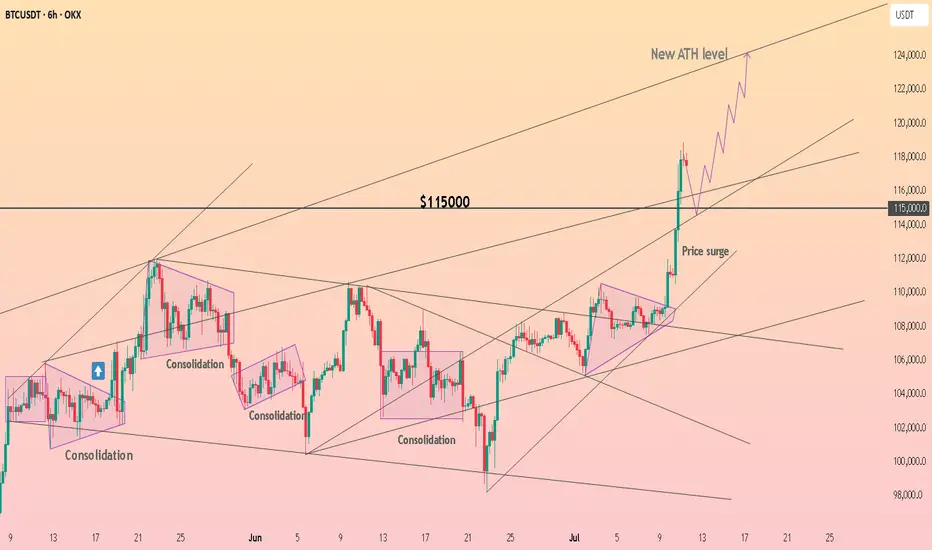
HolderStat┆BTCUSD above the $115kOKX:BTCUSDT broke out of its consolidation structure and surged past $115,000 resistance. The price is showing parabolic behavior as it targets the ATH level near $125,000. Structure remains bullish as long as the support base near $113,000 holds.
ARB New Analysis (3D)Before anything else, pay attention to the timeframe | it's a higher timeframe and will take time.
The higher timeframe structure of ARB is honestly not that bullish. In this scenario, we’ve considered the entire correction | starting from where the red arrow is placed on the chart | as a diametric/symmetrical pattern.
From a time perspective, wave E has not yet completed, and it is expected to finish somewhere between the two vertical lines. Wave E here is a bearish wave.
If the price pulls back and reaches the green box, we can look for a buy setup in that area.
A 3-day candle closing below the invalidation level will invalidate this analysis.
For risk management, please don't forget stop loss and capital management
When we reach the first target, save some profit and then change the stop to entry
Comment if you have any questions
Thank You

Bitcoin (BTC): Markets on Fire | Almost at $120K (140K Next?)Markets are going crazy, people are in fear of missing out (FOMO) and we are just chilling; the price moved exactly like we needed it to move.
We are very close to our target of $120K,, where we might see some kind of strong rejection or even stronger bullish volume (we will have to reach this areaa before deciding our next gameplay).
What we see or aim at is $140K to be a local to for this bull run. After that we are expecting more of sideways movement and then a bigger correction to happen.
Swallow Academy

#ARB/USDT Arbitrum scalp long to $ 0.4451#ARB
The price is moving within a descending channel on the 15-minute frame and is expected to break and continue upward.
We have a trend to stabilize above the 100 Moving Average once again.
We have a bearish trend on the RSI indicator, supporting the upward break.
We have a support area at the lower boundary of the channel at 0.4070, acting as strong support from which the price can rebound.
We have a major support area in green that pushed the price upward at 0.3970.
Entry price: 0.4160.
First target: 0.4300.
Second target: 0.4407.
Third target: 0.4451.
To manage risk, don't forget stop loss and capital management.
When you reach the first target, save some profits and then change the stop order to an entry order.
For inquiries, please comment.
Thank you.


ETHUSDTHere is a great move for ETH after a long time.
So I can recommend some levels to trade and bullish move has been started.
good luck
DYOR!

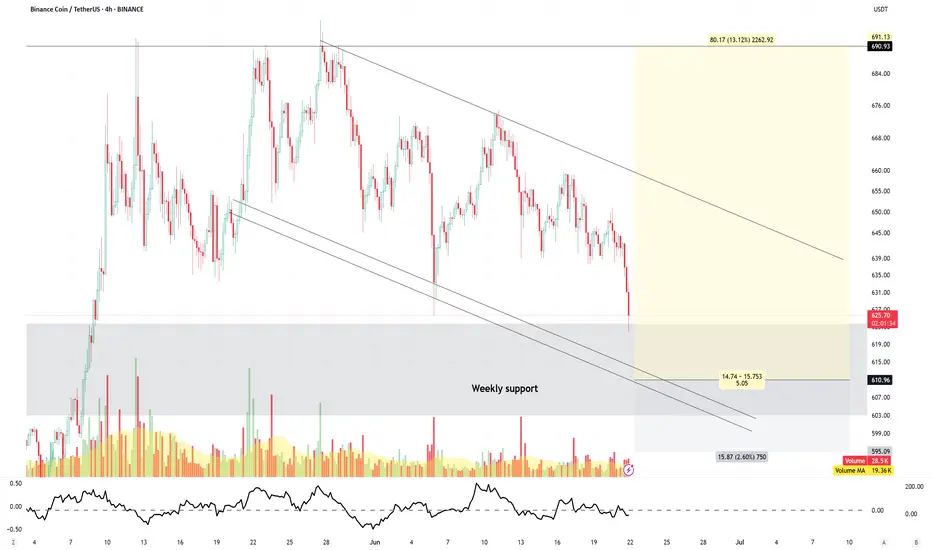
BNB wait for entry
BNB has been consolidating around its current weekly support level for over a year.
Such prolonged consolidation often precedes a significant breakout. Accumulating at this key support zone could present a strong opportunity for long-term positioning.
For short-term trades, it’s best to patiently wait for price to trigger the setup outlined in the chart.
Disclaimer:
This analysis is based on my personnal views and is not a financial advice. Risk is under your control.
#WLD/USDT , How Long Will It Take For A $ 1.14 Target?#WLD
The price is moving within a descending channel on the 15-minute frame and is expected to break and continue upward.
We have a trend to stabilize above the 100 Moving Average once again.
We have a downtrend on the RSI indicator that supports the upward break.
We have a support area at the lower boundary of the channel at 1.06, acting as strong support from which the price can rebound.
We have a major support area in green that pushed the price higher at 1.05.
Entry price: 1.08
First target: 1.09
Second target: 1.117
Third target: 1.14
To manage risk, don't forget stop loss and capital management.
When you reach the first target, save some profits and then change the stop order to an entry order.
For inquiries, please comment.
Thank you.

NXPC/USDT +200%NXPC/USDT recently experienced a healthy 75% correction, which appears to be part of a larger accumulation phase rather than a breakdown. Over the past two weeks, the price action has established strong support, signaling that the bears may be exhausted and a potential trend reversal is underway.
Currently, NXPC is trading above the $1 psychological level, confirming buyer strength. For optimal entries, we will wait for a healthy retracement into the $0.92–$1.00 demand zone, which aligns with the newly formed support and offers a favorable risk-reward setup for a potential continuation to the upside.

#WLD/USDT#WLD
The price is moving within a descending channel on the 1-hour frame, adhering well to it, and is heading towards a strong breakout and retest.
We are experiencing a rebound from the lower boundary of the descending channel, which is support at 0.950.
We are experiencing a downtrend on the RSI indicator that is about to be broken and retested, supporting the upward trend.
We are looking for stability above the 100 moving average.
Entry price: 1.20
First target: 1.04
Second target: 1.07
Third target: 1.10

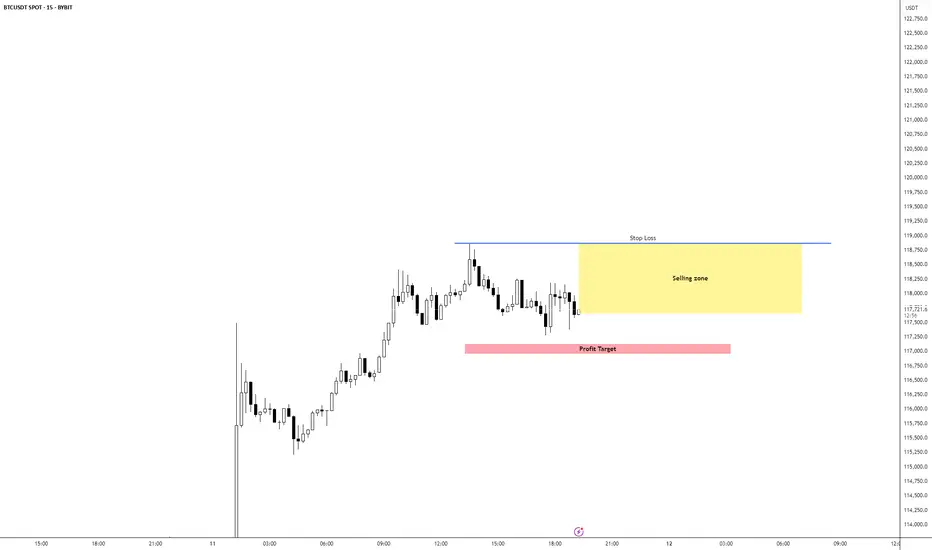
BTC/USD Short IdeaBTC/USD is currently bullish overall but seems overextended, Expecting a pullback to the 5m Equilibrium levels which would be our TP area. 1M has switched bearish adding confluence to our setup.
I would be layering short positions inside the yellow selling zone
Bitcoin Money machinebeautiful bearish candlstick has been created a the top of the wave , thechnicaly the price might go for a retracement to fuel back up again , place a short position while maintaining a good money management its tricky some time with what's going on
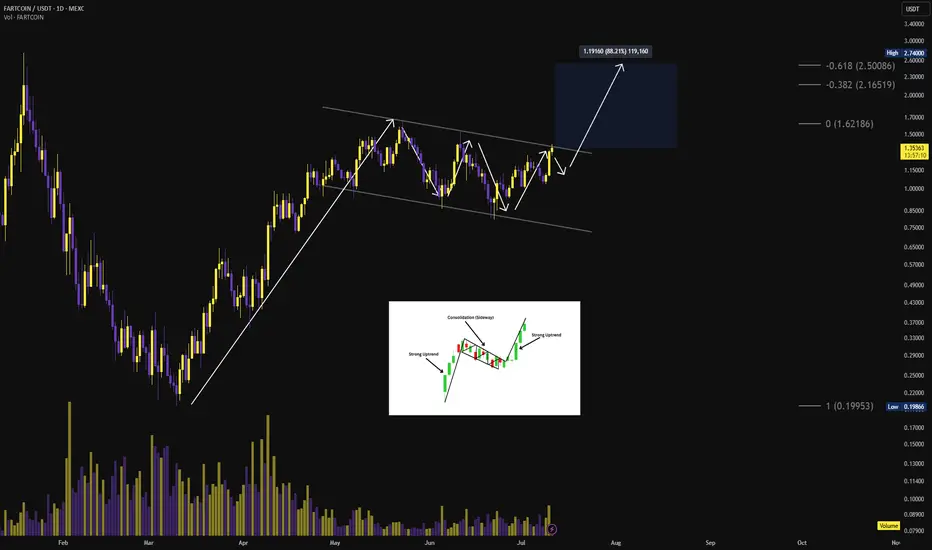
$FART Bull flag can breakout here!🚨 SEED_WANDERIN_JIMZIP900:FART about to rip faces clean off with a bull flag breakout! ⚠️📈
Weeks of consolidation, fakeouts, and shakeouts… and now it’s knocking on the $1.40 breakout level🌪️
Break that line — and we’re heading straight for $2.00, with $2.50 in the crosshairs. 🎯
$FARTCOIN has the structure is textbook. Volume creeping. Momentum building.
#FART isn’t just a meme anymore… it’s a rocket with fuel to burn. 🚀
BTC setup with 2R R:R.BTC is showing signs of a real breakout.
This setup offers a 2:1 risk-reward ratio.
Entry: 111,207
Stop Loss: 107,500
Target: 120,000
Not financial advice.
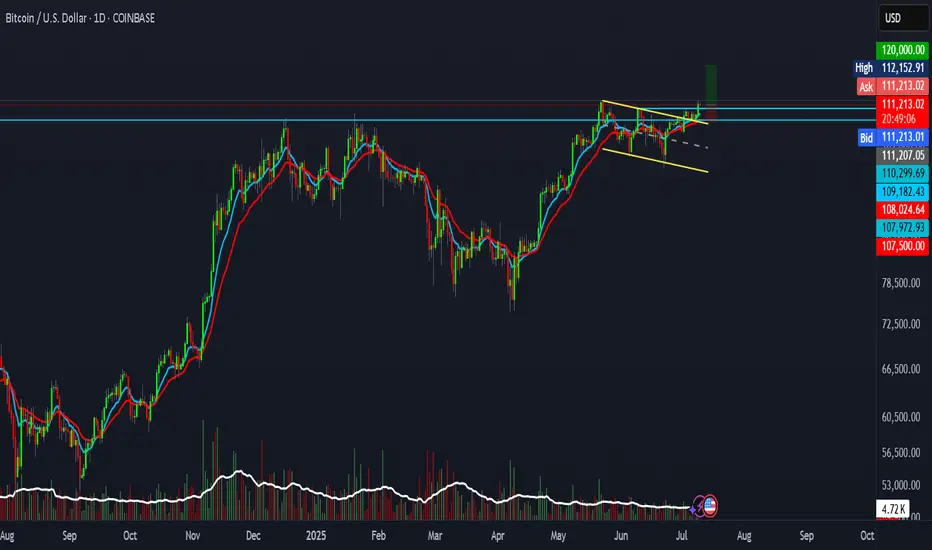
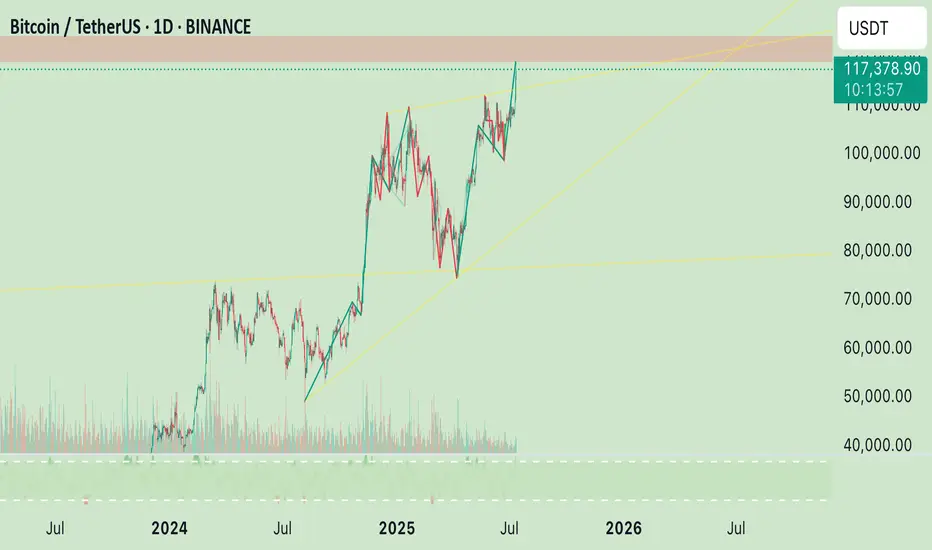
Keep an eye on 117k as the level to stay above.This is the first time in 7 years that Bitcoin has been able to push up through a long trendline originating in 2018. And this is the longest time we have been above this level, with April 2021 spending one day above it.
Yes, all those shorts calling for a deep retracement got rekt, but a clock is right once a day - so there is always that possibility that we will see some profit taking and consolidation here.
We want to stay above the low in this latest move at 117,250 USD. And we are trying to close the day above the 50% of this latest move, which comes in at 117k USD. Anything less increases the risk of a pullback to digest these latest gains.