The only cat on binanceWhy NYSE:CAT Could Shine in Autumn 2025 Bullrun
Meme Coin Momentum: Bullruns often favor meme coins due to retail investor enthusiasm. NYSE:CAT ’s strong brand and cute cat theme could capture attention, especially if marketed effectively on platforms like X or TikTok.
Gaming and NFT Hype: The integration of NYSE:CAT in mobile games and NFTs taps into growing sectors. If new games or NFT drops launch in Autumn 2025, it could drive demand.
Low Market Cap: With a sub-$300M market cap, NYSE:CAT has significant growth potential compared to larger meme coins, making it attractive for speculative investors.
Community Strength: The Simon’s Cat brand gives NYSE:CAT a loyal, non-crypto-native audience, which could translate into broader adoption during a market upswing.
Crypto market

BRIEFING Week #24 : is Stagflation Coming next ?Here's your weekly update ! Brought to you each weekend with years of track-record history..
Don't forget to hit the like/follow button if you feel like this post deserves it ;)
That's the best way to support me and help pushing this content to other users.
Kindly,
Phil

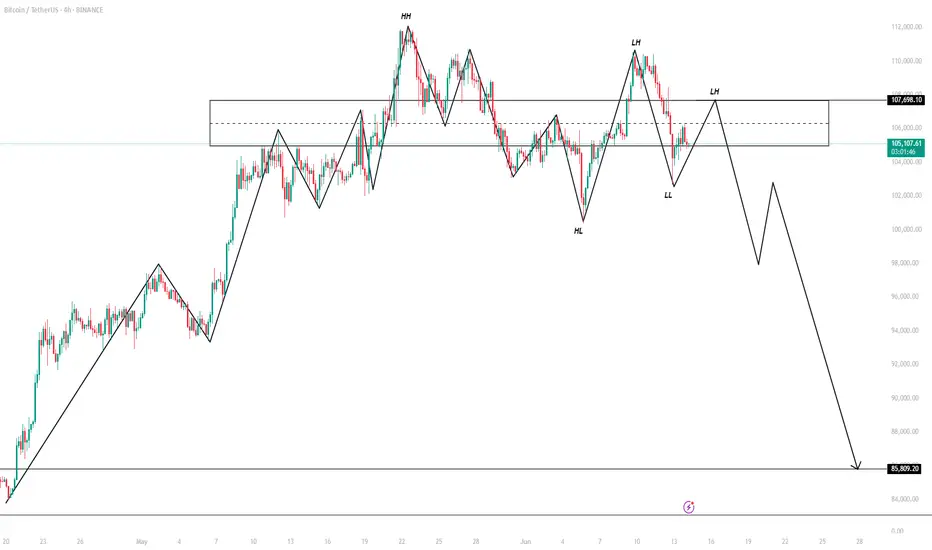
BTC AT DEEP CORRECTION Price failed to break and hold above 111,000, forming a double top or potential lower high structure. Strong bearish drop from 111,000 to 103,500, showing momentum shift to the downside. Likely stop-hunt or liquidity grab below prior lows , Next move will depend on whether it breaks above 107k (bullish) or drops below 103k (bearish).
Qubic - silent sleeperQubic is a decentralized platform focused on smart contracts, AI, and distributed computing, with a unique "useful proof-of-work" (uPoW) model where mining contributes to AI computations. Here's why it might be a good choice for the Autumn 2025 bullrun, based on current insights and trends:
Innovative Technology: Qubic's uPoW repurposes mining energy for AI training and computation, addressing energy waste in traditional proof-of-work systems. This aligns with growing interest in sustainable and purpose-driven blockchain projects, potentially attracting investors during a bullrun.
AI Integration: With AI being a dominant trend (e.g., models like Grok and others driving market hype), Qubic's focus on decentralized AI computation could position it as a leader in this niche. Its Aigarth protocol aims to create a global AI network, appealing to sectors needing secure, distributed processing.
Scalability and Low Costs: Qubic uses a quorum-based system with 676 Computors (nodes) for consensus, enabling high transaction throughput (potentially millions per second) and near-zero fees. This scalability could make it competitive against Ethereum and other smart contract platforms during a market surge.
Community and Development: Qubic has an active community and ongoing development, with milestones like the Qubic Mainnet and AI-driven features gaining traction. Posts on X highlight enthusiasm for its "True AI" vision and partnerships, which could drive speculative interest in a bullrun.
Market Positioning: As of June 2025, Qubic’s market cap is relatively low (around $600M, per recent data), suggesting room for growth compared to established coins. A bullrun often lifts smaller-cap projects with strong fundamentals, and Qubic’s unique proposition could draw attention.

ETHUSED TREND WEAKER Price has been ranging between approximately 2500 and 2900 and the major trend is strongly bearish.Price recently attempted to break above previous highs but got rejected. Price is at a critical support level in a larger range structure. A break below 2500 could lead to a deep correction correction

$BTC Bounced from $103K – Hedge Short Still Active
Bitcoin was supposed to break out, but fear of war changed the plan. Instead of pumping, BTC dropped to retest support around $102,700 — and bounced strongly.
🔸 Key Support Zone: $100K – $99K
This area is holding well for now. But if BTC loses $99K, we could see a deeper drop.
🔸 Short from $108,500 is still open
We’re using it as a hedge in case the market crashes. If the price drops more, we’ll take profit on the short. If BTC goes back up to $108K+, the short will be closed on entry. That’s the best-case scenario.
🔸 What’s Next?
Everything depends on global news. If war fears grow, BTC may drop fast. If things calm down, we could see a strong recovery.
✅ We’re in a strong position — low risk, high reward. No panic. We’re ready for both outcomes.


Bull Trap or Just the Beginning? All Eyes on 103kOnce we cleared the 109k ATH, I began tracking this new structure (in blue). Considering the current macroeconomic backdrop, it’s starting to make a lot more sense.
There’s plenty of noise about this being the biggest bull run in recent times, but looking at the chart, FVGs left behind, lack of volume commitment, and inefficient price action… are we actually gearing up for one of the largest bear markets we’ve seen instead?
You really don’t want to see a weekly close below 103k.

Weak Pullback, Bears in Control | Will the $100K Zone Hold? BTCUSD – Weak Pullback, Bears in Control | Will the $100K Zone Hold?
🌍 Macro & Fundamental Outlook
Bitcoin continues to face downside pressure after failing to hold above the key $108K resistance. Several macro factors are influencing sentiment:
📉 US bond yields are rising again, as markets expect the Fed to delay rate cuts. This adds pressure on risk assets like BTC.
🪙 Bitcoin Spot ETF inflows remain positive, but are currently not strong enough to counter short-term selling pressure.
💵 The DXY (US Dollar Index) is recovering, as investors flee to USD amid geopolitical volatility in the Middle East.
📊 Institutional liquidity is thinning across exchanges, adding to intraday volatility.
📉 Technical Analysis – H1 Chart
🔹 Trend Structure:
BTC is now firmly in a short-term downtrend, trading below the descending trendline and all key moving averages (EMA 34, 89, 200).
Rejection from every pullback suggests that sellers are still in control.
🔹 Key Price Zones:
Bearish FVG Resistance: 106,096 – 107,004
First Support Zone: 102,821
Major Support Zone: 101,539 → 100,419
A clean break below 100K could open the door to 98,000 and below
🔹 Momentum:
RSI is neutral, hovering around the mid-40s without strong divergence signals.
Selling volume is increasing but not yet explosive — indicating the market may be awaiting a macro catalyst.
🧠 Market Sentiment
Traders are currently in “wait-and-see” mode, eyeing the next round of macroeconomic data and potential Fed commentary.
Short-term profit-taking is dominant after last week’s sharp rally.
Overall sentiment: Bearish short-term – Neutral mid-term – Bullish long-term
🎯 Trade Setup Ideas
🔻 SELL if price retests FVG and gets rejected
Entry: 106,000 – 107,000
Stop-Loss: 107,500
Targets: 102,821 → 101,539 → 100,419
🔹 BUY if price reacts strongly from 100,419 – 101,500
Entry: 100,500 – 100,800
Stop-Loss: 99,800
Targets: 102,800 → 104,400 → 106,000
Preference is given to selling the rally in the short term. Buying should only be considered on confirmed reversal signals at key support.
✅ Conclusion
BTCUSD is currently in a corrective phase, with bears maintaining control. The key level to watch is the $100,419 support zone, which may determine whether Bitcoin maintains its medium-term bullish structure or breaks further. Discipline and confirmation are crucial in this volatile environment.
📌 Strategy Focus: Look to sell rallies toward resistance; buy only on confirmed bounce from strong support zones.

HATCH LONG TERM VISIONA token holding strong despite Middle East tensions. The price isn't dropping below the weekly open, and long-biased flow continues. With the Bitget spot news, the Fibonacci levels above are targeted.

BTC/USD – Bearish Continuation from Rising Channel BTC/USD – Bearish Continuation from Rising Channel 🚨🧱
This chart indicates a bearish market structure with the following key technical features:
🔍 Chart Analysis:
Change of Character (CHoCH) 🔄
A shift from bullish to bearish was confirmed by a strong breakdown after the CHoCH marked at the top.
This breakdown invalidated previous bullish structure.
Bearish Flag Formation 📉📐
After the impulsive drop, price formed a bearish flag (rising channel), suggesting a potential continuation move to the downside.
Resistance Rejection 🚫
Price is currently testing and rejecting the 105,800–106,500 resistance zone, previously a support turned resistance.
The rejection from this level adds further bearish confluence.
Downside Projection ⬇️📍
If the pattern plays out, the projected move shows a potential drop toward the major support zone at 100,000–101,000.
📌 Key Levels:
Resistance Zones:
105,800–106,500 🧱
109,500–111,000 🧱
Support Zone:
100,000–101,000 💚
🧠 Conclusion:
The chart suggests that BTC/USD is in a bearish continuation phase, with strong rejection from key resistance and a confirmed breakdown from a bearish flag. Traders should watch for confirmation of continuation below 104,500 to target the 100k support level. Risk management is crucial near volatile zones.

Good moment for try to Buy BTCGood moment for try to Buy BTC. Very good down movement and now we make small step of the up. This point can be point for start to move new up trend with update local highest high. Stop to previous local low bar. Will see...

BTC/USD: Weekend Strategy AnalysisBitcoin is currently fluctuating around $105,500, with volatility mainly driven by Middle East tensions.
After Israel's airstrikes on Iran, market panic spread, causing Bitcoin to drop below $103,000 yesterday. Over 250,000 leveraged investors worldwide were liquidated within 24 hours, totaling $1.16 billion in liquidations—predominantly long positions.
In the short term, geopolitical conflicts have triggered capital flight from high-risk assets. Traditional safe havens like gold and crude oil have surged, while Bitcoin has been sold off. Uncertainties over whether the Middle East situation will escalate or involve the U.S. are suppressing prices.
Long-term, institutions had forecast Bitcoin could reach $200,000 by the end of 2025 based on factors like the halving effect. Some listed companies and institutions maintain strategic positions. If the situation eases, prices may rebound.
BTC/USD
sell@106500-105500
tp:104000~103000
SL:107500
I am committed to sharing trading signals every day. Among them, real-time signals will be flexibly pushed according to market dynamics. All the signals sent out last week accurately matched the market trends, helping numerous traders achieve substantial profits. Regardless of your previous investment performance, I believe that with the support of my professional strategies and timely signals, I will surely be able to assist you in breaking through investment bottlenecks and achieving new breakthroughs in the trading field.

Lingrid | HYPEUSDT bullish Momentum Continuation LikelyKUCOIN:HYPEUSDT is consolidating after a breakout and forming a flag pattern, riding an established upward channel. Price has consistently respected the dynamic support from the trendline and the key horizontal level near 40.00. The recent higher low suggests momentum is intact for a bullish continuation toward the 49–50 target zone.
📈 Key Levels
Buy zone: 39.3–40.0
Sell trigger: breakdown below 39.0
Target: 50.0
Buy trigger: breakout above 43.0 with volume
💡 Risks
Failure to hold above 39.3 could invalidate bullish setup
Divergence signs may emerge on lower timeframes
Overall market sentiment could disrupt the clean trend formation
Traders, if you liked this idea or if you have your own opinion about it, write in the comments. I will be glad 👩💻

CHECK BTCUSD SIGNAL READ CAPTAINbtcusd sell now ✅
entry point (105.250) (105.150)
TAKE PROFIT 1: (104.750)
TAKE PROFIT 2: (104.200)
LAST TARGET (103.700)
STOP LOSS (105.800)

Eth longSimple idea here, if BTC gets stuck between the weekly range, then maybe ETH gets some traction.
There hasn't been a meaningful pullback since the last move up so we may see that move down soon or we follow BTC and move straight up fairly quickly after a shallow move down to sweep the lows
That whats I'm illustrating here, small sweep of the recent lows and then a move up to previous highs

LUNC/USDT is in Reversal LUNC/USDT is showing good trend line reversal with the divergence on the 4hr time frame looks good for buy at current price or it can be go for some small retracement on 1hr time frame

Bitcoin long 97kPlanning on a push below 100k over the next few days, I'll be looking for possible entry around 96 - 98k if LTF shows good support.
The monthly open is at 100k so Id expect to see some rejection at that level, there's also a monthly FVG around 97k which price could revisit.
My target will be the BTC highs, areas of interest marked on the chart.

SHIB/USDT is in Bullish TrendSHIB/USDT is looking good to go up side it is showing good retracement on daily chart and also showing bullish divergence on daily chart it can be buy current price or if some one want to be more sure then buy after new HH

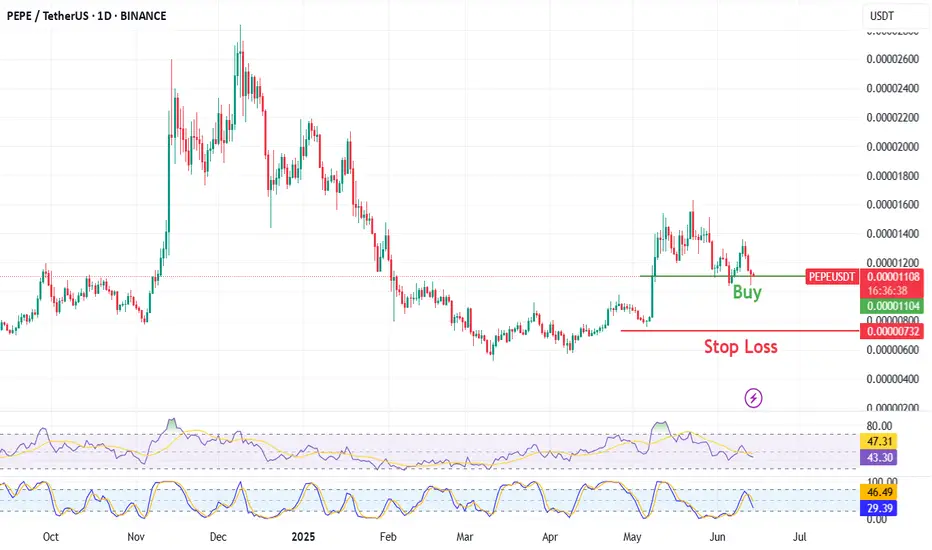
PEPE/USDTPEPE/USDT is looks good for buy it is showing retracement on daily chart and the 4hr chart also showing a good bullish divergence
Bitcoin dump to 102500 ...maybe loweerJust recently opened a short position on bitcoin. Aiming for 102500 tp.
Its very evident the market wants to fall.
Getting roughly 4RR from this given plays out.
Stop: $105735
Market is aiming for new lows according to my DTT analysis.

The Tell all of the conflict between Israel and Iran escalationBreak out of the top range and It's not looking good. Fall back into lower range and we should be gravy for awhile.
Not financial advice. DYOR
