"BTC to $108,800 – How Likely Is It?"Bitcoin is showing strong bullish momentum as key technical indicators align in favor of a major breakout. With increasing institutional interest, rising ETF inflows, and a favorable macroeconomic environment, BTC appears to be setting up for a potential rally toward the $108,800 level. Historical price action also suggests that once Bitcoin breaks past major resistance zones, it often surges rapidly. If the current support levels hold and buying pressure continues, the $108,800 target may be closer than expected.
Crypto market

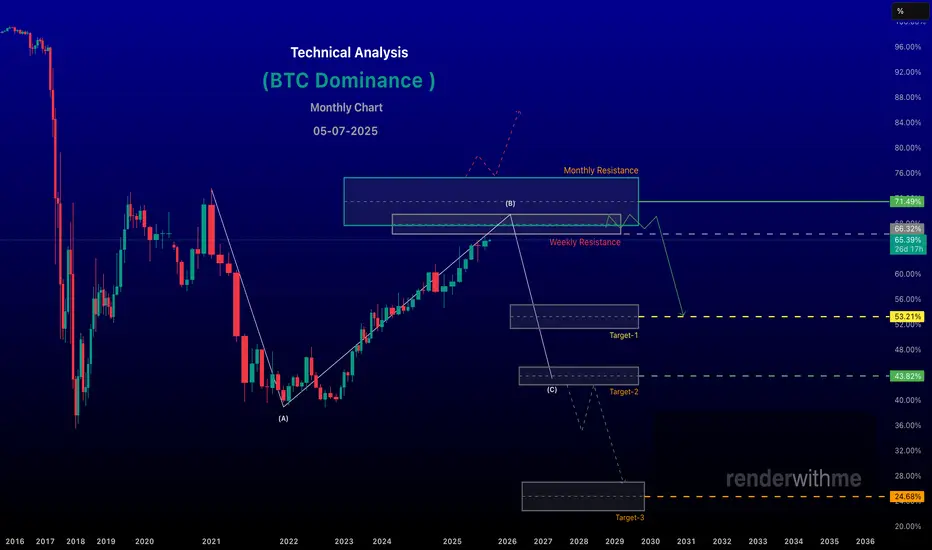
renderwithme | BTC - Dominance about to hit resistanceBitcoin dominance (BTC.D), which measures Bitcoin’s market capitalization as a percentage of the total cryptocurrency market cap, is a key indicator of market sentiment and capital flow between Bitcoin and alt coins . As of July 5, 2025, recent data and technical analysis suggest Bitcoin dominance is at a critical juncture, with potential shifts in market dynamics for the upcoming week. Below is an analysis based on current trends, historical patterns, and technical indicators.Current State of Bitcoin DominanceCurrent Level: Bitcoin dominance is approximately 64.36% to 65.68%, based on recent data .
Recent Trends: Dominance has been testing a multi-year resistance zone between 66.5% and 69.5%
Historical highs in this range (e.g., 64.34% in early 2025) have often preceded pullbacks or altcoin rallies.
Chart indicate bearish signals, such as weekly bearish divergences and potential reversal candles, suggesting a possible decline.
Technical Analysis for Next WeekResistance and Support Levels:Resistance: The 66.8%–67.2% zone is a critical resistance level, aligning with Fibonacci extensions and a long-term descending trend line. A failure to break above this could signal a reversal.
Support: Key support levels are at 61.90%–62.20%, with a potential drop to 58% if bearish momentum accelerates.
Chart for your reference
Disclaimer --
This analysis is based on recent technical data and market sentiment from web sources. It is for informational purposes only and not financial advice. Trading involves high risks, and past performance does not guarantee future results. Always conduct your own research or consult a SEBI-registered advisor before trading.
#Boost and comment will be highly appreciated
BONK/USDT Forms a Bullish Pattern, Is $0.00003, the Next PitstopBonk (BONK), Solana’s breakout memecoin, is once again attracting market attention as it gains upward momentum amid fresh hype surrounding potential ETF exposure and token burn events. Trading at approximately $0.00001874, BONK has climbed steadily in recent sessions, rising over 20% from weekly lows near $0.0000158—an encouraging sign for meme-token bulls.
Despite the recent selling pressure, the BONK price remains within bullish influence as the token surges $0.00001558 and $0.00001627
The momentum is rising as the price is approaching the upper resistance of the Gaussian Channel, and a rise above the range could flip the prevailing bearish trend
On the other hand, the CMF is rising and sustaining above 0, hinting towards the rise in the money flow onto the platform
Therefore, if the BONK price manages to rise above the channel, it may reach the neckline of the double-bottom pattern at $0.00002776, slicing above the pivotal resistance between $0.00002495 and $0.00002632

BTC/USDT Back Test Perhaps it's not surprising to say that I see a chance to put the $99,000 zone back in the test. Just because of the FVG. Even if it doesn't happen, I see an upward trend now.

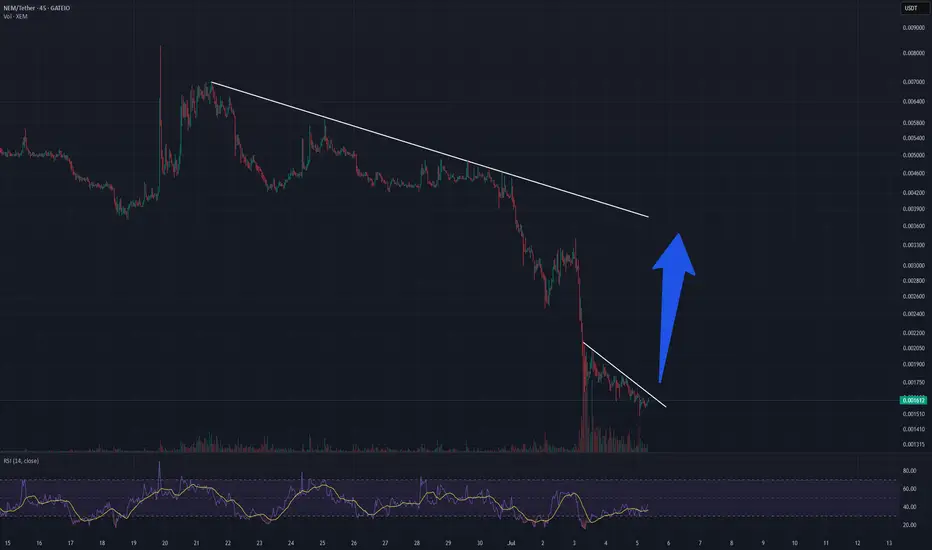
XEM pump past downtrendDelisting from the IObit exchange caused a strong price drop, the project is alive, several wallets have large amounts, someone here will try to pump it strongly and return to 0.0042
SOL USDT CAN BE BULLISH IN A WEEK Just my opinion not make tradeAt the time Sol USDT will trade in 147.50
My analysis this is spot level
I am not recommending to buy but I think this is the best move for sol

$REX/USDT Breakout Incoming.NYSE:REX has broken out of its downtrend and reclaimed the 20-day moving average, signaling a potential trend reversal.
With a target showing 122% upside, the setup looks bullish as long as the price holds above the 0.0074 support zone.
DYRO, NFA

BTCUSD is ranging in narrow zone alighning broad equiti marketBTCUSD is ranging in narrow zone alighning broad equiti market

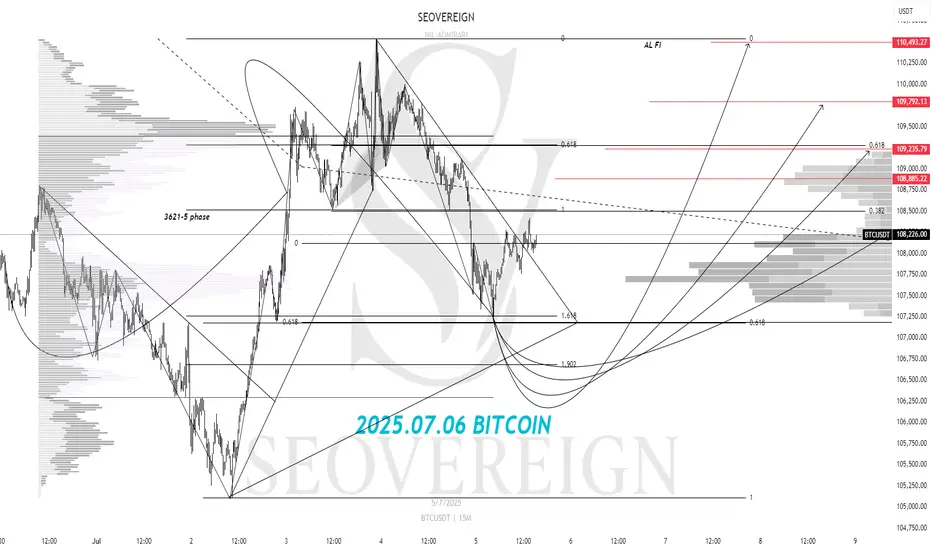
[SeoVereign] BITCOIN Bearish Outlook – July 6, 2025We are the SeoVereign Trading Team.
With sharp insight and precise analysis, we regularly share trading ideas on Bitcoin and other major assets—always guided by structure, sentiment, and momentum.
🔔 Follow us to never miss a market update.
🚀 Boosts provide strong motivation and drive to the SeoVereign team.
--------------------------------------------------------------------------------------------------------
Hello,
This is SeoVereign.
As of July 6, 2025, I present a bullish outlook on Bitcoin.
It has been a while since I last shared a long position perspective.
Those of you who have consistently followed SeoVereign’s ideas would know that, until now, most of the entry points have been centered around short positions. We have closely tracked the market, identifying opportunities amid the downtrend.
However, after comprehensively analyzing the recent overall market atmosphere, we have come to the conclusion that upward pressure is gradually increasing rather than downward pressure. After reviewing technical indicators and wave structures, we have determined that it is reasonable to consider a buy — in other words, a long position — at this stage.
The first target for this idea is set at an average of around 109,500 . This figure is based on a comprehensive judgment that includes the current wave structure, previous key support/resistance zones, and momentum trends. Of course, this target may be flexibly adjusted depending on how the market develops, and if necessary, the rationale will be clearly revised accordingly.
As always, we will continue to track this idea and refine our logic based on the real-time developments and structures, further solidifying the grounds for the long bet.
Wishing you continued good fortune.
BTC : Looking at the supplyPrice is stalling at the D @ 108,800 for some time now.
I think it is not because of a lack of demand. Just that there is no one selling. Owners prefer to keep the limited supply. Buyers are unwilling to chase after the few available at a higher price. We have a stalemate.
In 2022, to break this stalemate, price needs to drop, with sellers taking a profit and making supplies available. Then we will have buyers scrambling again to BUY.
Watch the OBV.
So, I should wait to BUY, but at the right price.
Good luck.

Btcusd techinical analysis.Btcusd techinical analysis next move psibale at h1 time frame.not finchinal advice.

WIF/USDT NeoWave Analysis (Daily, Range-Based Chart)
🔍 WIF/USDT NeoWave Analysis (Daily, Range-Based Chart)
Based on a range-based (constant range bar) chart, this analysis follows Glenn Neely’s NeoWave principles for identifying complex corrective and impulsive structures:
🌀 Wave Count Summary:
1. Initial Impulsive Wave (Wave A?)
Strong bullish movement with high volume around March–May.
Likely the start of a terminal pattern (e.g., Leading Diagonal or Expanding Triangle).
2. Prolonged Correction (Wave B?)
Large, noisy sideways correction through the summer.
Structure appears to be a complex correction (possibly WXY or WXYXZ).
3. Second Sharp Rally (Wave C or E?)
Intense bullish move in November, but quickly reversed.
Could be Wave C of a Flat or Wave E of an Expanding Triangle.
4. Final Drop (Wave C of Higher Degree)
Strong decline into February 2025, likely completing the entire corrective pattern.
Appears impulsive, suggesting a terminal wave.
5. Current Phase – Base Building
Price consolidating near historical support (~$0.65–$0.85).
Potential beginning of a new bullish cycle (Wave 1 or A forming).
📌 Key Levels:
Support Zone: $0.50–$0.65
Resistance Zone: $1.10–$1.30
Breakout above resistance with strong volume may confirm the start of a major bullish wave (Wave 3 or C).
📈 Bias: Accumulation and base-building phase with bullish breakout potential if resistance

Btc looks quite bearish from the 15 minutes timeframe- sellPrice is currently forming a bearish continuation pattern and this provides us with a sell opportunity from the lower timeframe perspective. A sell opportunity is envisaged

avaxusdtavaxusdt looks like making a 12 set up .invalidation level for long is 14.65 . correction seems complete .never trade without a stoploss

Long opportunity in BTC/USDT.PSThe 107963.44 level has already been broken. So we need to wait to retest the same level.
Reasons : -
1. 30 MIN BOS Breakout.
2. it retested the fibonocci 0.611 level.
Entry : 107963.44
TP : 109065.90
SL : 107415.57
Disclaimer : I'm not recommending to take this entry. Do with your analysis too.

SOL SCALP SetupSOl can retrace to 175$ on ltf, must use sl before taking any trade. Market is too volatile now


Link short setup tradeAS previous short setup hits the tp but actually first manipulation to hit the sl, now closely monitor the trade and manually close if 4hr candle closes above the mentioned point, overall I'm bearish on whole market, needs to take a correction before another leg up, until unless usdt.d breaks and closes below 4.59% on 4hrs tf market is bearish, you need to take short position intsead of long positions, when usdt.d reaches 4.63% open short on link, inj, eth and btc and hold till 4.80%-4.89%. I will open long if we break 4.59% and retest this, other scenario if we reaches 4.80-4.90% first no long positions for me from here.

ETH Short setupETH showing some weakness, manual SL if 4hrs candle closes above the mentioned point then must close the trade don't hold and wait for the new setup.

Aptos Long Term ViewAptos taken out almost all liquidation from below side, it can fall more towards 3.5$ to take out all new buyers and then push towards 15$, remember 15-16$ is an unmitigated zone, sooner or later this imbalance zone will be filled. So if your an investor and want easy 3x gain then buy apt from 5$ 2nd entry 4$ and last buying from 3.5$, ignore lower timeframe volatility and BTC movement, these entries are easily achievable if market crashes by any chance so you can close your position at breakeven. While 7.19-7.50$ area is crucial to break, once this zone is broken there is nothing upside that can stop Aptos from hitting 15$. Any daily candle closing above the marked zone will confirm trend shift, before this trade setup is like high risk n reward. While I'm very confident on Aptos that it will hit 15% mark.

SUI swing long- golden cross stoch W
- bullish flag.
- support hold price SnR
- Support confluence with fib 0.7
- BTC price remain strong, about to break out
- Price at demand area

BTC SCALP Tradeas long as BTC doesn't closes below the mentioned area on 1hr tf, it will bounce and hit the fresh sellers SL. Once we have a closing below the area it can take correction upto 98-97K area.

LTC Short SetupWait for the entry and execute, SL is smaller and if candle closes strongly above the zone then must close the trade. Hopefully it won't break easily this zone as bearish fvg + bearish order block lies here.
