Bearish opportunityThere is a H&S pattern that is currently in play, the sell movent has already started but its still in its initial stages.
A sell position current with a stop loss slitely above 0.1875 and a take profit at 0.00712 would be most ideal.
A conservative trader can go with the most recent structure which would be a continous bearish pattern,if and only if you wait for a retest or volume to the down side and enter then but with a bigger stop loss.
Crypto market

SEI/USDT Poised for a Major Breakout – Will It Surge Toward $0.7📊 Full Technical Analysis:
The SEI/USDT daily chart reveals a compelling setup with strong breakout potential. Here's a detailed breakdown:
🔍 Pattern & Key Structure:
Descending Trendline Breakout: SEI has successfully broken out of a long-term descending trendline that has suppressed price action since December 2024 — a strong early signal of a bullish reversal.
Bullish Retest in Progress: The price is currently retesting the breakout area, aligning with a historical demand zone and Fibonacci retracement levels of 0.5 ($0.2468) and 0.618 ($0.2259).
Previous Consolidation Zone: SEI previously moved sideways within a yellow box between $0.18 – $0.25. The breakout from this zone adds bullish confirmation.
🟢 Bullish Scenario:
If SEI holds above the key demand zone ($0.2259 – $0.2468), a strong rally could follow, targeting these Fibonacci resistance levels:
🔸 $0.3068
🔸 $0.3367
🔸 $0.4696
🔸 $0.5438
🔸 $0.6086
🔸 $0.6500
🔸 Final target: $0.7013 (major resistance)
This scenario is validated by a higher low formation and a continuation of the current uptrend, especially if backed by strong volume.
🔴 Bearish Scenario:
If the price breaks below the demand zone ($0.2259 – $0.2468), further downside may be expected, with potential support levels at:
🔻 0.786 Fibonacci at $0.1961
🔻 Historical support zones at $0.18 and $0.13
A bearish breakdown would invalidate the bullish structure and suggest sellers remain in control.
📐 Pattern Summary:
Pattern Type: Descending Trendline Breakout + Bullish Retest
Validation: Retest aligned with Fibonacci & prior consolidation
Bias: Bullish, as long as the price holds above $0.2259
📝 Conclusion:
SEI/USDT is showing early signs of a bullish reversal after a breakout from its long-term downtrend. A continuation toward higher Fibonacci levels is likely if the price holds the key demand zone. Traders should watch for bullish confirmation signals near support before entering.
#SEI #SEIUSDT #CryptoBreakout #BullishSetup #TechnicalAnalysis #FibonacciTrading #CryptoSignals #AltcoinSeason #ChartPattern #CryptoTA

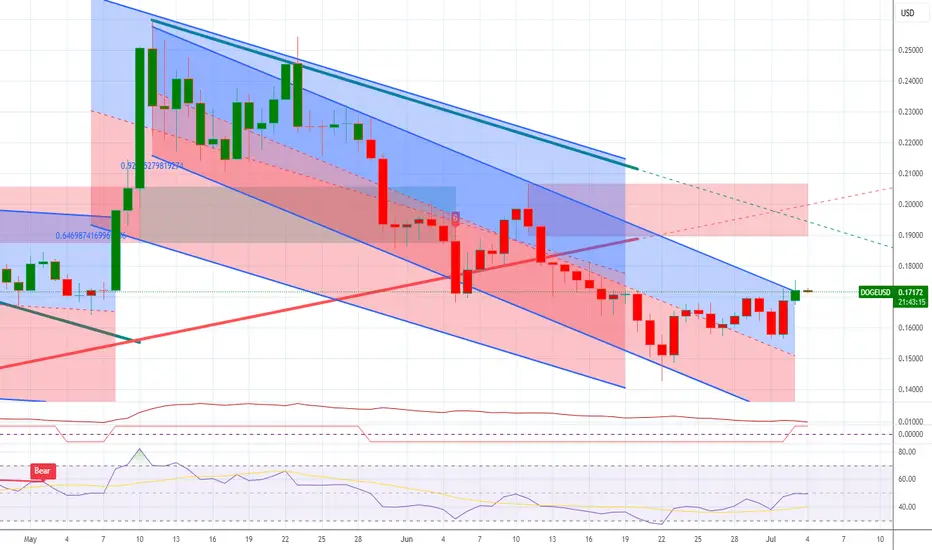
doge correction im simplify looking for a break-out above 0.25 in order to confirm a bullish reversal until this happens i will remain bearish and am looking for a bottom at 0.08 this is my worst case .

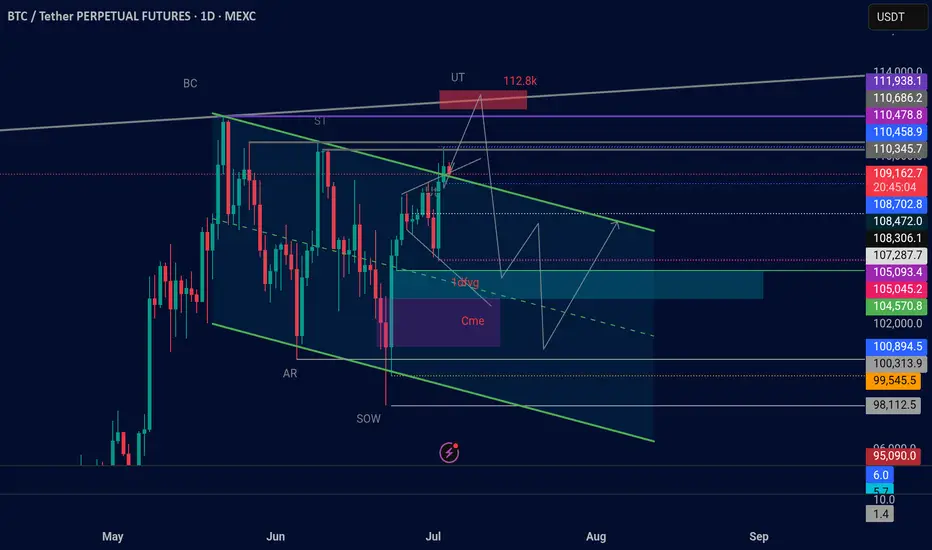
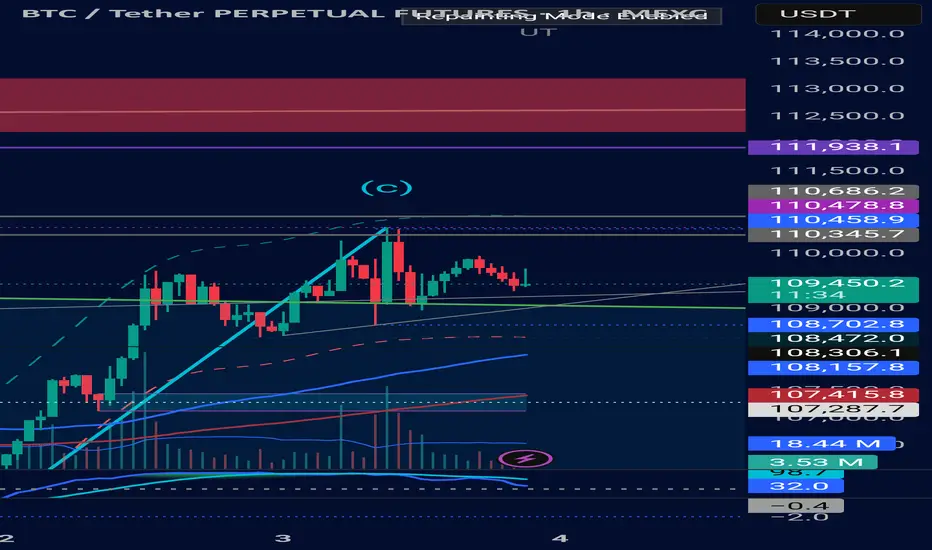
BTC Wyckoff distribution idea...Based on the Wyckoff distribution methodology, the current chart suggests an upward trajectory, considering the presence of unfilled CME and FVG gaps. The anticipated scenario involves a continuation of the UT phase, potentially reaching targets around 112k/113k, followed by a correction towards the CME gap at approximately 102.5k.
Subsequently, a continuation into the UTA phase is expected, which may indicate the conclusion of the bull market.
RSR/USDT Breakout Play – Approaching a Major Reversal
🧠 Full Technical Analysis (Timeframe: Daily)
RSR/USDT is at a crucial decision point after months of consolidation.
The price action has been forming a classic Descending Triangle pattern, a structure that often precedes major breakouts or breakdowns. As we approach the apex of the triangle, RSR is now testing a descending resistance trendline that has capped prices since December 2024.
🟢 Bullish Scenario: Breakout Toward an Explosive Rally
If the price successfully closes above $0.0083 with strong volume confirmation, it could trigger a trend reversal and unlock a potential multi-phase rally.
🎯 Potential Bullish Targets:
Target 1: $0.0106 – Minor resistance and possible initial take-profit zone.
Target 2: $0.0122 – Last major distribution zone before the previous breakdown.
Target 3: $0.0170 – Strong historical resistance and psychological level.
Max Extension: $0.0259 – $0.0270 – Could be reached if the breakout gains momentum, potentially delivering over +200% upside from the current level.
📈A clean breakout could attract both retail and institutional buyers, leading to significant upside in the short to mid-term.
🔴 Bearish Scenario: Fakeout and Deep Correction Risk
If RSR fails to break out and gets rejected at the trendline resistance, we could see a pullback or bearish continuation. Key support levels to watch include:
🔻 Possible Downside Levels:
Support 1: $0.0072 – Current horizontal base of the triangle.
Support 2: $0.0060 – Previously tested demand zone.
Major Support: $0.0044 – Yearly low and strong bounce zone if panic selling occurs.
📉A rejection at the trendline could open up short-term downside of 30-40%.
🧩 Pattern Highlight: Descending Triangle (Breakout Imminent)
✅ Dynamic Resistance: Downtrend line from December 2024.
✅ Horizontal Support: Around $0.0070 holding firmly.
🚨 Breakout Approaching: Watch for a daily close above resistance.
📌 Confirmation: Breakout should be supported by increased volume to be valid.
🧠 Strategic Notes:
Always confirm breakout with volume and candle close.
Breakout setups like this offer high R:R swing trade opportunities.
Use proper risk management around key levels.
🔍 Conclusion:
RSR is facing a make-or-break moment after months inside a descending triangle. A breakout above resistance could ignite a powerful rally, while a rejection might trigger another wave of correction.
Breakout or Breakdown? The next few candles may decide everything. Stay ready.
#RSR #RSRUSDT #CryptoBreakout #DescendingTriangle #AltcoinSetup #TradingSignal #CryptoAnalysis #BreakoutPlay #CryptoCharts #CryptoTechnical

Phemex Analysis #94: Pro Tips for Trading MooDeng (MOODENG)MooDeng ( PHEMEX:MOODENGUSDT.P ) is a playful, Solana-based meme coin inspired by a charming pygmy hippopotamus born at Thailand’s Khao Kheow Zoo. Since its debut in 2024, MOODENG has quickly captured crypto enthusiasts' imaginations, gaining prominence through explosive price surges and a rapidly growing community.
Recently, MooDeng’s market presence surged dramatically following its listing on Upbit, one of South Korea’s largest cryptocurrency exchanges. Upbit added trading pairs with KRW, BTC, and USDT, leading MOODENG’s price to spike by over 70%, while liquidity and trading volume increased by a staggering 600%, elevating its market capitalization beyond $200 million.
This newfound liquidity and heightened market attention bring exciting yet challenging trading conditions. To navigate these effectively, let’s explore several scenarios that traders should consider in the near term.
Possible Scenarios
1. Bullish Continuation (Extended Rally)
The recent Upbit listing provided significant bullish momentum, which might continue propelling MOODENG’s price upward. If buying pressure remains strong and price confidently holds above immediate support $0.165, the rally could extend toward higher resistance levels.
Pro Tips:
Monitor Key Resistance Levels: Keep an eye on critical short-term resistance zones $0.234 and $0.2676. Consider partial profit-taking at these levels to safeguard gains.
Entry and Risk Management: Look for price consolidations or small retracements as potential entry points. Always set stop-losses below recent support areas to minimize downside risk.
2. Price Consolidation (Sideways Movement)
After substantial upward movement, MooDeng might enter a period of consolidation as the market absorbs recent gains. Consolidation typically involves price fluctuating within a defined range, testing support $0.165 and resistance $0.206 repeatedly before the next significant move.
Pro Tips:
Range Trading: Implement range-trading strategies by identifying clear support and resistance levels, taking advantage of repeated price movements within these bounds.
Volume Analysis: Carefully observe trading volumes during consolidation phases. Declining volumes typically indicate a healthy pause before a potential next leg upward or downward breakout.
3. Bearish Correction (Pullback Scenario)
Following significant rallies, sharp pullbacks can occur as traders take profits, particularly in meme coins known for volatility. If MOODENG breaks below recent key support levels $0.165 with substantial trading volume, it might signal a bearish correction, returning the price toward lower support areas.
Pro Tips:
Identify Support Zones: Carefully monitor established support levels $0.133 or $0.12 for potential accumulation or buying opportunities. Significant pullbacks could present strategic entry points for long-term believers.
Stay Cautious: Avoid hastily entering trades during strong bearish momentum; instead, wait patiently for clear signs of price stabilization before taking new positions.
Conclusion
MooDeng’s recent explosive growth following the Upbit listing presents traders with numerous opportunities. By carefully monitoring outlined scenarios—considering bullish continuation, consolidation, and potential pullbacks—traders can effectively manage risk while capitalizing on MOODENG’s volatility. Stay disciplined, remain responsive to market dynamics, and always practice strategic risk management to maximize your trading success with MooDeng.
🔥 Tips:
Armed Your Trading Arsenal with advanced tools like multiple watchlists, basket orders, and real-time strategy adjustments at Phemex. Our USDT-based scaled orders give you precise control over your risk, while iceberg orders provide stealthy execution.
Disclaimer: This is NOT financial or investment advice. Please conduct your own research (DYOR). Phemex is not responsible, directly or indirectly, for any damage or loss incurred or claimed to be caused by or in association with the use of or reliance on any content, goods, or services mentioned in this article.

$Bitcoin going to a Million $USD ? Happy 4th of July !May this 4th of July mark the Day of your Independence !
They say that the human brain has no parallels to its capacity for pattern recognition.
I say it is not the brain, but the mind that recognizes the pattern ... the consciousness behind it.
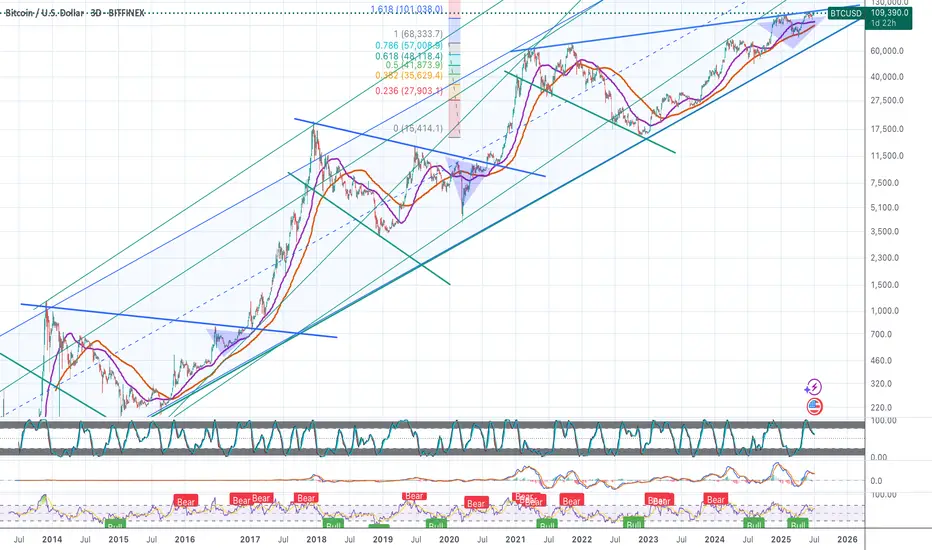
This chart shows the last 3 cycles ... we are just entering the 4th parabolic move, and I believe it will start when CRYPTOCAP:BTC crosses $113.5k USD per coin ... very soon indeed !
Many will say, but what happened to the 4 year cycle ? Isn't it scheduled to finish this October ?
Well, I am no expert but it would appear that the cycle has lenghtened, at least this time around. Proof of it is the CRYPTOCAP:ETH chart ... the second biggest crypto by market cap.
A few factors that you may consider, that perhaps affected the global business cycle, let's say they helped to delay it: the effect of Covid in 2020 and 2021, and as well the tariffs issue in 2025. What does this mean ?
Well, physically it means that with the economies running very slow in these two mentioned instances, the ECONOMIC WORK globally stalled.
Is it therefore any surprise that the "cycle" lenghtened, or slowed, this time around ?
Let's see what happens when the BBB makes BRRRR ... !
Enjoy !

DOGE LONG- DIvergence price with stoch
- price at demand area
- BTC possible break out
- stoch W and M oversold

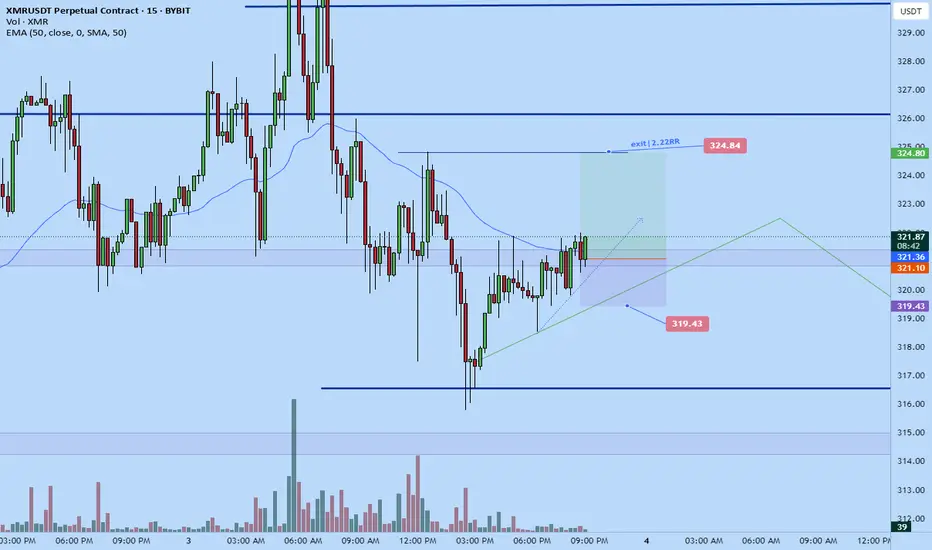
Monero long to $324.84Just recently opened up a long position on monero. Targeting $325
2RR trade.
Time sensitive
DTT setup
Btc Wyckoff distribution Based on the Wyckoff distribution methodology, the current chart suggests an upward trajectory, considering the presence of unfilled CME and FVG gaps. The anticipated scenario involves a continuation of the UT phase, potentially reaching targets around 112k/113k, followed by a correction towards the CME gap at approximately 102.5k. Subsequently, a continuation into the UTA phase is expected, which may indicate the conclusion of the bull market.
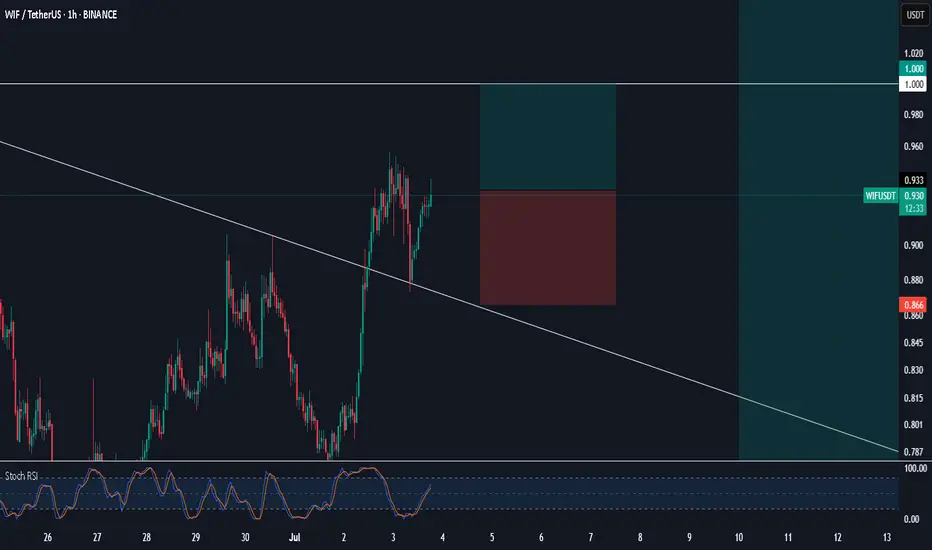
$wif got in on that retest
targeting $1.5-$1.8 for now as we pump 7% and reclaim key level
fireworks incoming as for most of the coins
will try and time the cycle and rotate
for now memes , large caps , mid caps then maybe micro cap exposure or get ready to short alts or long bitty for its bounce from range low
am of the mind that dominace has had its run and we for a distribution range which is our alt season ... took only 4 years to materalise so step on the gas people .. then we bleed and wait for 80% correction to buy back in a few years .. this is where i stand so for now time to make it all back and more cycles get more and more interesting so dont be shocked if things moves quicker the same way they make us cry on the way down they should overextend on the way up.. well most of them ! have a nice day people and remove that self doubt yolo
xcn scalp long to $0.014619Opened a scalp long on xcn a while ago.
Aiming for $0.014619
Time sensitive
2RR

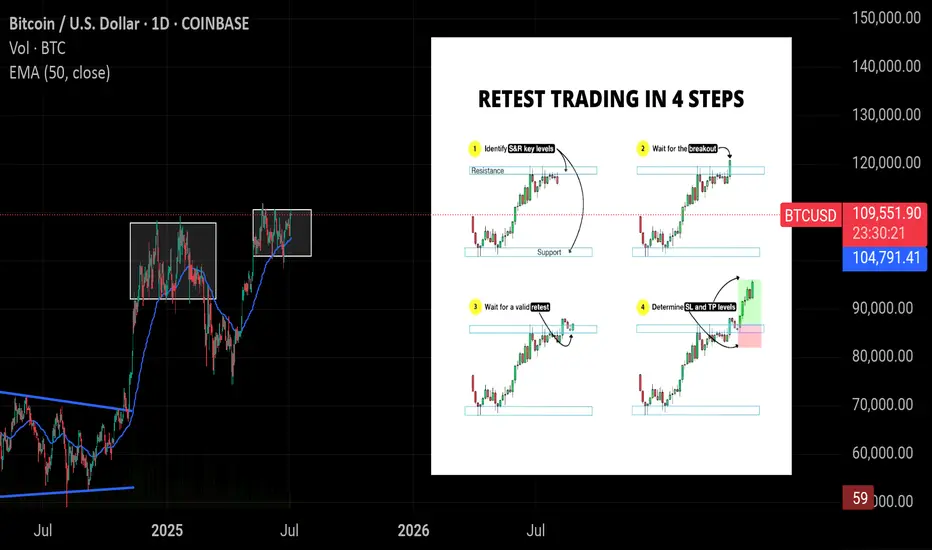
Mastering Breakout Trading: The 4-Step Precision Guide
1. 🔍 Spot the Key Zones (S&R)
Identify strong Support & Resistance levels — areas where price consistently reverses or stalls. These zones are critical for planning trades.
2. 🚀 Breakout Confirmation
Don’t rush — wait for the price to cleanly break above resistance or below support. This signals potential trend initiation.
3. 🔁 The Golden Retest
After the breakout, wait for price to revisit the broken level and show strength (like a bullish candle) — this validates the breakout.
4. 🎯 Set Smart SL & TP
Define your Stop Loss just beyond the invalidation level and Take Profit based on risk-reward or nearby price targets.
Tip: Patience is your edge — wait for structure, confirmation, and clean signals.
Enter on the bounce from the retest zone, typically when a green candle or bullish pattern forms — it confirms trend continuation.
#Educational
NZDUSD wave 4 south might be over!1). Volume spiked with very likely long positions! 2). Banks are "Buying!" 3). Correction is likely over! 4). The price action broke trend! 5). Looks like 200% off the bottom is in store for the rise @ .61354!

$aave/usdt short zonesth:
intraday short zone: htf + ltf liq + htf 78.6 fib + sh
swing short zone: htf + ltf liq + ote zone + bat & butterfly bearish harmonic

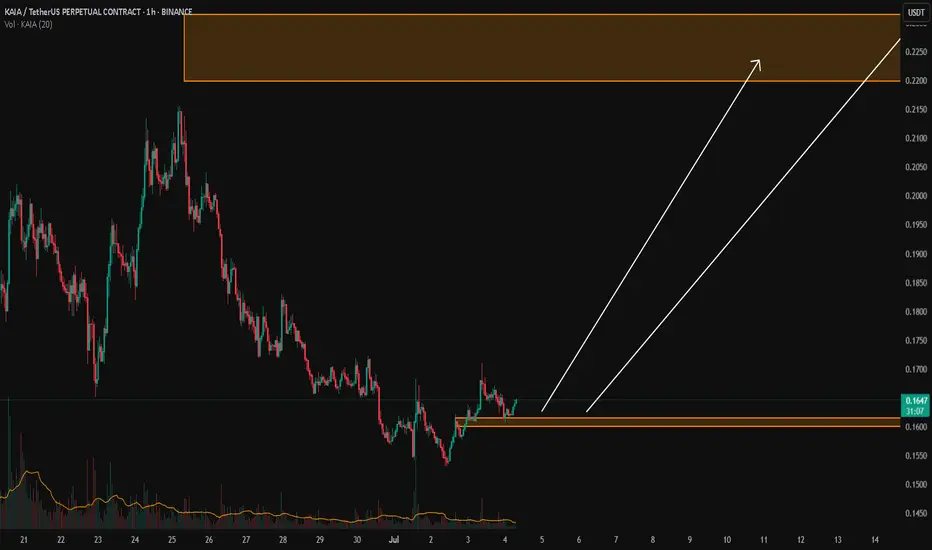
KAIA/USDTKey Level Zone: 0.1600 - 0.1615
LMT v2.0 detected.
The setup looks promising—price previously trended upward with rising volume and momentum, then retested this zone cleanly. This presents an excellent reward-to-risk opportunity if momentum continues to align.
Introducing LMT (Levels & Momentum Trading)
- Over the past 3 years, I’ve refined my approach to focus more sharply on the single most important element in any trade: the KEY LEVEL.
- While HMT (High Momentum Trading) served me well—combining trend, momentum, volume, and structure across multiple timeframes—I realized that consistently identifying and respecting these critical price zones is what truly separates good trades from great ones.
- That insight led to the evolution of HMT into LMT – Levels & Momentum Trading.
Why the Change? (From HMT to LMT)
Switching from High Momentum Trading (HMT) to Levels & Momentum Trading (LMT) improves precision, risk control, and confidence by:
- Clearer Entries & Stops: Defined key levels make it easier to plan entries, stop-losses, and position sizing—no more guesswork.
- Better Signal Quality: Momentum is now always checked against a support or resistance zone—if it aligns, it's a stronger setup.
- Improved Reward-to-Risk: All trades are anchored to key levels, making it easier to calculate and manage risk effectively.
- Stronger Confidence: With clear invalidation points beyond key levels, it's easier to trust the plan and stay disciplined—even in tough markets.
Whenever I share a signal, it’s because:
- A high‐probability key level has been identified on a higher timeframe.
- Lower‐timeframe momentum, market structure and volume suggest continuation or reversal is imminent.
- The reward‐to‐risk (based on that key level) meets my criteria for a disciplined entry.
***Please note that conducting a comprehensive analysis on a single timeframe chart can be quite challenging and sometimes confusing. I appreciate your understanding of the effort involved.
Important Note: The Role of Key Levels
- Holding a key level zone: If price respects the key level zone, momentum often carries the trend in the expected direction. That’s when we look to enter, with stop-loss placed just beyond the zone with some buffer.
- Breaking a key level zone: A definitive break signals a potential stop‐out for trend traders. For reversal traders, it’s a cue to consider switching direction—price often retests broken zones as new support or resistance.
My Trading Rules (Unchanged)
Risk Management
- Maximum risk per trade: 2.5%
- Leverage: 5x
Exit Strategy / Profit Taking
- Sell at least 70% on the 3rd wave up (LTF Wave 5).
- Typically sell 50% during a high‐volume spike.
- Move stop‐loss to breakeven once the trade achieves a 1.5:1 R:R.
- Exit at breakeven if momentum fades or divergence appears.
The market is highly dynamic and constantly changing. LMT signals and target profit (TP) levels are based on the current price and movement, but market conditions can shift instantly, so it is crucial to remain adaptable and follow the market's movement.
If you find this signal/analysis meaningful, kindly like and share it.
Thank you for your support~
Sharing this with love!
From HMT to LMT: A Brief Version History
HM Signal :
Date: 17/08/2023
- Early concept identifying high momentum pullbacks within strong uptrends
- Triggered after a prior wave up with rising volume and momentum
- Focused on healthy retracements into support for optimal reward-to-risk setups
HMT v1.0:
Date: 18/10/2024
- Initial release of the High Momentum Trading framework
- Combined multi-timeframe trend, volume, and momentum analysis.
- Focused on identifying strong trending moves high momentum
HMT v2.0:
Date: 17/12/2024
- Major update to the Momentum indicator
- Reduced false signals from inaccurate momentum detection
- New screener with improved accuracy and fewer signals
HMT v3.0:
Date: 23/12/2024
- Added liquidity factor to enhance trend continuation
- Improved potential for momentum-based plays
- Increased winning probability by reducing entries during peaks
HMT v3.1:
Date: 31/12/2024
- Enhanced entry confirmation for improved reward-to-risk ratios
HMT v4.0:
Date: 05/01/2025
- Incorporated buying and selling pressure in lower timeframes to enhance the probability of trending moves while optimizing entry timing and scaling
HMT v4.1:
Date: 06/01/2025
- Enhanced take-profit (TP) target by incorporating market structure analysis
HMT v5 :
Date: 23/01/2025
- Refined wave analysis for trending conditions
- Incorporated lower timeframe (LTF) momentum to strengthen trend reliability
- Re-aligned and re-balanced entry conditions for improved accuracy
HMT v6 :
Date : 15/02/2025
- Integrated strong accumulation activity into in-depth wave analysis
HMT v7 :
Date : 20/03/2025
- Refined wave analysis along with accumulation and market sentiment
HMT v8 :
Date : 16/04/2025
- Fully restructured strategy logic
HMT v8.1 :
Date : 18/04/2025
- Refined Take Profit (TP) logic to be more conservative for improved win consistency
LMT v1.0 :
Date : 06/06/2025
- Rebranded to emphasize key levels + momentum as the core framework
LMT v2.0
Date: 11/06/2025
AAVE Potential 1-2/1-2I´m keeping an eye on a quick pullback on AAVE for a potential 1-2/1-2.
The thesis is that black 2 finished in the 50% pullback and we´re currently finishing blue 1.
Blue 2´s pullback would be a great opportunity for long trades with a very tight stop loss.
The gray zone, with gave us a fake breakout for black 1, may be the temporary resistance for blue 1.

TP 138500 Locked Gold since bouncing from 74500 K btc in swing upwards pressure 1st target 🎯 is 138500 K to then drop or correction before continuation to 260 K get ready

BTC breakoutIf the daily candle closes above the trendline, a breakout toward a new all-time high is likely to occur very soon.

