You Are Getting Ripped Off On XRP.Look at the massive volume the last year. Look at the news and how this has gone mainstream.
SEC, Potential ETF, Trump elected, Government acceptance etc...
And yet it still cant break 2018 highs.
One would thing with all the bagholders since 2018 highs $3.84. All that new money coming in tokens would be scarce and mixed with the constant positive news, a new all time high should have been met a long time ago..
Crypto market
Pol (POL): 3 Good Trading Setups We Caught | July 2025POL coin is in a pretty volatile spot where we might get a really good trade from here once we see the confirmations we talked about in the video. 3 good trading opportunities, where the mid-term trade looks the best out of them all!
P.S. idk why but called Pol coin polyatomic multuple times so do not pay attentions to that :)
More in-depth info is in the video—enjoy!
Swallow Academy

BITCOIN Will it go lower?Bitcoin (BTCUSD) pulled back rather aggressively yesterday after marginally breaking above $123000 and making a new All Time High (ATH).
We've mentioned before the similarities of this Bullish Leg to the April - May structure and so far the current pull-back having already touched the 0.236 Fibonacci retracement level, resembles the late April pull-back.
However, besides the 0.236 Fib, that pull-back also hit its 4H MA50 and rebounded, so that's a condition that hasn't been fulfilled. If it does, we are potentially looking for a Low around the $115k mark. Notice also how both fractals are supported by a Higher Lows trend-line exactly on their respective 4H MA100 (green trend-line) levels.
If BTC continues to replicate this pattern, we expect to see $140000 (+43.05% from the bottom) by early August.
Will the Support levels hold and push it that high? Feel free to let us know in the comments section below!
-------------------------------------------------------------------------------
** Please LIKE 👍, FOLLOW ✅, SHARE 🙌 and COMMENT ✍ if you enjoy this idea! Also share your ideas and charts in the comments section below! This is best way to keep it relevant, support us, keep the content here free and allow the idea to reach as many people as possible. **
-------------------------------------------------------------------------------
💸💸💸💸💸💸
👇 👇 👇 👇 👇 👇

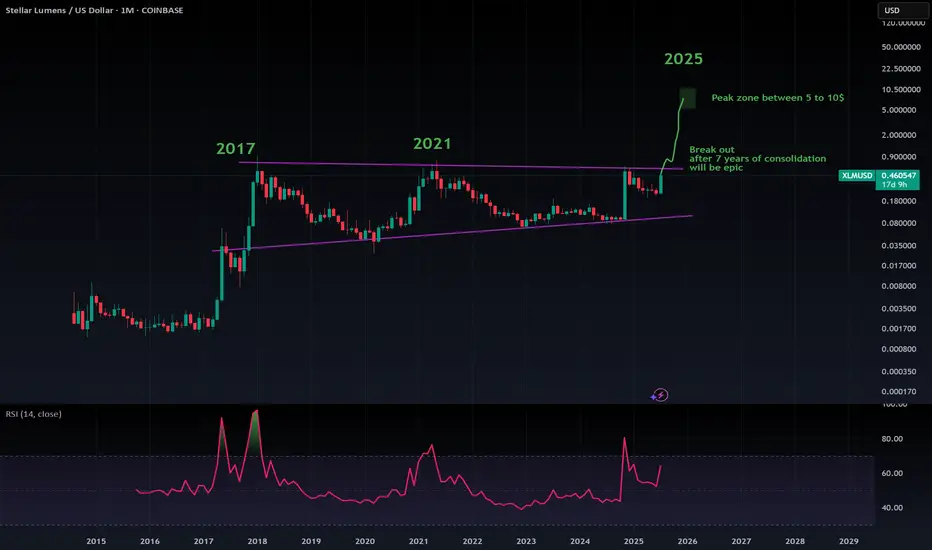
XLM ready for break outXLM same story with XRP and LTC.
Super long consolidation pattern about to ripe off.
The easiest 10x opportunity you can find these days.
A no brainer
BTC Rebounds From Channel Support With Critical Levels In Focus BTC Rebounds From Channel Support With Critical Levels In Focus 🟢📉
Structure remains firmly bullish, and price action is still unfolding within our previous analysis. After the breakout above the yellow trendline, BTC has entered a new ascending channel, and we’re now testing the lower boundary of this rising structure.
The main support sits at 114,921, the level from which the breakout occurred—an essential zone that may or may not be revisited. Based on market behavior and momentum, I currently do not expect this level to be retested, but it's one that must always be respected.
🟩 A deeper correction could lead us toward the previous ascending channel support near 112,400. This would be the last resort for bulls to hold structure intact.
⚠️ A break below 112K changes the narrative completely. That would mean we’re stepping into a potential trend reversal zone—so the market could be setting up for something more significant if that unfolds.
That said, my expectation leans toward a rebound from current levels. The sell-off may have flushed out late long entries, creating space for renewed bullish momentum. Let’s follow the levels and trade what we see—not what we feel.
One Love,
The FXPROFESSOR 💙
Disclosure: I am happy to be part of the Trade Nation's Influencer program and receive a monthly fee for using their TradingView charts in my analysis. Awesome broker, where the trader really comes first! 🌟🤝📈

Can Ripple hit $3.40 with 15% upside soon?Hello✌
let’s dive into a full analysis of the upcoming price potential for Ripple📈.
BINANCE:XRPUSDT is poised to challenge the $3.40 level soon, supported by a notable increase in market volume 📊. This price zone also coincides with a key support area aligned with sharp Fibonacci levels, offering a strong base for potential upward movement 🔥.
✨ Need a little love!
We pour love into every post your support keeps us inspired! 💛 Don’t be shy, we’d love to hear from you on comments. Big thanks , Mad Whale 🐋

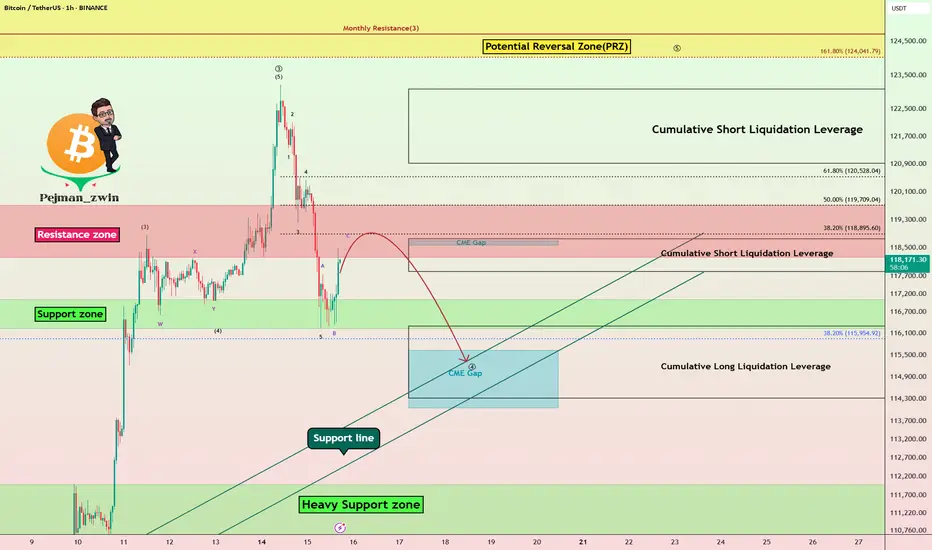
Bitcoin Struggles Below $120K:Will the CME Gap Pull Price Lower?Bitcoin ( BINANCE:BTCUSDT ) has been experiencing a high momentum bullish trend in recent days, which few people expected, especially when it crossed $120,000 . However, in the past 24 hours , Bitcoin has fallen back below $120,000 .
Bitcoin is currently trading in the Resistance zone($119,720-$118,240) and Cumulative Short Liquidation Leverage($118,757-$117,829) on the 1-hour time frame .
In terms of Elliott Wave theory , Bitcoin appears to be completing a main wave 4 . Main wave 4 is likely to have a Zigzag Correction(ABC/5-3-5) .
I expect Bitcoin to attack the Support lines and fill the CME Gap($115,060-$114,947) in the next hour.
Cumulative Short Liquidation Leverage: $123,087-$120,922
Cumulative Long Liquidation Leverage: $116,305-$114,325
Do you think Bitcoin can create a new ATH again?
Note: Stop Loss(SL)= $121,000
Please respect each other's ideas and express them politely if you agree or disagree.
Bitcoin Analyze (BTCUSDT), 1-hour time frame.
Be sure to follow the updated ideas.
Do not forget to put a Stop loss for your positions (For every position you want to open).
Please follow your strategy and updates; this is just my Idea, and I will gladly see your ideas in this post.
Please do not forget the ✅' like '✅ button 🙏😊 & Share it with your friends; thanks, and Trade safe.
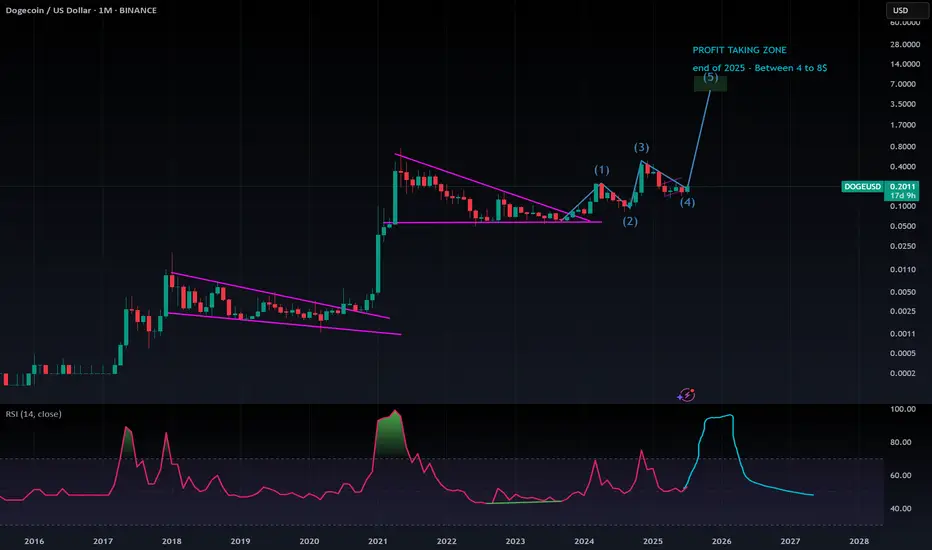
DOGE about to reach Plutothis cycle got most of us, offering nothing but two fake altcoin season, with almost full retracement each time.
Enough disgust to move out most altcoin investors.
But what about to come next will only reward the brave !
Get rid of your trauma from the last 24 months with altcoins, sky is the limit now.
TradeCityPro | SOL Holds PRZ as Bulls Eye Range Breakout👋 Welcome to TradeCity Pro!
In this analysis, I want to review the SOL coin for you. This is one of the popular Layer1 projects, nicknamed the “Ethereum killer,” with a market cap of $85 billion, currently ranked 6 on CoinMarketCap.
📅 Weekly timeframe
In the weekly timeframe, after the bankruptcy news related to FTX, this coin had a very sharp bearish move and even dropped to as low as 9.84, but it managed to recover afterward.
⭐ From the key top at 27.62, a very strong bullish move started, reaching up to 255.96 and retesting its previous ATH.
📊 Currently, a range box has formed between the 128.66 and 255.96 levels, where the bottom of this box is a very strong PRZ, created from the overlap of a major support zone and the area between the 0.236 and 0.382 Fibonacci levels.
🔍 Also, the price is being supported by the SMA99, which has supported the price twice so far and has prevented the box from breaking to the downside.
⚡️ If you have already bought SOL, you can set your stop-loss if the price closes below this area. A confirmed breakdown could lead to deep corrections toward lower Fibonacci levels.
🛒 For buying this coin, the first trigger is the break of 178.22, which is a bit riskier but offers a good price entry. On the other hand, if the price revisits 128.66 and gives confirmation, we can enter from there.
📈 However, the main trigger for spot entry is the breakout of the 255.96 top. Breaking this level can unlock some very ambitious targets. If that happens, I’ll definitely update the analysis and provide those targets.
📅 Daily timeframe
In this timeframe, we can see the price action in more detail. A small range box has formed between 144.11 and 164.74, and the price is currently stuck below the top of the box and reacting to it.
✨ If 164.74 breaks, we can enter a long position. The next major resistance is 183.54. A breakout above that will serve as the main confirmation for a long position targeting 255.96, which can also be used as a spot trigger.
💥 The RSI oscillator is now above the 50 zone, and if it enters the Overbuy area, it will serve as strong momentum confirmation for this position.
✅ If the price gets rejected from the top, we can also open short positions on lower timeframes. A break below 144.11 will be the main short trigger.
📝 Final Thoughts
This analysis reflects our opinions and is not financial advice.
Share your thoughts in the comments, and don’t forget to share this analysis with your friends! ❤️

Bitcoin may make correction movement to support levelHello traders, I want share with you my opinion about Bitcoin. Price recently printed a new ATH at 118800 points and then began to show signs of correction. Before this breakout, the price was stuck in a long downward channel, where it bounced inside the buyer zone (103000–103800) several times and reversed upward. After the final breakout, BTC entered a range phase between the support level (103800) and the support area (110300–111300), building energy before the massive move. Once the price escaped this range, a strong impulse up followed, pushing BTC above all major levels and reaching a new high. However, after hitting the ATH, the price started to stall and consolidate. Currently, we can see signs of weakness at the top — the structure is forming lower highs and looks unstable, which may indicate a potential retracement. Now the price is trading above the support area, but I expect a corrective move back toward the current support level at 110300. This level aligns with the top of the previous range and now acts as strong demand. That’s why I’ve set my TP at 110300 level — right at the beginning of potential buyer interest. Please share this idea with your friends and click Boost 🚀
Disclaimer: As part of ThinkMarkets’ Influencer Program, I am sponsored to share and publish their charts in my analysis.

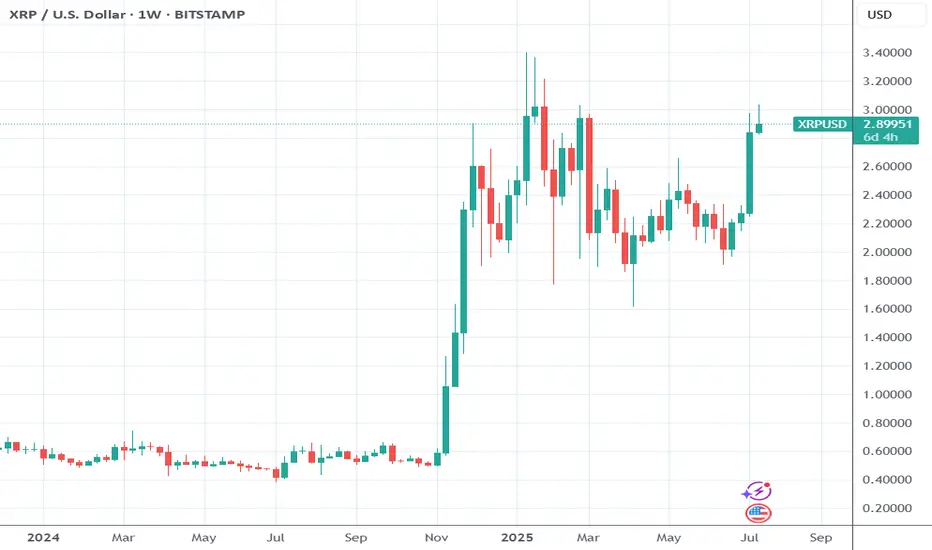
XRP $6.5, $9.5, $12.5 & $15.5 · Which One?XRP broke a small local downtrend and managed to close above a small resistance zone around $2.76. It managed to do this on a full green candle with rising volume.
XRPUSDT weekly is currently trading above all moving averages, extremely bullish: MA200, EMA377, EMA233, EMA89 and the rest.
If we look at a bull market cycle as a series of three steps, we have the first two missing the last one. Compare current action with 2021 while noticing the 1,2,3 numbers on the chart. This leaves us wondering about the next target: How high can XRP go in its next bullish move?
It seems something extraordinary is brewing behind the scenes, I can feel it. What we've been saying all along but rather than just words, a new feeling came up. "It is not the same to live through an event vs talking about it." That kind of feeling.
I can continue to say that market conditions are extremely positive now especially when we compare it to several years ago. But we have not seen the effect this positive conditions will have on the market, the price of the different projects and the charts, but we are getting close.
XRP has big plans and continue to grow, expand and evolve.
The 2021 bull market from bottom to top produced more than 1,800%. In 2025, if we start counting from the July 2024 low, a target of $6.50 would mean a total of ~1,585% growth. Market conditions are better now so we can aim higher, expect more.
A target of $9.51 sounds great, this would mean a nice ~230% from current price and from the same low as before, a total of ~2,400%. This sounds better but we can do more.
The next two targets based on an extension of the current trend would lead to $12.5 and $15.5. I'll let you calculate the potential yourself.
$6.5, $9.51, $12.5 or more; whatever the market ends up giving us, we are happy to be part of this adventure and we are always grateful for the amazing results.
Aim high. I will be here reading the charts live when we are getting close to the top. There will be time to sell, time to adapt, time to decide. There will be enough time for everything if you start now. Prepare now and success is yours.
We are early for the last phase of the XRP 2025 bull market. The first half is in, we are due the second half; it will be great.
Namaste.

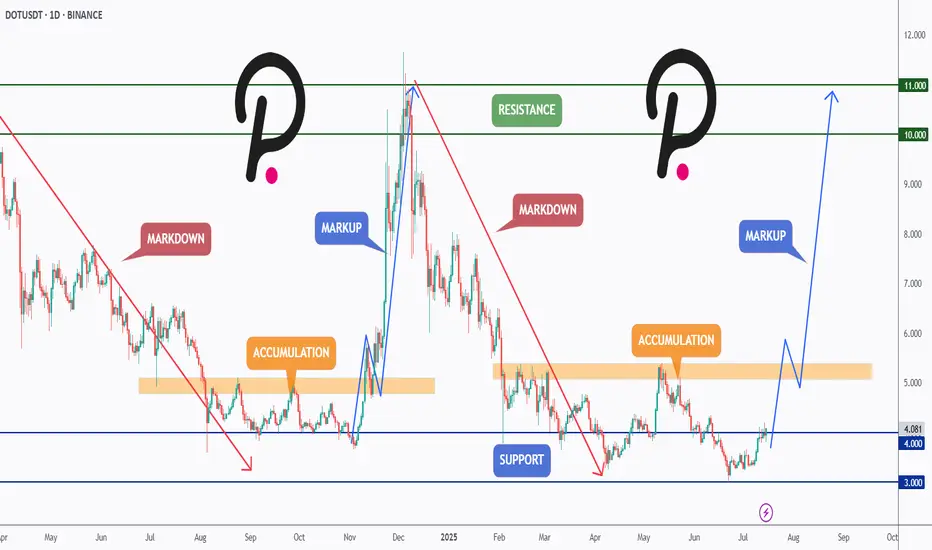
DOT Reloading for Takeoff ?CRYPTOCAP:DOT has been following a textbook Wyckoff cycle — moving from markdown into accumulation, followed by a sharp markup, then another markdown, and once again settling into a fresh accumulation zone.
After retesting the major support at $4 and holding above it, DOT is showing early signs of bullish momentum. If this structure continues, we could be preparing for another markup phase with potential targets at the $6, $10, and even $11 resistance zones.
This setup mirrors the previous cycle — will history repeat itself?
📍 Key Levels:
Support: $4.00 & $3.00
Resistance: $6.00, $10.00, and $11.00
Let me know your thoughts in the comments 👇
📚 Always follow your trading plan regarding entry, risk management, and trade management.
Good luck!
All Strategies Are Good; If Managed Properly!
~Richard Nasr
Thena: Hold Until The End (1,337% Profits Potential)Which one will you take? Endless opportunities the Cryptocurrency market has to offer; which one will you take?
Doesn't need to be just one can be many. You can choose many pairs to trade.
Countless opportunities are available now and these will be generating huge profits in the coming days.
The first burst forward will produce 100%, in 1-3 days. And this will be followed by sustained long-term growth. It will grow so much and for so long, that you will become bored. It won't be exciting anymore... Until the correction of course.
Thena here has more than 1,000% potential for growth. Right now this pair, THEUSDT, is sitting on a higher low or double-bottom, in this case it is the same.
This is the same pattern produced by Ravencoin, remember?
That project that grew more than 150% in a single day. "Altcoins Market Bull Market Confirmed, Ravencoin." And it is true, watch everything grow.
This same pattern is present on so many altcoins, not all of them but many and we know exactly what will happen next because what one does, the rest follows.
THEUSDT is about to go bullish, can take a few weeks or less, a few days.
When the bullish wave starts it will go for months, months of sustained growth. You simply hold until the end.
Thank you for reading.
Namaste.

BITCOIN High after High going for the Cycle Top!Bitcoin (BTCUSD) made a new All Time High (ATH) today, just north of $123000 and shows absolutely no signs of stopping there!
The brilliantly structured 2.5-year Channel Up (blue) that has been dominating the entirety of the current Bull Cycle since the November 2022 market bottom, has been on its latest Bullish Leg since the April 07 2025 rebound on the 1W MA50 (blue trend-line).
The 1W MA50 has been the Cycle's natural Support level since the March 13 2023 bullish break-out, never broken after, just like it has been for the 2019 - 2021 Bull Cycle (excluding of course the Black Swan event of the March 2020 COVID crash).
In fact the similarities of the whole 2022 - 2025 Cycle are strong with the 2018 - 2021 Cycle. Similar Bear Cycles of -80% on average, followed by strong Lower Highs break-outs and subsequent consolidations within the 0.786 - 0.618 Fibonacci range, takes us to today with the April 2025 1W MA50 bounce resembling the July 2021 one.
Eventually, that Bullish Leg led to the Cycle's Top a little above the 1.618 Fibonacci extension. The market seems to be only one step away of completing that past pattern and if it does, BTC may hit $170000 before the Cycle peaks.
Do you think that is a likely scenario after today's new fresh ATH? Feel free to let us know in the comments section below!
-------------------------------------------------------------------------------
** Please LIKE 👍, FOLLOW ✅, SHARE 🙌 and COMMENT ✍ if you enjoy this idea! Also share your ideas and charts in the comments section below! This is best way to keep it relevant, support us, keep the content here free and allow the idea to reach as many people as possible. **
-------------------------------------------------------------------------------
💸💸💸💸💸💸
👇 👇 👇 👇 👇 👇

Altcoins Bull Market Confirmed —Fun TokenEvery time there is a strong rise immediately what follows is a correction, always, unless of course you are in a bull market. Here you have the most revealing signal of all: Price stability after a major rise, sideways rather than bearish.
Fun Token (FUNUSDT) produced a more than 340% bullish wave. What happens right after the peak? If you guessed a drop I don't blame you, that is what normally happens but here things are different. Since the market is growing and set to grow strong for long, after this major rise instead of a crash we have consolidation, sideways. This reveals that participants are not selling, they are not selling because they know the rise is not over, there will be additional growth.
Go back in time and look at 30-50 altcoins and see what happens after each strong bullish wave, a correction. Now, do the same but focus on a bull market; what happens after a strong bullish wave? Some consolidation followed by additional growth.
The altcoins bull market is already confirmed.
Thanks a lot for your continued support.
Namaste.

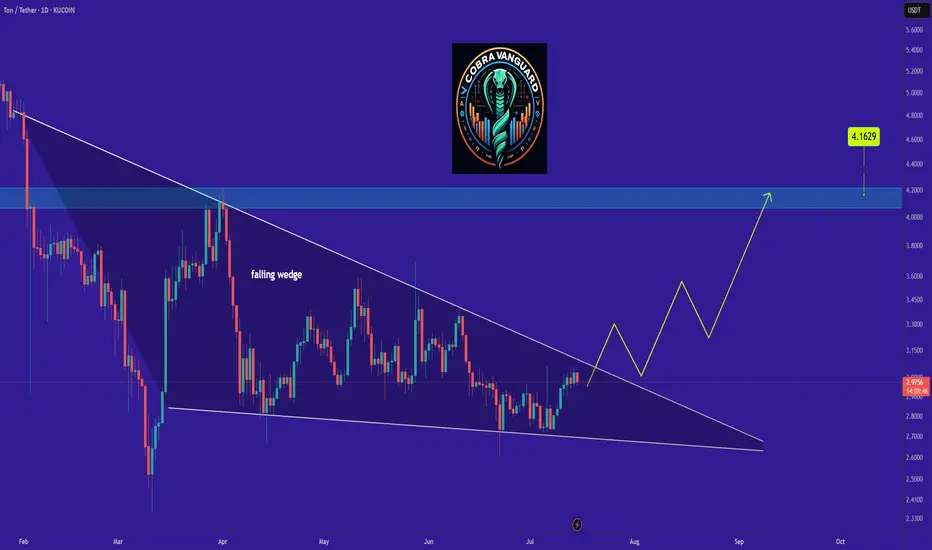
TON It will grow soon...So if you pay attention to the TON chart you can see that the price has formed a Ascending wedge which means it is expected to price move as equal as the measured price movement.( AB=CD )
NOTE: wait for break of the WEDGE .
Best regards CobraVanguard.💚
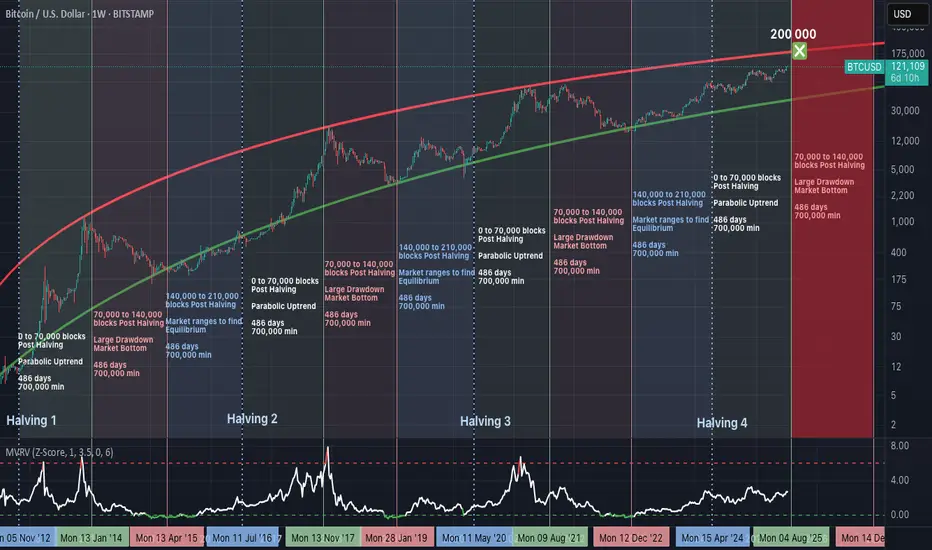
Bitcoin’s 486-Day Halving Blueprint: The $200,000 Blowoff?Summary
Bitcoin’s price consistently follows a 3-phase structure after each halving, with ~486 days per phase. If history repeats, we are nearing the end of the parabolic phase, with a potential peak around $200,000, before entering a structured drawdown.
Halving Cycles: The Real Clock Behind Bitcoin
Bitcoin’s monetary policy is pre-programmed.
A halving occurs approximately every 210,000 blocks (~4 years), and market behaviour after each halving follows this repeating pattern:
Phase 1: Parabolic Rally (0 to 70,000 blocks post-halving).
Phase 2: Major Drawdown (70,000 to 140,000 blocks).
Phase 3: Equilibrium Phase (140,000 to 210,000 blocks).
Each phase lasts approximately 486 days, and this structure has repeated reliably since 2012.
Phase 1: The Parabolic Rally (Current Phase)
We are currently in the growth segment of the cycle:
Price rising rapidly.
Miner profitability at highs.
Hashrate and network security increasing.
MVRV Z-Score steadily climbing, but not yet overextended.
Roughly 700,000 BTC are mined during this period, creating a supply shock as issuance is halved while demand accelerates.
Phase 2: The Drawdown (Expected Next)
Historically begins between block 70,000 to 140,000 post-halving.
Market peaks and begins to correct.
Miner margins compress.
Hashrate may plateau or decline.
Forced selling and miner capitulation drive volatility.
Price retraces significantly from the peak.
This phase resets the market and eliminates unsustainable excess.
Phase 3: The Equilibrium Phase
Occurs between block 140,000 to 210,000 post-halving.
Price enters consolidation.
Realized value and market price converge.
Ideal accumulation period for long-term investors.
Network fundamentals stabilize ahead of the next halving.
This phase is critical in building the base for the next cycle.
MVRV Z-Score: Market Thermometer
The chart includes the MVRV Z-Score, a key metric showing how far price deviates from realized value:
Readings above 6.0 have consistently marked cycle tops.
Readings near or below 0 have marked major bottoms.
Current value is around 2.67 — indicating a rising trend, but not overheated.
This metric reflects market-wide profitability and speculative pressure.
Why $200,000 Is in Sight
The projected resistance curve on the chart suggests that:
$200,000 aligns with the top of the long-term parabolic channel.
It corresponds with the expected end of the parabolic phase (Q1–Q2 2026).
It fits prior extension patterns following each halving.
It is a strong psychological target, likely to trigger heavy profit-taking.
This price level is not arbitrary—it is derived from the same structure that defined previous peaks.
What Comes After
If the historical cycle structure remains intact:
The peak should occur before mid-2026.
A deep correction phase follows, likely into 2027.
True bottoms tend to occur as miner capitulation concludes and difficulty adjusts downward.
This is where conviction and preparation matter most.
Final Thoughts
Bitcoin cycles are not random. They are structured around block height, issuance, and miner economics.
Every cycle since 2012 has followed this 486-day framework, divided across parabola, crash, and reset. This model has outperformed calendar-based predictions and technical narratives.
Disclaimer
This content is for educational and informational purposes only and does not constitute financial, investment, or trading advice. Past performance is not indicative of future results. Always do your own research and consult with a qualified financial advisor before making investment decisions. The author holds no responsibility for any losses incurred as a result of using the information presented herein.
ETH is testing resistance. False breakout?ETH is gathering liquidity ahead of a possible decline
The gray square is the active buying zone. When the price returned below the 3040 level, a liquidation phase occurred. Against the backdrop of the news, a retest of resistance is forming, but not with the aim of breaking through the level, but with the aim of gathering liquidity for a move to 2960-2913.
A false breakout of resistance could trigger another phase of liquidation (correction) to 2961. A halt should be expected in the 2900 zone.

Litecoin (LTC): Seeing Strong Upside Potential | Bullish TradeLitecoin caught our attention with a nice breakout and buy-side volume dominance, where we are seeing 2 good trades that can be taken, both with a decent R:R ratio.
More in-depth info is in the video—enjoy!
Swallow Academy

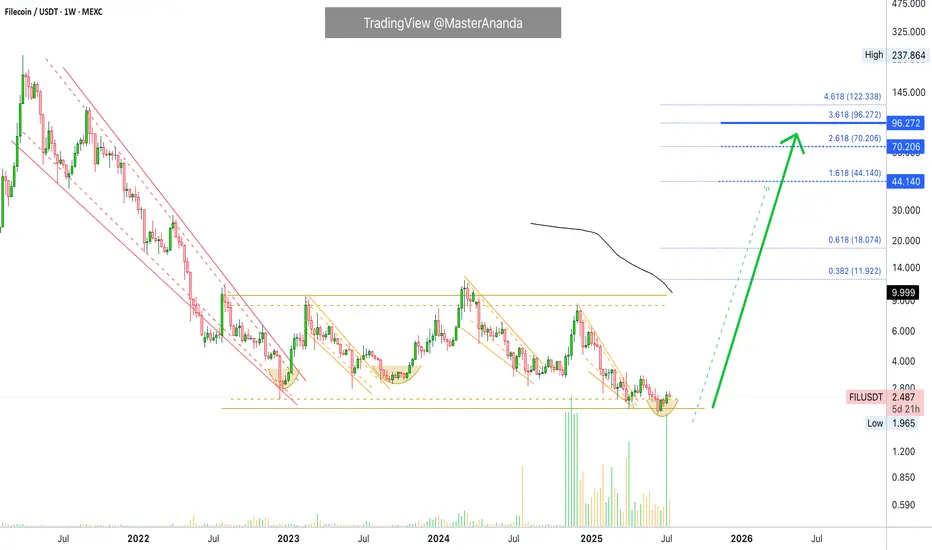
Filecoin Hits Bottom · 3 Years Long BD · Volume Signal · MACD &I think what is really nice about MEXC is that it truly reveals the bottom through volume. The changes in trading volume in this exchange are so pronounced that you can never go wrong. Look at Filecoin, extremely high volume in November 2024, right before a bullish wave. Then again, incredibly high volume last week, July 2025, right before a... Right before a major, major bullish wave, or else trading volume wouldn't be so high. It is this high because whales are buying with margin on this exchange.
Ok. A classic signal, 100% original. MA200 starts curving down strong; prices start to move up to meet this indicator, there will be a cross. So when MA200 starts diving deep down coming from a high point, the low is in, the bottom is in and the trend is about to change from bearish to bullish. Filecoin is about to start growing.
These are two signals, both very strong. Let's add another one. Bullish divergence with the MACD and RSI. Weekly, long-term. This makes these signals very, very strong.
FILUSDT weekly RSI hit bottom June 2022, in June 2025 (three years later) it produced a higher low.
FILUSDT weekly produced a major low December 2022, in June 2025 it produced a lower low. That's a strong divergence.
FILUSDT weekly MACD hit bottom February 2022. There is a extreme higher low in 2025 and also a bullish cross.
Needless to say, the bullish cross indicates the market is about to change. This matches the volume signal, the MA200 signal, marketwide action, the bullish divergence with the RSI, Ethereum and the rest.
Everything is bullish if you look deep enough. Bullish means potential for growth when prices are low. Bullish potential. That's what we are looking for. Filecoin is about to turn-up.
Namaste.
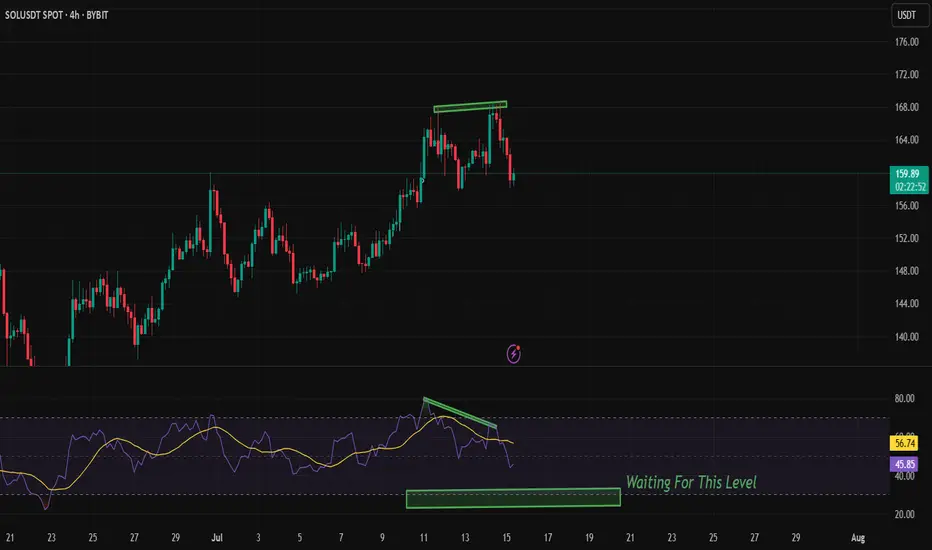
Bearish RSI Divergence on SOLUSDT (4H) – Patience Over FOMO!
🚨 Observing a clear Bearish RSI Divergence on the 4H chart for $BYBIT:SOLUSDT.
While the price made a higher high, the RSI showed a lower high, indicating weakening bullish momentum.
🟣 RSI is now trending down and currently around 46.
💡 I'm waiting for RSI to approach the 30 level (oversold zone) before considering a long entry.
🎯 No rush to buy — I prefer to wait for confirmation and a better risk-reward zone.
📅 Timeframe: 4H
📍 Plan: Waiting for RSI near 30
✅ Staying disciplined and avoiding emotional entries.
🧠 Let the setup come to you. Don’t chase the market.
XRPUSD - Why I see that Ripple even higherMedianlines, aka "Forks" have a simple but effective ruleset inherent. These rules describe the movement in certain situations. And of course, the most probable path of wher price is trading to.
Here we a rule in play that projects more movement to the upside, even if BTCUSD has had a strong pullback to the south.
Let's see:
If price is closing above a Centerline, then chances are high that it will retest it. If it holds and starts to continue it's path (to the upside), then the next target is the U-MHL, or the Upper Medianline Parallel, was Dr. Allan Andrews named it back many decades ago.
So, there we have it.
Chances are high that Ripple will reach new highs, with a final target at the U-MLH.

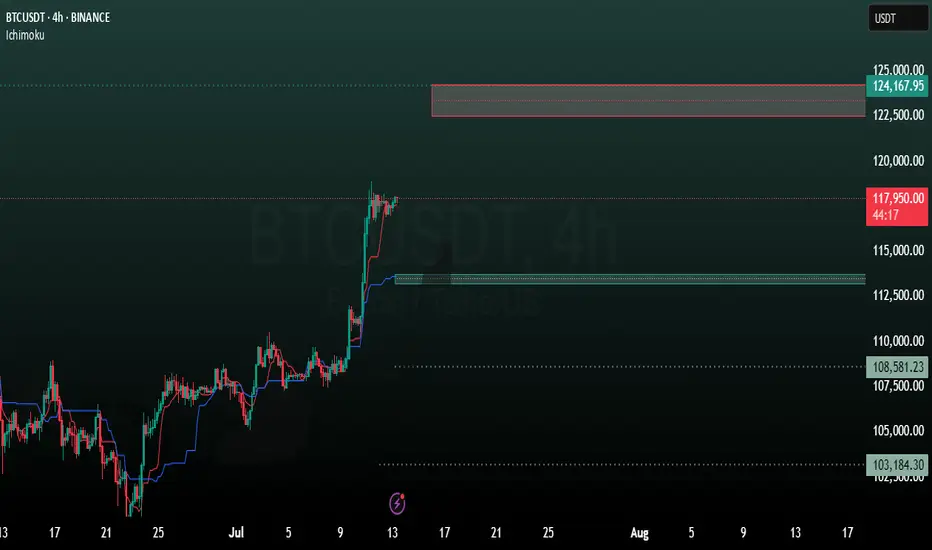
BTC 4H analysisBased on our previous analysis, BTC trend is still bullish. It reacts to our mentioned support level (98699) and moving to new resistance levels.
ICHIMOKU shows these levels as resistance:
122500
124000
137000
And these as support:
113788
113181
108581