HolderStat┆XRPUSD before retest of the $2 levelBINANCE:XRPUSDT has rebounded from its 2.08 base and broken out of consolidation, aiming for the upper diagonal resistance near 2.40–2.60. With recurring bullish patterns and a history of strong follow-through after similar setups, momentum may build if 2.20 is cleared.
Crypto market

A scalping study using volume and Elliott Wave theory.A study I conducted to show how to make money in scalping by applying simple Elliott Wave analysis and volume control.
Attention: There’s no audio, and when examined carefully, none is needed.

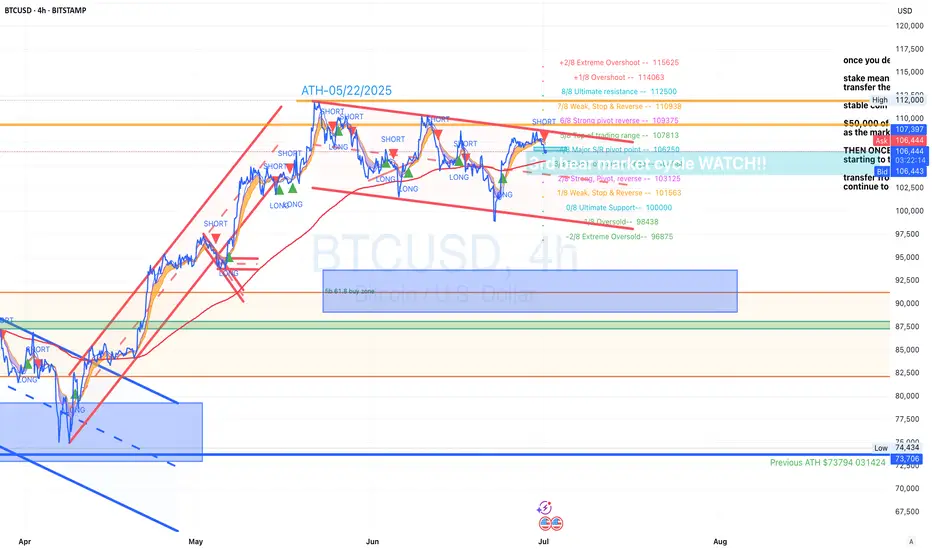
BTCUSD entering 3rd bear market cycle BTCUSD has bounced off of the top of a 4H descending channel and has now began moving in the 3rd bear market cycle
i will be watching for the market to reach the mid line in the channel and possibly to the bottom of the channel for another retest.
Opinion: This analysis is for education purposes only and is just my analysis, this is not a trade idea.
ETH | H12 Supply Rejection & Demand Bounce PlanSELL ZONE $2,520–2,560
→ Short from supply, rejection expected
Triple tap + SFP = short trigger
↓
EQ LOWS $2,380–2,400
→ TP1 / watch for bounce
↓
BUY ZONE $2,280–2,320
→ Main long zone, enter on confirmation (bullish candle/SFP)
STOP below $2,250 = cancel idea
↑
TP1 $2,500
TP2 $2,900–3,000 (if strong bounce)
Main scenario — short from supply zone, target demand at $2,280–2,320. Long only if bounce is strong. Stop below $2,250. No confirmation — no trade.

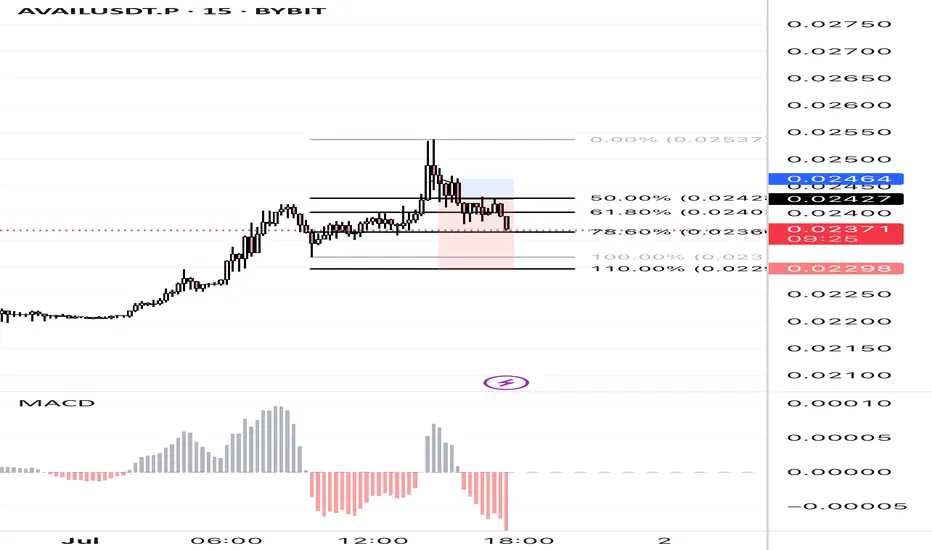
AVAILUSDT.P – Golden Zone Long Setup (Fib 61.8%–78.6% Reaction After a strong impulsive move, AVAILUSDT.P is retracing into the golden Fibonacci zone between 61.8% and 78.6%. Price action shows hesitation near 0.02360, suggesting potential support.
Watching closely for bullish confirmation to go long, with targets back toward the 0.02537 swing high. MACD weakening bearish momentum may align with entry confirmation.
#AVAILUSDT #BybitTrading #FibStrategy #CryptoLong #GoldenZone #FibonacciLevels #MACD #CopyTrading
Solana (SOL/USDT) 4H Reverse H&S PatternSolana (SOL/USDT) – 4H Market Outlook | July 1, 2025
Introduction
SOL has formed a reverse head and shoulders pattern, followed by a clean breakout above resistance. While the lower time frame is bullish, the higher time frame remains bearish, creating a short-term opportunity within a broader downtrend.
Context 1: Key Zones
Supply Zone: 176 – 187
Demand Zone: 126 – 143
Psychological Levels: 140 and 160
Context 2: Technical Structure
Pattern: Reverse Head & Shoulders
Breakout: Confirmed above neckline/resistance
FVGs:
One below price (within demand)
One above price (potential target)
Golden Pocket: Sits just above lower FVG and inside demand — strong confluence support
Context 3: Volume Insight
OBV Indicator: Shows a sudden volume spike, adding strength to the breakout and the bullish pattern confirmation.
Bullish Scenario
Price pulls back into the golden pocket + FVG + demand zone
Finds support → bounces to form higher low
Second leg of the move breaks swing high → targets upper FVG and 160 psychological level
Bearish Scenario
Price breaks back below demand zone and invalidates the golden pocket
Fails to hold structure → reverts to macro bearish trend
Potential retest of previous swing low below 126
Summary
SOL is showing bullish momentum on the 4H after completing a reversal pattern and spiking in volume. A pullback into the demand zone confluence may offer a strong long setup — but failure to hold could revalidate the higher timeframe downtrend.

BITCOINSpeculators are net short on BTC (bearish sentiment).
The short position has increased slightly, indicating growing bearishness.
✅ Bias Summary:
BTC Bias: Bearish and increasing in bearish momentum.

BTCUSDT 4H/1D | Macro Rejection + Event WatchBTC got rejected again at macro trendline (~108.5K)
Multiple lower highs → selling pressure confirmed
4H breakdown from compression with volume spike
Now hovering near 106.5K — key support
🔻 Below 106.2K = clean short trigger → 104.4K–102.5K
✅ Reclaim above 108.2K flips bias bullish
⚡ Market Context
Large treasury interest building (institutional buying signs)
Recent $40B options expiry adds volatility at key levels
Renewed institutional participation visible across platforms
Bias: Bearish below 107.2K. Structure and volume support downside.
Watch for July trend confirmation post-event digestion.
“Smart trades aren’t lucky — they’re planned.”

SHORT ON BITCOINBITCOIN has continue to create lower highs at a major resistance zone.
I will be selling bitcoin looking to make over 8000 to 20,000 points.

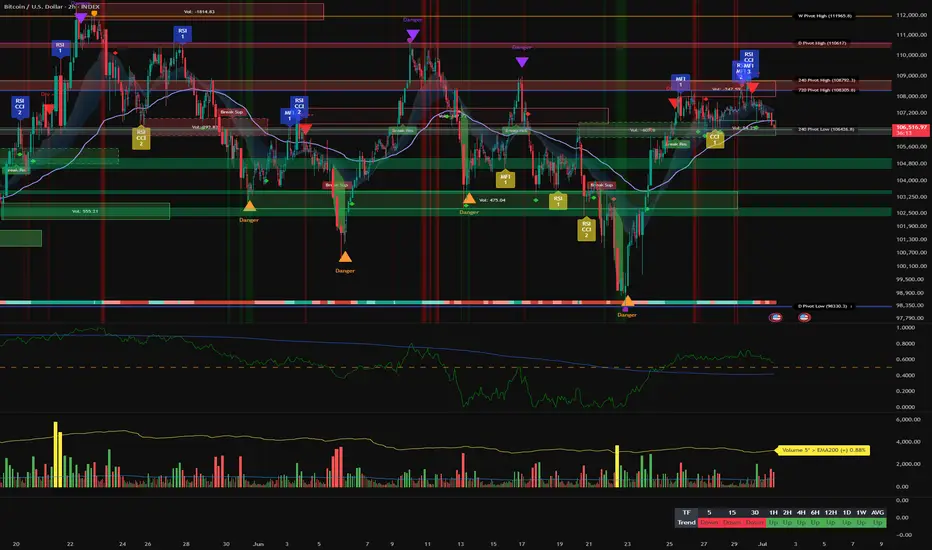
Critical Range 106,036–108,300, Sector Support Remains Bullish__________________________________________________________________________________
Technical Overview – Summary Points
__________________________________________________________________________________
Momentum: Bullish across all timeframes ≥1H (MTFTI UP); corrective compression seen on 15m/30m as short-term selling momentum decelerates.
Support/resistance: Major defensive cluster at 106,036–106,210; multiple resistances at 108,272/108,790 and 110,530–111,980. No excesses or validated breakdowns.
Volume: Historical average across all timeframes, no abnormal flows, no signs of euphoria.
Risk On / Risk Off Indicator: "Strong Buy" signal on all timeframes except 15m (neutral); sector momentum confirmed, software leadership maintained.
Investor behavior (ISPD DIV): Mostly neutral except for a micro-buy on 15m, no extremes of fear or euphoria.
__________________________________________________________________________________
Summary
__________________________________________________________________________________
Global bias: Remains bullish in the medium term, mature range, no imminent trigger catalysts.
Opportunities: Technical bounce/entry favored on 106,036–106,210 if support cluster holds and ISPD DIV validated. Conservative profit-taking below 108,000–108,300.
Risk areas: Confirmed breakdown (1H/4H close <106,036 with high volume and MTFTI reversal). Recommended stop <105,900.
Macro catalysts: Awaiting US data (PMI/ISM/JOLTS). Watch for macro surprises or FOMC. Low expected volatility until late July.
Action plan: Range-buy near support cluster, active stop/profit management, volume watch, confirm with intraday micro-signals.
__________________________________________________________________________________
Multi-Timeframe Analysis
__________________________________________________________________________________
1D: Consolidating below major resistance >110k. Momentum and Risk On / Risk Off Indicator solid. No volume catalysts.
12H–4H: Bullish structure preserved, compression under resistance, supports holding (106k–106.5k), average volume.
2H–1H: Compression, repeated tests of 106,036 support, buying appears at each rebound; no clear selling continuation.
30min–15min: Technical correction, micro-bearish divergence on Risk On / Risk Off Indicator, but ISPD DIV buy marker on 106,036–106,210 cluster. Stable volume.
Summary: All ≥1H timeframes are bullish; 15m/30m show corrective compression in a mature, defended range.
Strategic Outlook:
- BTCUSDT continues to consolidate in a mature range with a multi-frequency support cluster at 106,036–106,210.
- Broadly UP trend, robust Risk On / Risk Off Indicator, no exogenous catalysts.
- Opportunity zone on cluster support test; confirm any bounce with returning flows or 15m behavioral signal.
- Key stop <105,900, progressive profit-taking below 108,000–108,300.
- Macro watch (PMI, ISM, FOMC) essential to anticipate volatility pickup or trend change.
On-chain / Macro: No short-term systemic risks. General wait-and-see, no stress or euphoria. Consolidative setup.
Risk / Reward: Adjust leverage and strict risk control; ratio ≥3:1 maintained as long as cluster support holds.
Recommended management: No chasing, favor range-buy approaches, dynamic stops, and gradual profit-taking on resistance.
__________________________________________________________________________________
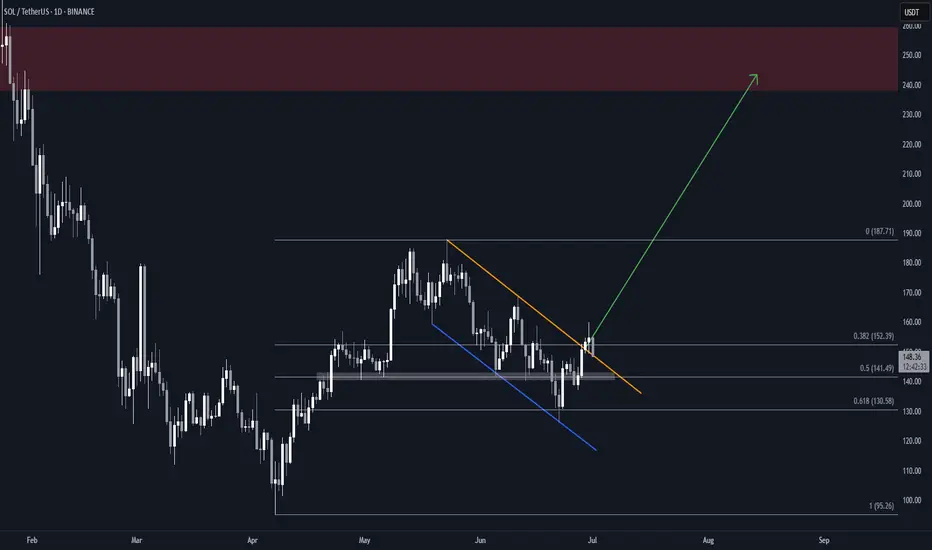
Solana (SOL) Flag & Pole Breakout (1D)BINANCE:SOLUSDT broke out of a textbook falling wedge two days ago, and is now retesting the former resistance as support.
Key Technicals
• Falling channel with clean structure and multiple touches
• Resistance trendline broken
• Price now retesting the breakout zone (~$148)
• Overhead supply zone at $238–$260
• Measured Target: $240, within supply
Why This Setup Matters
• Clear breakout followed by a retest, which can often precede the next leg up if support holds
• Falling channel retracement aligns with 0.618 Fib, a common reversal area
What to Watch
• Daily close above the previous resistance trendline
• Push above the local $160 high for full confirmation
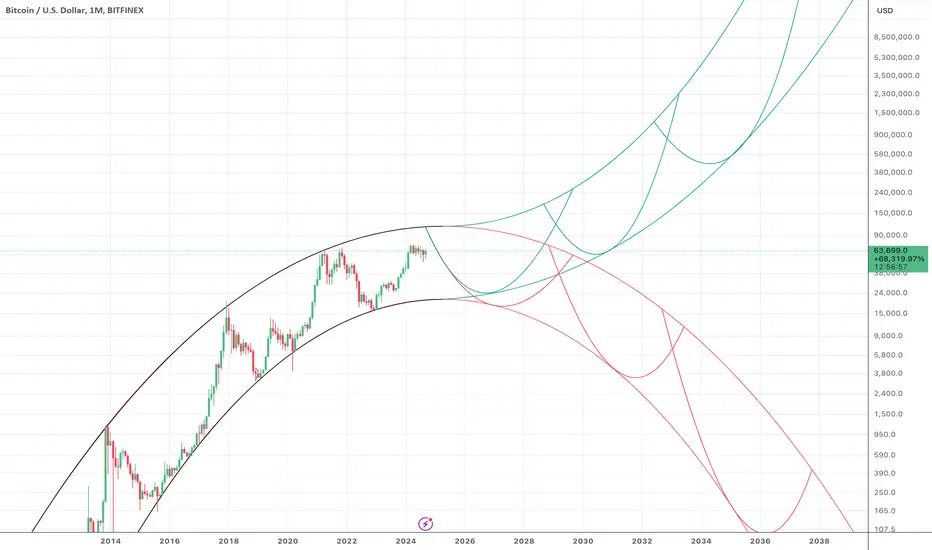
BTCUSD - The Binary Set of Possible Futures for BitcoinBitcoin priced in dollars will eventually go to infinity or to zero.
This chart is a more precise model of an idea I've been toying with for a few months. It fits the past price cycles extremely accurately, if we are willing to disregard the lower end of the Covid crash wick and stick to monthly closes. It also predicts the binary set of possible futures for Bitcoin in an extremely elegant way.
According to this model, regardless of which path Bitcoin price takes after this cycle, we will see a top around $111,800 around spring 2025 - April 2025 if it hits the nadir of the arch exactly.
We will have a strong clue about which of the two futures (infinity or zero) Bitcoin is headed towards when we see whether it bottoms near $16,000 (Bitcoin to Zero) or bottoms near $24,000 (Bitcoin to Infinity) next bear market.
The model predicts hyperinflation of the dollar in 2037 on the "Bitcoin infinity path," or alternatively Bitcoin to digital trash in 2036 on the "Bitcoin zero path."
SUIUSDTCryptocurrency Futures Market Disclaimer 🚨🚨🚨
Trading cryptocurrency futures involves high risks and is not suitable for all investors.
Cryptocurrency prices are highly volatile, which can lead to significant gains or losses in a short period.
Before engaging in crypto futures trading, consider your risk tolerance, experience, and financial situation.
Risk of Loss: You may lose more than your initial capital due to the leveraged nature of futures. You are fully responsible for any losses incurred.
Market Volatility: Crypto prices can fluctuate significantly due to factors such as market sentiment, regulations, or unforeseen events.
Leverage Risk: The use of leverage can amplify profits but also increases the risk of total loss.
Regulatory Uncertainty: Regulations related to cryptocurrencies vary by jurisdiction and may change, affecting the value or legality of trading.
Technical Risks: Platform disruptions, hacking, or technical issues may result in losses.
This information is not financial, investment, or trading advice. Consult a professional financial advisor before making decisions. We are not liable for any losses or damages arising from cryptocurrency futures trading.
Note: Ensure compliance with local regulations regarding cryptocurrency trading in your region.
thanks for like and follow @ydnldn

BTC/USD Fake out before Pump | Bullish Flag formationBTC/USDT (1D) Market Outlook – July 1, 2025
Introduction
BTC is currently consolidating within a bullish flag pattern after printing a swing high at 108.9K and a recent swing low at 98K. The price sits just below a major supply zone.
Context 1: Key Zones
Supply: 104.6K – 112.1K
Demand: 74.4K – 82.5K
Fair Value Gaps (FVG): 3 zones below price, with one near 88–90K
Context 2: Technical Confluence
Liquidation Zone: 106.2K
Golden Pocket (Fib 0.618): 102.1K
Psychological Levels: 105K and 110K
Context 3: Market Structure
Pattern: Bullish flag
Trend (LTF): Sideways/consolidation
Volume Profile: Heavy activity near 105K–110K
Bullish Scenario
Breaks above 106.2K (liq zone)
Pulls back to 102.1K (golden pocket), forms higher low
Retests resistance for continuation
Alt scenario: clean breakout above resistance → ATH retest
Bearish Scenario
Breaks below 106.2K and flag support
Fills FVG, breaks prior low at 98K
Triggers macro downtrend toward 88–90K zone
Summary
BTC is at a decision point inside a bullish flag, facing supply. A break above 106.2K favors upside continuation, while rejection and a lower low could trigger a deeper retracement. Watch key levels closely.

Bitcoin-Potential bullish bounce off an overlap supportBitcoin (BTC/USD) is falling towards an overlap support and could potentially bounce off this level to climb higher.
Buy entry is at 106,535.50 which is an overlap support that aligns with the 23.6% Fibonacci retracement.
Stop loss is at 104,600.00 which is a level that lies underneath a swing-low support and the 38.2% Fibonacci retracement.
Take profit is at 108,808.50 which is a multi-swing-high resistance.

ETHUSD broke the Resistance level 2500.00 range 👀 Possible scenario:
Ethereum is trading above $2,400 after a volatile stretch, showing resilience but lacking a clear breakout. CryptoQuant data shows strong accumulation by long-term holders during recent consolidation, suggesting solid support beneath the surface. However, weakening volume and macro risks still raise the chance of a pullback if support levels break.
Adding pressure, a whale entity recently moved over 62,000 ETH ($154M) to exchanges, with another $83M still in holding—posing a near-term sell-off risk. Traders now await a decisive move. A break above $2,500 could spark momentum, but caution remains as market sentiment stays mixed.
✅ Support and Resistance Levels
Support levels is now located at 2,400.00.
Now, the resistance level is located at 2,550.00.

CHESS/USDT Re-accumulatingCHESS has been accumulating for the past 66 days in a tight range between $0.070 – $0.085, forming a solid base.
Price is now coiling near the top of the range, suggesting a potential breakout is imminent. A confirmed breakout above $0.085 could trigger a parabolic move as liquidity and momentum kick in.
Target Zones
• TP1: $0.095
• TP2: $0.101
• TP3: $0.125
🔻 Stop Loss: Below $0.069

AGLD/USDT final liquidity sweepAGLD is showing signs of a potential final liquidity sweep before any meaningful reversal. Price action suggests weakness below key resistance, with a possible cleanout move incoming.

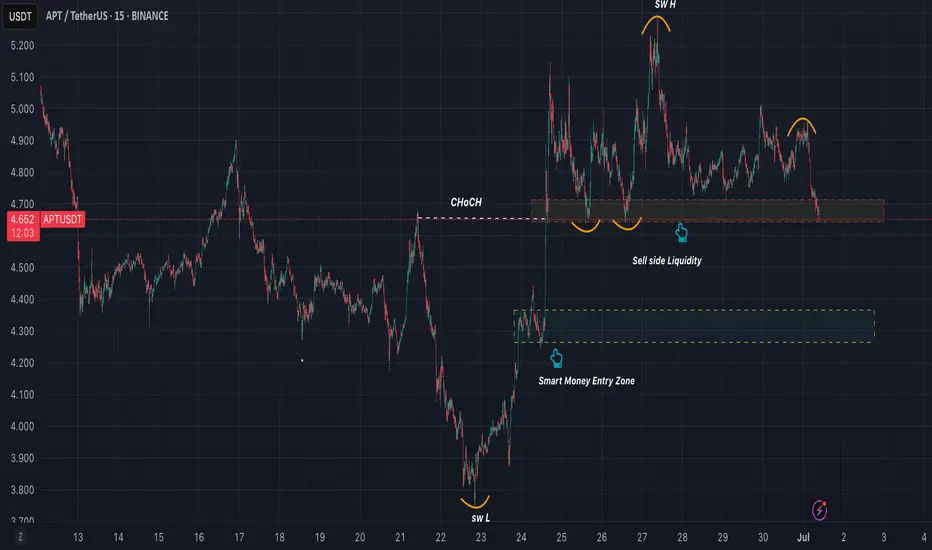
APTUSDT Price is testing around key support at $4.65. I believe it will likely break below this level to grab liquidity and trigger STL, then drop into the smart money entry zone between $4.26 and $4.36 . A strong reaction from that zone is expected. BINANCE:APTUSDT

Phemex Analysis #93: Is it Time to Enter Hashflow (HFT)?Hashflow ( PHEMEX:HFTUSDT.P ) is a decentralized trading protocol designed to facilitate seamless, secure cross-chain asset swaps with zero slippage and protection against MEV (Maximal Extractable Value) exploits. Unlike traditional decentralized exchanges, Hashflow enables users to trade across various blockchains without relying on external bridges or synthetic assets. Trades execute precisely at the quoted price without hidden commissions, enhancing transparency and efficiency.
Recently, HFT experienced an impressive bullish rally, surging approximately 190% within 48 hours, currently stabilizing around the $0.12 mark. This rapid appreciation naturally raises questions among traders: is now the ideal entry point, or is caution warranted following such sharp movements? To assist traders in making informed decisions, let's examine a few potential scenarios closely.
Possible Scenarios
1. Bullish Continuation (Positive Scenario)
Currently, the HFT price faces significant resistance around $0.15. A bullish continuation scenario involves HFT consolidating briefly above the $0.10 support area, gathering strength before making another attempt at breaking through the critical $0.15 resistance.
Pro Tips:
Entry Strategy: Consider carefully entering positions only after a confirmed breakout above the resistance at $0.15, accompanied by strong volume.
Profit-Taking Targets: Short-term profit-taking levels to monitor closely are at $0.156, $0.17, and $0.21.
Risk Management: Implement a clear stop-loss strategy slightly below the $0.10 area to mitigate potential downside risk.
2. The Hype Is Over (Bearish Scenario)
Given the broader market consolidation, there's a realistic risk that recent bullish momentum may fade quickly. If the price falls decisively below the $0.10 support, this scenario could trigger further declines towards key support levels such as $0.067, or even back down to $0.05.
Pro Tips:
Stay Cautious: Traders should remain on the sidelines if prices fall below $0.10 with increased selling volume, as it could indicate a broader sell-off.
Long-Term Accumulation: For long-term investors interested in HFT, wait patiently for price stabilization at or near support areas ($0.067 and $0.05) before gradually accumulating positions.
3. Consolidation between $0.10–$0.15 (Neutral Scenario)
A third possibility involves HFT price remaining range-bound, consolidating between the immediate support at $0.10 and resistance at $0.15. Such consolidation would represent market indecision as traders and investors await further market cues.
Pro Tips:
Range Trading: Employ range-trading techniques to profit from short-term price fluctuations between these clearly defined boundaries.
Observe Breakout Signals: Closely watch volume patterns, as increased volume accompanying a breakout from either end of the range could signify the next significant directional move.
Conclusion
Hashflow (HFT) has recently demonstrated significant volatility, creating multiple opportunities and risks for traders. By closely monitoring the outlined scenarios—particularly the critical levels of $0.10 and $0.15—and employing strategic risk management, traders can confidently position themselves to optimize potential returns. Always prioritize clear confirmation of market signals and adapt your strategies according to the unfolding price action.
🔥 Tips:
Armed Your Trading Arsenal with advanced tools like multiple watchlists, basket orders, and real-time strategy adjustments at Phemex. Our USDT-based scaled orders give you precise control over your risk, while iceberg orders provide stealthy execution.
Disclaimer: This is NOT financial or investment advice. Please conduct your own research (DYOR). Phemex is not responsible, directly or indirectly, for any damage or loss incurred or claimed to be caused by or in association with the use of or reliance on any content, goods, or services mentioned in this article.

APE/USDT – Reversal Loading Below 0.6000APE is sitting on a major multi-timeframe support zone around 0.595–0.603. Structure already shifted on the weekly — this is no longer a clean downtrend. Price has reclaimed the 0.618 Fib and is now coiling below resistance.
Entries below 0.6000 are golden.
apeing in under 0.6000 and waiting for the upside move.
Upside targets: 0.626 → 0.726 → 0.798
Risk is clear: If 0.585 fails, we could revisit 0.543 or lower.
But if it holds, the upside move is likely to be fast, sharp, and hard to catch.
This is the kind of setup where price won't give second chances once it moves.
#APE #Crypto #SwingTrade #Reversal #Altcoins
Note: Not a Finanical Advice

BITCOIN BEARS ARE GAINING STRENGTH|SHORT
BITCOIN SIGNAL
Trade Direction: short
Entry Level: 106,743.04
Target Level: 99,806.18
Stop Loss: 111,349.12
RISK PROFILE
Risk level: medium
Suggested risk: 1%
Timeframe: 1D
Disclosure: I am part of Trade Nation's Influencer program and receive a monthly fee for using their TradingView charts in my analysis.
✅LIKE AND COMMENT MY IDEAS✅
