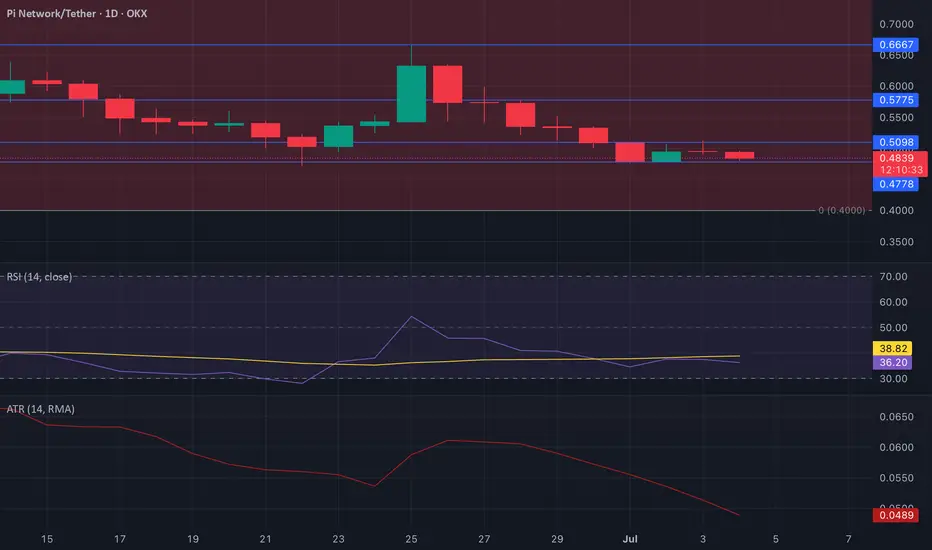
PI – Consolidation and Shrinking VolatilitySince Tuesday, NASDAQ:PI has been trading within a tight range between the $0.47 support and the $0.50 resistance level. This sideways movement reflects a balance between buyers and sellers, with neither side showing enough strength to push the price in a clear direction. The market appears to be in a state of indecision, as participants wait for a fundamental or technical catalyst to spark a breakout.
The Relative Strength Index (RSI) currently sits at 36.18 and has remained relatively flat over the past few days. This indicates a lack of momentum and weak conviction among traders. When RSI trends sideways like this, it typically signals that market participants are staying on the sidelines, avoiding large positions until a clearer trend emerges.
Additionally, the Average True Range (ATR) has dropped to 0.048, marking a 12% decline since Tuesday. This confirms the ongoing reduction in market volatility. A falling ATR suggests that price swings are narrowing, often preceding a significant breakout as the market builds up pressure.
Taken together, the flat RSI and declining ATR paint a picture of a consolidating market. While NASDAQ:PI lacks strong directional momentum at the moment, these conditions often set the stage for a sharp move. Traders should keep a close eye on the $0.47–$0.50 range for signs of a breakout in either direction.
Crypto market
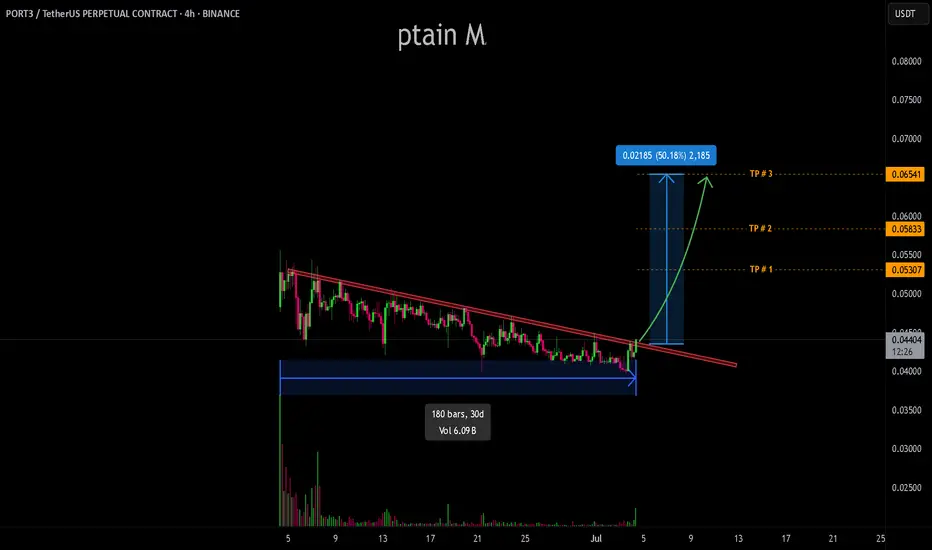
PORT3/USDT - Weekend After a 30-day sloping downtrend, PORT3 is showing signs of exhaustion and potential reversal. The price is currently hovering near key resistance, and we’re watching closely for a clean breakout confirmation to validate entry.
FHE/USDT - Manipulation !!!FHE/USDT appears to be completing its manipulation phase, with price action showing signs of absorption and consolidation. Smart money likely accumulating as volume behavior shifts and volatility compresses , a typical precursor to a distribution phase.
With strong structural support holding and early signs of a breakout build-up, FHE looks poised to transition into a parabolic move.
Once distribution initiates, expect sharp momentum to the upside as price targets new highs in a short timeframe.


CRO CRONOSImportant notes:
1. Every UP Fibo retracement gets to -0.618 after 0.5-0.618 (correction)
2. The same to correction Fibo retracement
3. UP Fibo retracements 1.618 level matches on the trend line (blue) - 4 times already
4. 1. 1-2-3-4-5 Elliotts Waves UP - DONE + 3 FIbo 0.5-0.618 DONE
5. 2. A-B-C-D-E CORRECTION ELLOITTS WAVES DOWN - DONE
6. After *1-*2 should see uptrend 1-5 Ell.Waves
Summary:
There two short term targets $0.95 and 0.105 that should be reclaimed before the main bull run. We have all the opportunities for that.

Swing Trading Plan For COOKIEUSDTBINANCE:COOKIEUSDT
📄 Trading Idea
💵 Currency $COOKIE
📄 This path is considered positive and forms a Falling Wedge pattern
⭕️ Entry points for this currency: current price 0.1640 and at 0.1329 - 0.1007 at the same size if it experiences a drop
◀️ This is the main support range for the currency to maintain a positive structure. Caution and attention should be given to a break below 0.10
🔼 The main target for this pattern is to rise towards the range of 0.3328 - 0.4044, which is a doubling in the market value of COOKIE currency
🚨 The pattern fails with a break below 0.0703 and is considered distant, so you should calculate the size of your trade correctly before entering and use this analysis

LA/USDT 50-60% move LA/USDT has successfully found solid support after a prolonged downtrend and is showing early signs of a potential reversal. The price has established a strong base, indicating accumulation in the current range. With volume gradually picking up and market sentiment shifting, LA is now poised for a breakout and trend continuation move.
We're looking at a potential upside of 50–60% from the current level if the setup plays out as expected.

CHECK BTCUSD SIGNAL READ CAPTAINbtcusd ) sell zone
( trade satup)
entry point (109.100) to (109.000) 📊
first tp (108.500)📊
2nd target (107.800) 📊
last target (107.200) 📊
stop loss (109.500)

CRO CRONOSCRO plan 2025
Main target 1 $0.16
Main target 2 #0.23
Important notes:
1. Every UP Fibo retracement gets to -0.618 after 0.5-0.618 (correction)
2. The same to correction Fibo retracement
3. UP Fibo retracements 1.618 level matches on the trend line (blue) - 4 times already
*1. 1-2-3-4-5 Elliotts Waves UP - DONE + 3 FIbo 0.5-0.618 DONE
*2. A-B-C-D-E CORRECTION ELLOITTS WAVES DOWN - DONE
3. After Wave 1 and 2 should see uptrend 3-4-5 Ell.Waves

UXLINK price powerfully pumping😱 Totally manipulative asset - $UXlink
When all the altos are growing, OKX:UXLINKUSDT price is in a falling consolidation, when most altos start to “feel bad”, then #UXLINK is pummped.
Now, the MM's goal is obvious - to break the feet of shorts and organize a “short squeeze” and sell a large portion of the asset at high volumes.
Therefore:
1️⃣ Don't shorts - it's too early.
2️⃣ Move your stops at a long position or use a trigger stop.
3️⃣ Short squeeze - are close, above $1.20, it will be sharp... to $1.30 or even to $1.50, or even to $2.15... it is unknown, time will tell)
The only thing that is known is that those who like to trade such manipulative assets will get an unforgettable adrenaline rush, but afterwards the taste will be twofold...
Better watch without participating!)
P.S:
we would buy, not earlier than at $0.26-0.32
_____________________
Did you like our analysis? Leave a comment, like, and follow to get more

XRP DAILY CHART ANALYSISXRP DAILY CHART ANALYSIS 📈
🟩Green lines are “inside trendline” having last interactions with price.
Price did a third touch on the bearish inside trend line yesterday 3rd July @ 2.3157
And current interaction with the bullish “inside trendline” today.
Fundamentally, expect short term USD strength with positive US data as catalyst from yesterday’s release.
Market could extend to closest support @2.1714
If bullish “inside trendline” is broken, we expect support and outer trendline (Black) third touch @2.0181.
If there’s a strong bullish signal convicted to positive XRP or Crypto fundamentals, we expect a bullish move back to at least 2.4
Short term - Bearish 🟥
Medium to long term - Bullish 🟩

ETC DCA Entry Monitor – Support, RSI, and MACD Setupwww.tradingview.com
This layout monitors ETCUSDT for Dollar-Cost Averaging (DCA) entry triggers. Includes:
- Key support zone at $15.70
- RSI > 45 for strength confirmation
- MACD bullish crossover watch
- Alert levels set for $15.70 and $16.62
Built for systematic, long-term crypto DCA entry with alerts and trend signals.

HBAR Price Outlook: Weak Inflows Hold Back Its GrowthHBAR’s price has been stuck under a two-week-long downtrend , currently trading at $0.156. To escape this trend, HBAR will need to show further signs of strength, both from technical indicators and market sentiment.
The Chaikin Money Flow (CMF) indicator has struggled to close above the zero line, signaling weak inflows into HBAR. This is a concerning signal , as the CMF failing to sustain positive movement reflects investor skepticism and a lack of strong buying interest.
Although HBAR briefly crossed into the positive CMF zone for the first time in over a month, the overall market sentiment remains weak.
The first major hurdle for HBAR is breaking and flipping the $0.163 level into support . This is crucial as it would pave the way for the altcoin to reach the $0.180 resistance level. Investors will need to hold their positions through this critical phase, as any premature selling could derail the potential for further gains.
However, the bullish outlook could be invalidated if investor sentiment shifts to selling, whether for profit-taking or due to increased uncertainty. Losing the $0.154 support level would likely result in a drop toward $0.139, ending any hopes for a continued recovery in the short term.
Read More - HBAR Price Struggles to Break Out: What’s Holding the Altcoin Back?

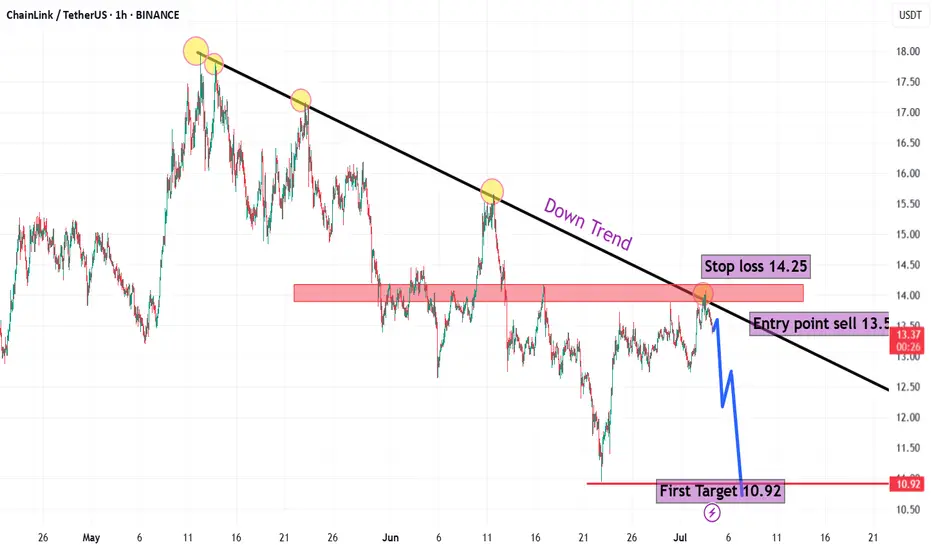
LINK/USD🧠 Technical Overview:
General Trend: The chart shows a clear downtrend starting from mid-May.
Each upward attempt is rejected at the descending trendline, confirming the bearish bias.
🧩 Chart Analysis Elements:
1. Trendline:
Drawn accurately from the major highs, acting as a strong dynamic resistance.
Price has tested this line multiple times and failed to break above it.
2. Supply Zone:
Highlighted in red around the 13.80–14.20 USDT area.
This zone has acted as a strong resistance, causing price to drop again.
3. Entry Point:
Sell at 13.60 USDT, after confirmation of rejection from both the supply zone and the trendline.
4. Stop Loss:
Set at 14.25 USDT, above both the resistance zone and the descending trendline — a logical level to protect the trade.
5. First Target:
10.92 USDT, a clearly identified support level.
This target reflects a likely corrective move within the ongoing downtrend.
📉 Expected Price Action:
Current price is 13.38 USDT, very close to the suggested entry.
If rejection continues from this area, the price is expected to gradually decline toward the 10.92 support level.
The price structure suggests a potential formation of a new lower low.
🔥 Risk-to-Reward Ratio (R:R):
Target: ~2.68 USDT (from 13.60 to 10.92)
Stop Loss: ~0.65 USDT (from 13.60 to 14.25)
R:R = ~4.1:1 → Excellent reward compared to risk.
✅ Conclusion:
The proposed short (sell) trade setup is technically solid and aligns with the broader downtrend.
Classic confirmations: Trendline rejection + Supply Zone resistance + Bearish price action.
Well-placed stop loss and logical support-based target.
Suitable for day traders and swing traders.
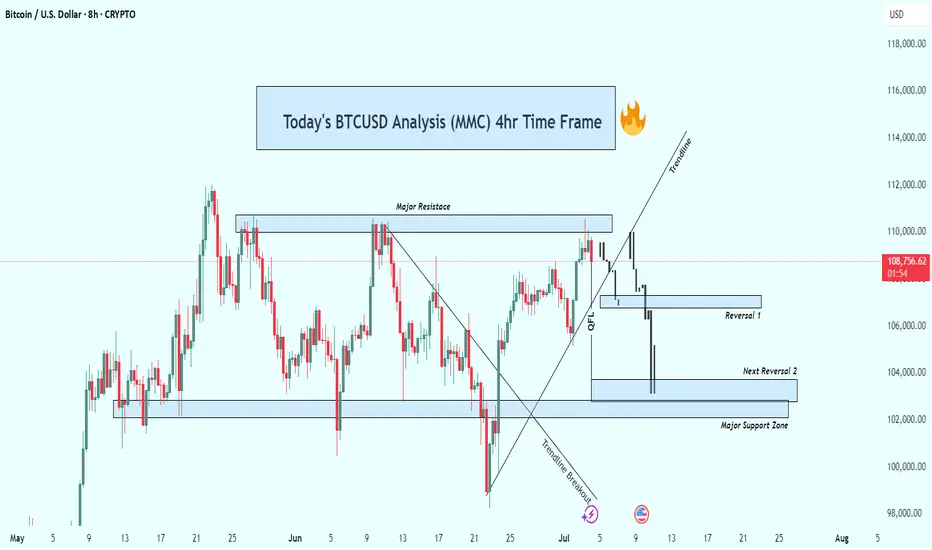
BTCUSD 4hr Technical Analysis : Rejects $110K - Next TargetsOverview:
Bitcoin is currently undergoing a significant technical correction after rejecting a strong resistance level. The 4-hour chart shows a decisive bearish breakdown, suggesting that the bulls are losing control and sellers are gaining momentum. As the price continues to fall, all eyes are now on the major support levels that could trigger a potential reversal—or further acceleration to the downside.
📊 Technical Breakdown:
1. Major Resistance Zone (~$110,000 – $111,000):
This zone has acted as a strong supply area, where price has repeatedly failed to break through. Multiple rejections from this zone confirm it as a key distribution area, where large sellers are stepping in. The repeated failure to close above it shows market exhaustion at the highs.
Multiple candle wicks and strong bearish closes around this area.
Bull traps occurred after brief moves above this resistance, followed by sharp sell-offs.
2. Trendline Breakout:
Previously, BTC had been respecting a rising ascending trendline, which served as dynamic support throughout the last rally. Recently, price broke below this trendline with strong bearish momentum.
This marks a break in market structure.
The trendline retest acted as resistance—textbook confirmation of the trend shift.
3. QFL (Quantity Following Line) Breakdown:
The QFL zone, typically a bullish defense level, has failed to hold. This breakdown confirmed that bulls lost a critical level of control.
Price briefly retested the QFL from below before continuing downward.
This zone now acts as resistance, reinforcing the bearish outlook.
🔻 Downside Targets & Reversal Zones:
✅ Reversal Zone 1 (~$106,000):
This minor support level provided minimal reaction and was quickly breached.
Lack of volume or candle confirmation suggests weak buying interest here.
✅ Next Reversal Zone 2 (~$104,000):
This zone has historical importance as a short-term demand area.
Monitor closely for bullish candlestick patterns, volume spikes, or bullish divergences to assess potential bounce scenarios.
✅ Major Support Zone (~$102,000 – $100,000):
This is the most critical level in the near term.
Historically, price has reversed strongly from this zone, indicating strong buyer interest.
If price breaks and closes below this level, expect a high-probability continuation towards the $98,000 psychological level or lower.
🧠 Market Psychology:
The breakdown from the trendline and QFL indicates panic or profit-taking.
Many late long positions are likely being liquidated.
Smart money may be waiting at the $100K zone to accumulate, depending on market conditions and macro factors.
🎯 Trading Strategy Ideas:
🛑 For Bears (Shorts):
Stay short below $110K resistance.
Trail stop-loss above QFL zone or trendline breakdown.
Look to take profit at $104K and $102K zones.
Add to positions on confirmed bearish retests of broken supports.
📈 For Bulls (Longs):
Wait for clear confirmation (e.g., bullish engulfing, double bottom, RSI divergence) near $104K or $102K before entering.
Avoid catching falling knives—patience is key.
Consider scaling in with smaller position sizes and tight stops.
Watch for a reclaim of the QFL zone or a strong bounce from the $100K psychological level.
🧭 Bias: Bearish
Structure: Lower highs & lower lows.
Momentum: Selling volume increasing, bulls losing steam.
Invalidation: A strong daily close above $111K would flip bias back to neutral/bullish.
🧩 Final Thoughts:
Bitcoin is currently in a fragile state as it retraces from a failed breakout. With multiple key support zones ahead, the next few sessions will be critical in determining whether bulls can reclaim control or if we see deeper downside movement. Watch for signs of exhaustion from sellers or fresh accumulation zones to position accordingly.
Bearish Pressure with Key Resistance at $1.00
The price is trading in the lower half of the Bollinger Bands, suggesting weakness.
Support Levels: Around $0.85 - $0.90 (Recent lows)
Resistance Levels: Around $1.00 - $1.10 (Bollinger mid-band & psychological level)
Bearish Bias: The price remains below the moving average and in the lower Bollinger Band range.
Potential Reversal: If price breaks above $1.00 with increasing volume, it could signal an uptrend reversal.

Is MATIC Nearing a Bottom or More Downside Ahead ?
Lower Highs & Lower Lows: The price consistently prints lower highs and lower lows, confirming a bearish structure.
The price is moving along the lower band, indicating persistent bearish pressure.
The middle band (moving average) is acting as a resistance level.
Support: Around $0.20 - $0.21 (current price zone), as it appears to be stabilizing near the lower Bollinger Band.
Resistance: Near $0.28 - $0.30 (middle Bollinger Band) and a stronger resistance at $0.35.
Volume has been relatively low, suggesting weak buying interest.
If $0.20 breaks down, the next strong support might be around $0.15.

Head and shoulder pattern ADA short boommmmThere is short expected in Ada due to head and shoulder pattern

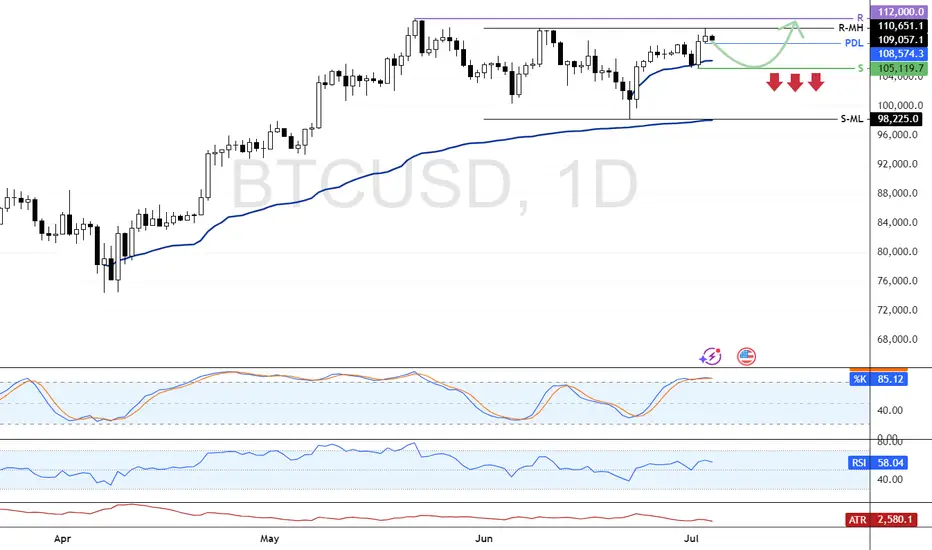
BTC Eyes $105,119 Support Before Targeting $112,000FenzoFx—Bitcoin is trading just below the previous monthly high at $109,110.0, while the Stochastic remains overbought for the third consecutive day, signaling short-term overheating.
Although the broader trend is bullish, a pullback toward the anchored VWAP at $105,119.0 is expected. This level may offer a low-risk reentry, with a potential move toward the all-time high at $112,000.0.
Delphy 400% short 7000% longYeah well, from my levels ill try to short from 0.00865. Then long from 0.00168 to 0.1225.
If it works out, wow, if it dont then ah well, many other oppertunities

AAVE 2100$Aave
AAVE is the largest decentralized non-custodial liquidity market protocol on Ethereum Virtual Machine.
The currency has been moving in an upward trend since its launch.
This is in conjunction with ongoing development of the currency and a strong team.
The currency is considered non-inflationary.
Circulating Supply
AAVE 15.17M
(94.8% of Max Supply)
Monitor prices closely to benefit.
I wish everyone abundant profits.
Like and follow
for more.

ENA SCALP & Intraday Setup Both Long & Short SetupWait for the entries to be filled first. If short entry achieved first then go for the short, if long entry achieved first then go for the long, in both cases must use SL, cause it's consolidating in a range, any side impulse move is expected from ena.

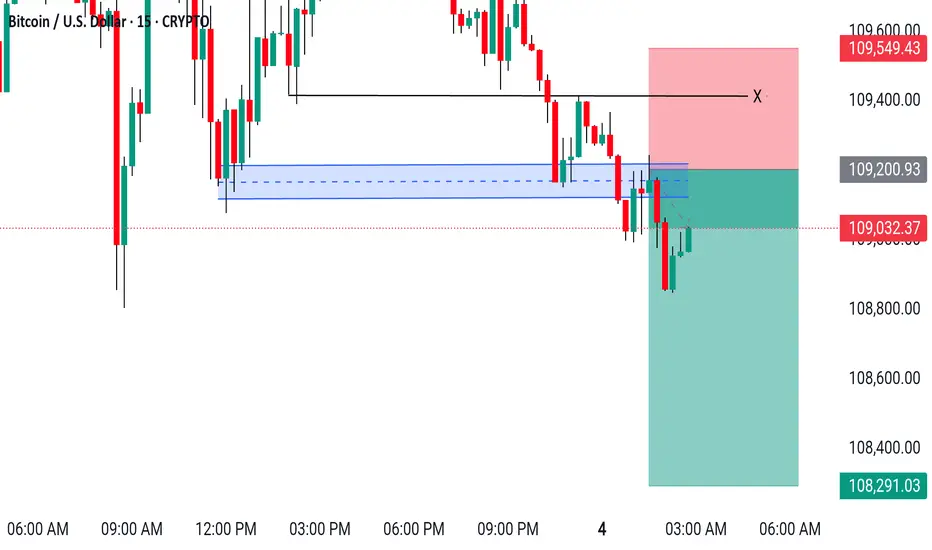
BTCUSD Sell Setup (15M) Chart Analysis BTCUSD Sell NOW
Entry: ~ 109,200
Target : ~ 108,600
Target : ~ 108,290
SL : ~ 109,550