$BTCUSD Trade Setup – Rejection at Channel Highs or BreakoutBitcoin is approaching a key decision point at the top of its descending channel. After bouncing off $100K support and reclaiming the midline, price is now pressing against the upper trendline near $112K. The MACD has just flipped bullish, and momentum is turning upward. However, BTC has repeatedly failed at this level over the last two months, forming a clear resistance zone.
This trade is structured as a short from resistance with tight invalidation above $112K. The setup offers a favorable risk/reward if this rejection holds and BTC pulls back to the $97K–$98K zone.
Entry: ~$108K
Stop: ~$112K (channel breakout)
Target: ~$97.5K (lower channel support)
If BTC breaks and holds above $112K, that would invalidate the short thesis and likely flip the structure toward a full breakout scenario.
Crypto market

BTCUSDT - going to 113866.19$My analysis is based on numerology, all the numbers you see on the chart are from the same place. There is a certain numerological symbolism, which tells me that the price has already put the bottom 49(13) and will make a reversal from the zone 52260+- and then will fly strongly upwards with the target first 89k bucks, and after 113k. It's time to look for a good entry point.

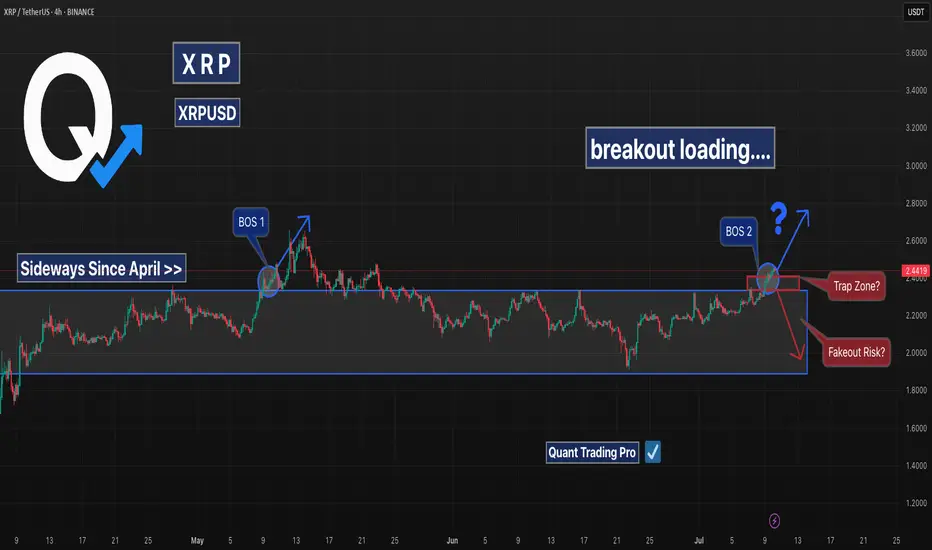
XRP Breakout Loading… or Just Another Trap?XRP has been locked in a sideways range since early April, bouncing between $1.90 and $2.45 for nearly 3 months.
Now, it’s pressing into the top of that range once again — and traders are watching closely for either a confirmed breakout or another fakeout rejection.
📊 Technical Breakdown:
🔹 Sideways Since April: The structure has been consolidative and indecisive.
🔹 BOS 1 + BOS 2: Each break of structure led to temporary rallies — but failed to hold above resistance.
🔹 Trap Zone Identified: ~$2.45–$2.50 has repeatedly acted as a liquidity magnet.
🔹 Fakeout Risk Still Present: Without strong follow-through, this could reverse into the range again.
📈 Breakout Scenario:
• Clean candle close above ~$2.50
• Targets: $2.90 and $3.20
• Look for volume confirmation
📉 Rejection Scenario:
• Wick into resistance + bearish engulfing
• Back to midrange or support zone ~$2.10
Bitcoin at Triple Resistance – Will the Third Time Break It?BTC/USD is pressing against a key resistance zone near $112,500 for the third time in recent months.
This time, the breakout attempt is backed by a clear ascending trendline, showing sustained bullish pressure from the lows.
Highlights:
Triple top formation? Or ascending triangle breakout?
$112.5K has rejected BTC twice already
Higher lows = buyers stepping in more aggressively
Watch for volume surge and daily close confirmation
Break above = $118K–$120K likely in play.
Reject = revisit of trendline support near $106K.

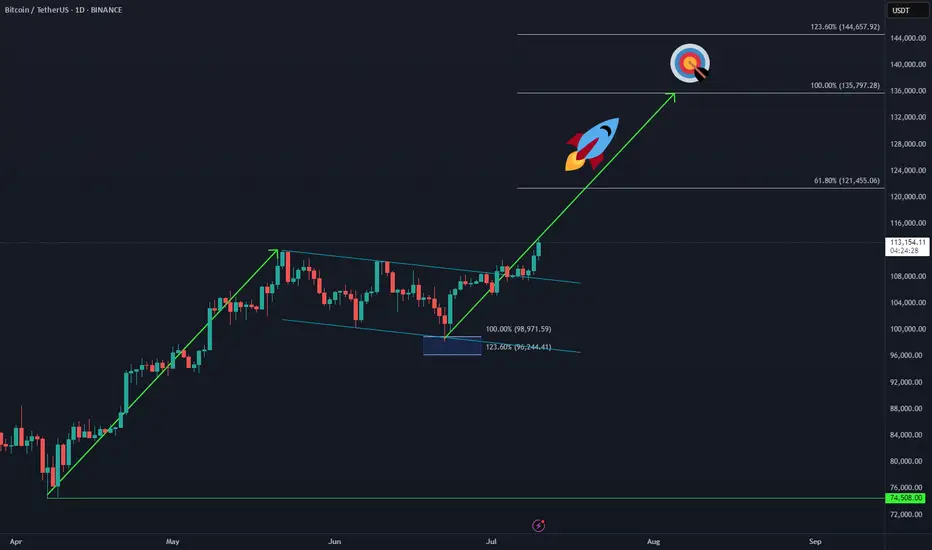
Bitcoin Makes New ATH – Next Sequence in Play 🚀 CRYPTO:BTCUSD has officially broken into new all-time highs, confirming the next bullish sequence is underway.
The upside projection now opens toward the $135K–$144K zone, aligning with long-term Fibonacci extensions and cycle projections.
📌 As always, it won’t be a straight line—expect step-by-step progress, with consolidations and pullbacks along the way. But the structure remains bullish, and the path is unfolding.
BTC is on track!This is what four month for Bitcoin can look like and you really think 230k in October 2025 is far-fetched?? You better rethink that.

07/07/25 Weekly OutlookLast weeks high: $110,529.95
Last weeks low: $105,108.81
Midpoint: $107,819.38
The "Big Beautiful Bill" was signed into law last week on the 4th July, a huge event in the financial world and undoubtedly the world of crypto. The debt ceiling is now instantly raised by $5T making risk-on assets even more appealing than ever, incoming demand shock will likely help BTC but also the struggling altcoin market as well.
Last week the BTC ETFs saw a net inflow of $294m. This takes the total 30-day inflows to nearly 50K BTC and this is before the big beautiful bill was passed. PA wise, BTC is still struggling to break the $110k level and flip ATH, however the consolidation just under ATH with increasingly shallow pullbacks suggests a run at the highs is in the near future IMO.
For this week US CPI & PPI data are the important release for the week. It's hard to tell if the data releases will actually provide any volatility this time around, they usually do but the FEDs refusal to act has made the last few CPIs very flat in terms of volatility for BTC.
Key battleground for me this week would be the midpoint, clearly last week provided good support, however a larger area of inefficiency rest just under that it so there is a natural pull for price to revisit those areas. Could be a choppy week once again...
Good luck this week everybody!

Bitcoin can rebound up from support line of upward wedgeHello traders, I want share with you my opinion about Bitcoin. In this chart, we can see how the price dropped from the 102800 support level, which coincided with the buyer zone, and later entered to wedge upward. In this pattern, price made an impulse up from the support line of the wedge pattern and broke the 102800 support level, after making a retest, and continued to move up. Bitcoin rose to the current support level, which coincided with a support area and even entered this area, but soon turned around and fell below. Next, price rose to this area again and then made a correction movement, after which it turned around and made an impulse up to the resistance line of the wedge, breaking the 108000 level. After this movement, the price bounced from this line and fell back to the current support level, where it some time traded in the support area. Later price rebounded and continued to move up. Now, I expect that BTC can correct to support line of the wedge and then rise to the resistance line of this pattern. That's why I set my TP at the 112600 points, which coincided with this line. Please share this idea with your friends and click Boost 🚀
Disclaimer: As part of ThinkMarkets’ Influencer Program, I am sponsored to share and publish their charts in my analysis.

BTC/USD Today: Momentum Builds Toward the Next BreakoutBITSTAMP:BTCUSD Today: Momentum Builds Toward the Next Breakout
Previously on BTC...
1. Double Top Pattern and Target Hit
The chart shows a classic double top (early 2025), a bearish reversal pattern. Once the neckline broke, the price plunged and nailed the technical target (red arrow)—as if Bitcoin had read the textbook.
2. Trendline Break = Game Changer
After bottoming out, BTC broke through a downward sloping trendline, triggering a strong bullish move. This breakout signaled a trend reversal, and the market responded accordingly.
3. Perfect Pullback
Once the breakout played out, the price retraced back to previous resistance, now turned support. This “perfect pullback” is the kind of thing that makes technical analysts smile in their sleep.
4. Bull Trend Confirmation
The successful retest of support confirmed that Bitcoin had shifted from neutral/bearish into a full-on bull trend. Buyers stepped back in with confidence.
📊 BTC/USD – Current Outlook
Bull Flag Forming
Currently, price action is consolidating into a bull flag, a continuation pattern often seen mid-rally. If it breaks out to the upside, the projected target sits near $120,000 .
🚀 Bullish Catalysts:
- Strong structural trend: Higher highs and higher lows are still intact.
- Post-halving momentum: Historically, Bitcoin tends to go beast mode 6–12 months after each halving—and we’re right in that sweet spot.
- ETF inflows : Institutional capital continues pouring into Bitcoin ETFs, adding steady buying pressure.
- Supply crunch: With more BTC leaving exchanges, sell-side liquidity is drying up. Hodlers are hodling.
- Technical setup: A confirmed breakout from the bull flag could trigger a powerful leg higher.
⚠️ Risks and Levels to Watch:
A breakdown of the bull flag could send BTC back toward the $98k–91k range.
Macro headwinds (rate hikes, economic slowdown, dollar strength) could still rain on crypto’s parade.
🧠 Conclusion
This chart paints a textbook bullish setup for Bitcoin. The double top is in the rearview mirror, the trendline breakout gave us the green light, and now the bull flag is loading the next move.
If the breakout happens, the next destination could be $120,000.
It’s one of those “don’t blink” moments—BTC might just be stretching before its next sprint.

ADA- Cardano - Classic Exit from Range with Plutus signalReading the chart :
AVWAP acted as resistance and we started ranging.
This is a classic entry long for the "SI traders" called Exit from Range with a Plutus signal and in this case it was the PRL signal.
ADA is heading for a major Fib I will not advise any entries now.
Enjoy wave and speed index reading!

Inverted head and shoulder suspected ..keep an eye on necklineHi dear friends and followers, I suspect this inverted head and shoulders pattern with a neckline around 160 usd. If it breaks in, it can go down toward the inferior support level around 130 usd and the 0.618 Fibo. If it breaks out it can go up until the next resistance and psychological level of 200 usd. As you can see, this 200usd resistance level does match with a large ascending channel.
You all need to DYOR and keep an eye on RSI and volume to confirm the movement and take a trade.
Wishing you the best and success on your decision.

OPUSDT 1D#OP is on the verge of breaking out above the descending resistance and the SMA50 on the daily chart. The setup looks promising — keep a close eye on it.
In case of a breakout, the targets are:
🎯 $0.647
🎯 $0.706
🎯 $0.764
🎯 $0.848
🎯 $0.954
⚠️ As always, use a tight stop-loss and apply proper risk management.

#XAI/USDT#XAI
The price is moving within a descending channel on the 1-hour frame, adhering well to it, and is on its way to breaking it strongly upwards and retesting it.
We have a bounce from the lower boundary of the descending channel. This support is at 0.0476.
We have a downtrend on the RSI indicator that is about to break and retest, supporting the upside.
There is a major support area in green at 0.0472, which represents a strong basis for the upside.
Don't forget a simple thing: ease and capital.
When you reach the first target, save some money and then change your stop-loss order to an entry order.
For inquiries, please leave a comment.
We have a trend to hold above the 100 Moving Average.
Entry price: 0.0483
First target: 0.0502
Second target: 0.0517
Third target: 0.0532
Don't forget a simple thing: ease and capital.
When you reach the first target, save some money and then change your stop-loss order to an entry order.
For inquiries, please leave a comment.
Thank you.

BTC/USD: Bitcoin Holds Above Key Support — Target at 113,388Market Overview:
Bitcoin is trading near 111,250 after breaking out of a descending structure and forming a bullish channel. The price has firmly established itself above the daily level of 110,600, signaling continued bullish momentum. The market is now aiming toward the channel’s upper boundary.
Technical Signals & Formations:
— Completed ABCD pattern
— EMA supports the bullish bias
— 110,600 now acts as key support
— Upside potential toward 113,388
Key Levels:
Support: 110,600, 109,115
Resistance: 112,000, 113,388
Scenario:
Primary: As long as BTC holds above 110,600, a move toward 112,000 and 113,388 remains likely.
Alternative: A drop below 110,600 may trigger a pullback toward 109,115.

111-112 Resistance LevelOnce BTC breaks above the 111-112 resistance level and flips it into support we should see price run to 125+ rather quickly. If history echoes, price discovery could easily touch 150, if not 175-200. Also, we should see BTC entering the "euphoric" phase of the cycle around the week of Aug 18th. Fun days are ahead :) remain vigilent!

Bitcoin Breaks All-Time High: What’s Next?Bitcoin (BTC) has once again captured the world’s attention by smashing through its previous all-time high (ATH). This milestone has sparked excitement and speculation across the crypto community and beyond. But the key question remains: Will BTC continue its upward trajectory, or is a correction on the horizon?
Long-Term Outlook: The Bullish Case
In the long run, the fundamentals for Bitcoin remain strong. Several factors support a positive outlook:
Institutional Adoption: More institutional investors are entering the market, providing greater liquidity and legitimacy.
Scarcity and Halving Cycles: Bitcoin’s fixed supply and periodic halving events historically drive long-term price appreciation.
Macro Trends: Ongoing concerns about inflation and fiat currency devaluation continue to make BTC an attractive hedge.
Given these dynamics, we believe Bitcoin’s long-term trajectory remains upward.
Short-Term Caution: A Correction May Be Coming
While the long-term view is optimistic, the short-term picture may be less rosy:
Overheated Market Indicators: Rapid price surges often lead to overbought conditions, increasing the likelihood of a pullback.
Profit-Taking: After breaking ATH, some investors may lock in gains, adding selling pressure.
Technical Resistance: Historical patterns suggest that corrections often follow major breakouts.
We anticipate a potential correction, possibly pulling BTC back to the $90,000 range. This adjustment could unfold in the coming week or weeks as the market digests recent gains.
What Should Investors Do?
Stay Calm: Volatility is part of the crypto landscape. Corrections are healthy for sustainable growth.
Focus on Fundamentals: Remember why you invested in BTC in the first place.
Consider Dollar-Cost Averaging: Spreading out purchases can help mitigate the impact of short-term swings.
Conclusion
Bitcoin’s break above its all-time high is a testament to its enduring appeal and the growing confidence of investors. While a short-term correction may be likely, the long-term case for BTC remains compelling. As always, prudent risk management and a focus on fundamentals are key to navigating the exciting—and sometimes turbulent—world of crypto.
Do not consider it as investment advice.
#crypto #bitcoin #analysis

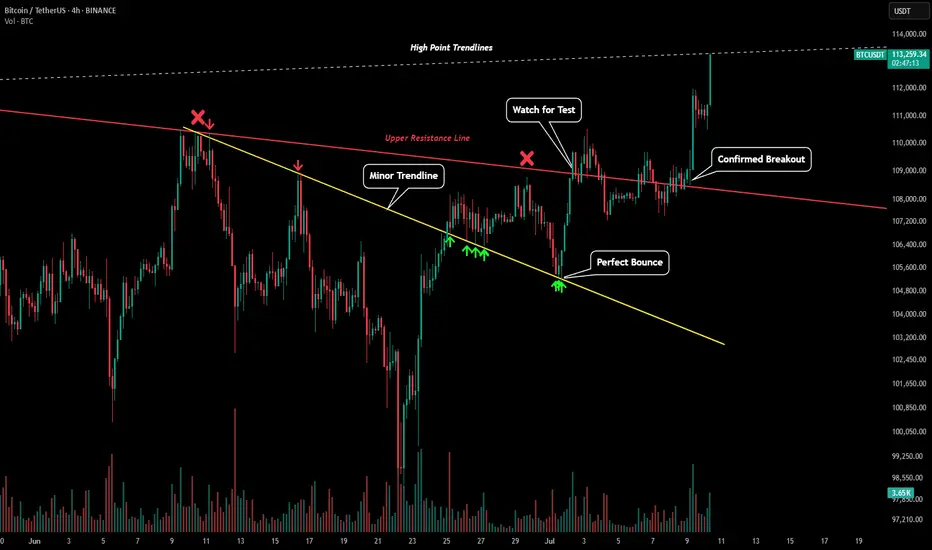
BTC - ATH After Perfect PredictionPlease refer to our previous post:
After a picture perfect test of our lower trendline of support price rallied back to our red trendline.
Price chopped back and forth around this trendline for a few days before finally confirming the breakout. Now BTC has hit a new all time high and is currently at our white upper high point trendline. Looking for confirmation closes above to continue the rally.
Ethereum Breakout Unleashed: Major Upside Targets in Sight The ETH/USD 2-hour chart reveals a classic ascending triangle formation, which has now been decisively broken to the upside. After consolidating within a tightening range for several sessions, Ethereum has surged past the horizontal resistance level, supported by Ichimoku cloud structure and rising trendline support. The breakout candle is strong, indicating bullish momentum and potential for further upward movement. The breakout aligns with increasing volume and market confidence. This technical setup suggests a possible rally continuation toward higher resistance zones marked above. The structure remains bullish as long as price holds above the breakout zone with minimal retracement.
Entry: 2,570
1st Target: 2660
2nd Target: 2,850

BITCOIN WE shared for free the strcuture of bitcoin and it came back 100% complete. On break and retest and 116k is target and 126-128k will be watched.
trading is probability and any key level can fail.

#SUI/USDT#SUI
The price is moving within a descending channel on the 1-hour frame, adhering well to it, and is heading toward a strong breakout and retest.
We are experiencing a rebound from the lower boundary of the descending channel, which is support at 2.90.
We are experiencing a downtrend on the RSI indicator that is about to break and retest, supporting the upward trend.
We are heading toward stability above the 100 Moving Average.
Entry price: 3.00
First target: 3.07
Second target: 3.15
Third target: 3.24

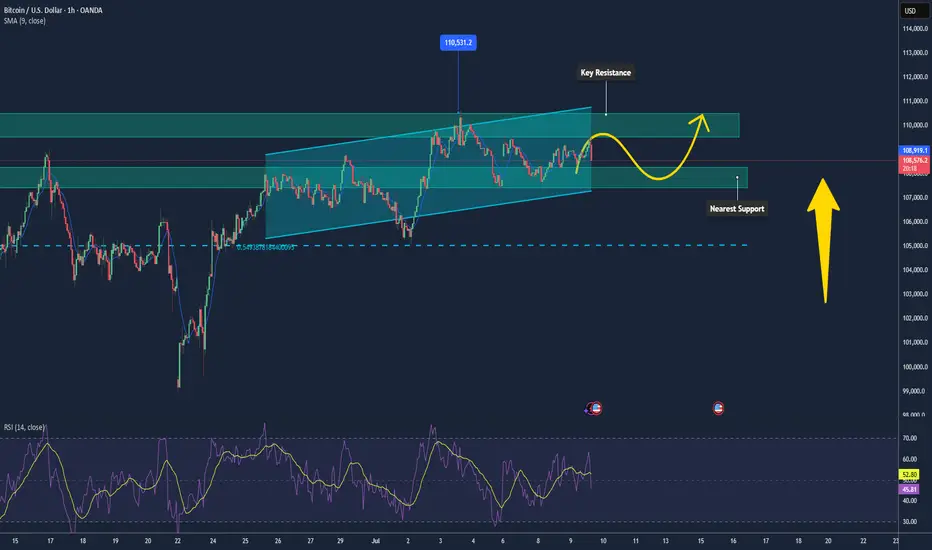
Bitcoin Maintaining Mild Uptrend, Poised Toward $110k📊 Market Overview:
• Strong ETF inflows continue, with over $13.5 billion in YTD flows into BTC, now making up nearly 70% of gold ETF inflows.
• Institutional investors like BlackRock (IBIT currently holds ~700k BTC) are still accumulating. The U.S. is also building a “Strategic Bitcoin Reserve,” reinforcing long-term confidence.
📉 Technical Analysis:
• Key Resistance: $109,000–$110,000, opening the path toward $110,500–$110,600 (Supertrend around $110,174).
• Nearest Support: $108,300 (EMA), followed by $107,800–$108,000; deeper pullback support at $105,000.
• EMA 09: Price is above this EMA → short-term trend remains bullish.
• Candlestick/Volume/Momentum: RSI is neutral around 58; MACD is converging near the zero line, signaling weakening bearish momentum and possible base formation.
📌 Outlook:
Bitcoin may continue its mild upward movement if it holds above $108,300–$108,000 and breaks clearly above $109k–110k with strong volume. Failure to do so could trigger a pullback toward $107,000–$108,000.
💡 Suggested Trading Strategy:
📉 SELL BTC/USD at: 109,500–110,000
🎯 TP: 108,000
❌ SL: 110,400
📈 BUY BTC/USD at: 108,200–108,500
🎯 TP: 109,500–110,000
❌ SL: 107,800
$ETHUSDT: Uptrend signal in the daily timeframeEthereum is ready to move higher, as I anticipated when the BINANCE:ETHBTC signal flashed...
Best of luck lads!
Cheers,
Ivan Labrie.

#SEI/USDT#SEI
The price is moving within a descending channel on the 1-hour frame, adhering well to it, and is on its way to breaking it strongly upwards and retesting it.
We have a bounce from the lower boundary of the descending channel. This support is at 0.2470.
We have a downtrend on the RSI indicator that is about to be broken and retested, supporting the upside.
There is a major support area in green at 0.2440, which represents a strong basis for the upside.
Don't forget a simple thing: ease and capital.
When you reach the first target, save some money and then change your stop-loss order to an entry order.
For inquiries, please leave a comment.
We have a trend to hold above the 100 Moving Average.
Entry price: 0.2494
First target: 0.2545
Second target: 0.2600
Third target: 0.2690
Don't forget a simple thing: ease and capital.
When you reach the first target, save some money and then change your stop-loss order to an entry order.
For inquiries, please leave a comment.
Thank you.
