Possible upside before selling.If price holds above 0.50572, rhen we expect a push towards the previous high, then a sell that's will take it to the trendline. However if price cannot hold that support, then we expect a sell to continue as there's a trendline breakout and retest below around 0.49024
Crypto market

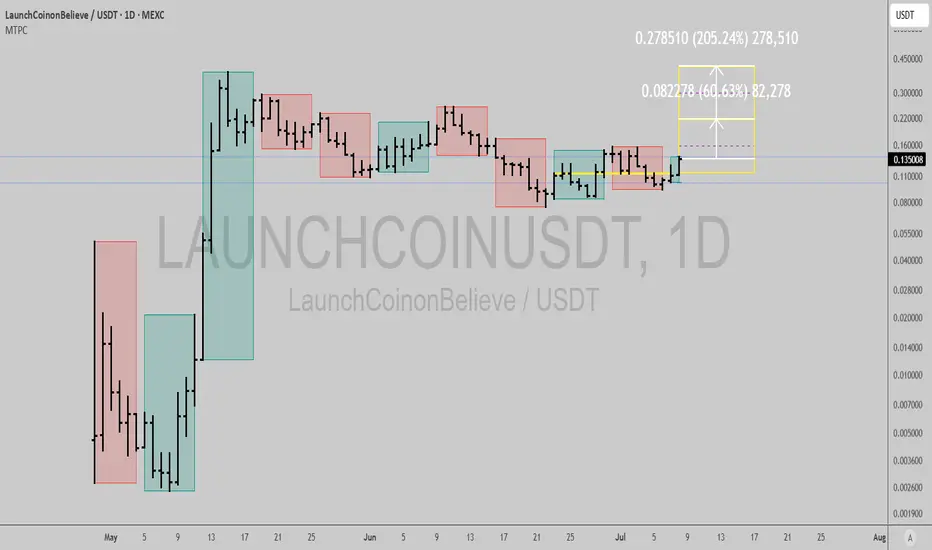
LAUNCHCOIN long: bottom of the correction?Interesting time at mode signal with good upside here.
Best of luck!
Cheers,
Ivan Labrie.
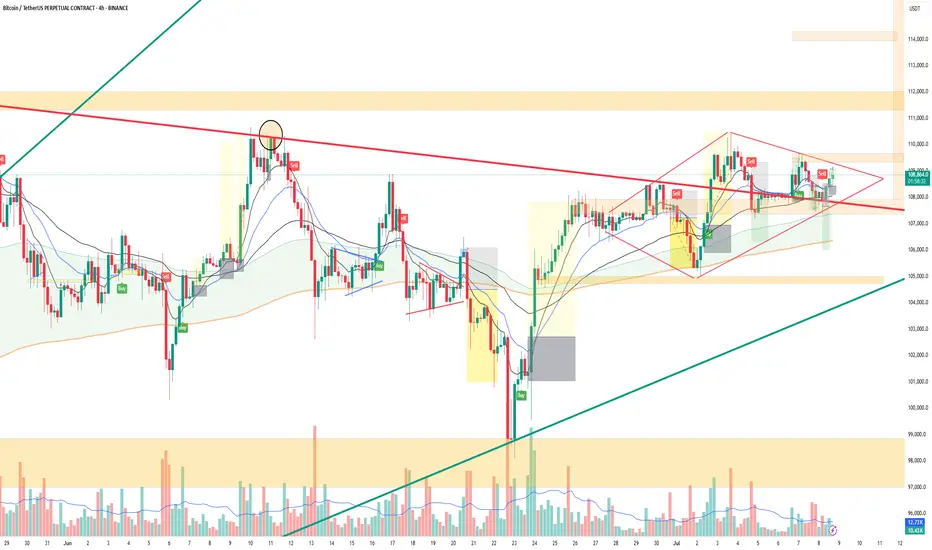
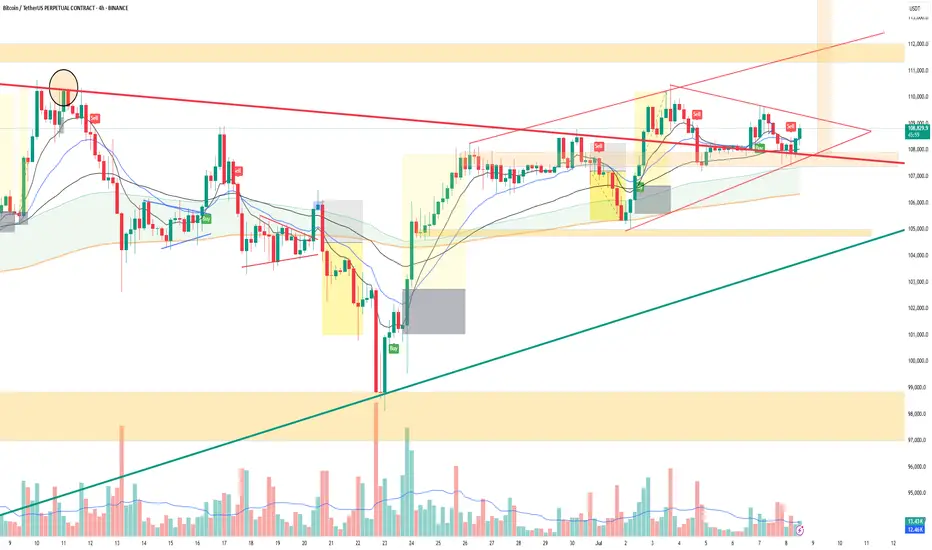
Diamond Pattern Context (4H BTC Chart)The structure forming from June 27 to July 8 appears to be a diamond top, a reversal pattern often seen after uptrends.
Price expanded (broadening left) and then started converging (right side) — classic diamond symmetry.
It has developed right at the macro trendline resistance (~109.5K), increasing its reliability.
Volume has declined during the right half of the diamond, which is consistent with pattern expectations.
✅ Implications of Diamond Pattern
Bearish Bias (Diamond Top):
If price breaks below the lower boundary (~107.8K), it confirms the pattern → potential move to 104.5K–102.5K zone.
Measured move ≈ height of pattern (109.8K–106K) ≈ 3.8K drop.
Invalidation/Bullish Flip:
Break and hold above 109.5K with volume would invalidate the bearish diamond.
In that case, it flips into a squeeze breakout with upside to 110.8K–111.5K+.
🎯 Conclusion:
The diamond top, combined with macro resistance and declining volume, strengthens the bearish breakdown scenario.
However, no confirmation yet — remain neutral to bearish unless either:
✅ Clean breakout >109.5K
🔻 Breakdown <107.8K with volume
KAVA/USD Swing Trade Setup - High Risk/Reward Opportunity*Trade Parameters*
- Entry: $0.398 (historical support zone)
- Stop Loss: $0.375 (5.8% risk)
- Take Profit: $9.00 (2,160% potential upside)
- Risk/Reward Ratio: 1:37
*Technical Analysis*
- Strong support between $0.38-$0.40 (multiple tests)
- Breakout confirmation above $0.42 could target $0.55 initially
- Potential to retest all-time high near $9.00 in bullish market
- RSI currently near 30 (oversold territory)
*Trade Rationale*
- Exceptional risk/reward profile for long-term holders
- Historical precedent of altcoins gaining 10x-50x during bull markets
- Small risk (5.8%) for potentially massive upside
*Fundamental Drivers*
- Growing Kava ecosystem with increasing TVL
- New DeFi integrations and cross-chain developments
- Potential upcoming partnerships and exchange listings
- Positive correlation with Bitcoin's halving cycle
*Risk Management Notes*
- Consider this a multi-year investment, not short-term trade
- Recommended partial profit-taking at:
$0.55 (38% gain)
$1.50 (277% gain)
$5.00 (1,156% gain)
- Strict stop loss required at $0.375
*Conclusion*
This setup offers speculative but mathematically favorable asymmetry for patient investors. The small initial risk justifies the potential for exponential returns if market conditions align with KAVA's fundamentals.
Remember to always conduct your own research and never risk more than you can afford to lose.

ethI have a strategy with 80% win rate.
The essence of it is that by the end of October, we will not see ETH above 4100.
On the other hand, we are still within the body of the 12-month candle from 2021. In 2024, we failed to hold above 3700, which indicates weakness and increases the likelihood of a move toward the 2021 low, around 700.
Right now, this sounds pessimistic and I don't like this scenario, but that’s how I see the chart.

TRX USDT SHORT TRADE SETUPTRX/USDT is currently holding at a strong resistance zone, with a high probability of an downward price move. Also EMA 200 acting as a magnet to pull price downward for TRX.

2025 Altcoin LeaderTOSHI, the primary meme on BASE, is tightening up at the end of a 1.5 year base. Looking back at prior leaders like DOGE (2021) and XRP (2017), they based for ~1.5 years before breaking out and going on their huge runs.
BASE likely to lead crypto this year given Coinbase's efforts and connections with Washington and TradiFi firms like BlackRock.

ACHUSDTHello everyone. This is purely my vision in connection with the resignation of the head of the Federal Reserve, Jerome Powell. The lending rate will be reduced and this will cause a reaction in the markets. I consider this seller's block as the first stopping point.

BONK BBTrend Flips Positive After 30 Days — Bullish Momentum InBONK’s BBTrend indicator has just flipped positive for the first time in 30 days, potentially signaling the start of a new bullish phase. This is a notable shift, especially after a prolonged period of low momentum and sideways consolidation.
The BBTrend indicator is used to measure both the strength and direction of a market trend. When its value is negative, it typically suggests bearish or neutral conditions, where sellers dominate or price action lacks clear direction. For the past month, BONK has been stuck in this zone — until now.
This fresh flip into positive territory suggests that buying pressure is beginning to outweigh selling pressure, with momentum gradually shifting in favor of the bulls. If this trend continues, BONK could be gearing up for a sustained rally in the days ahead.

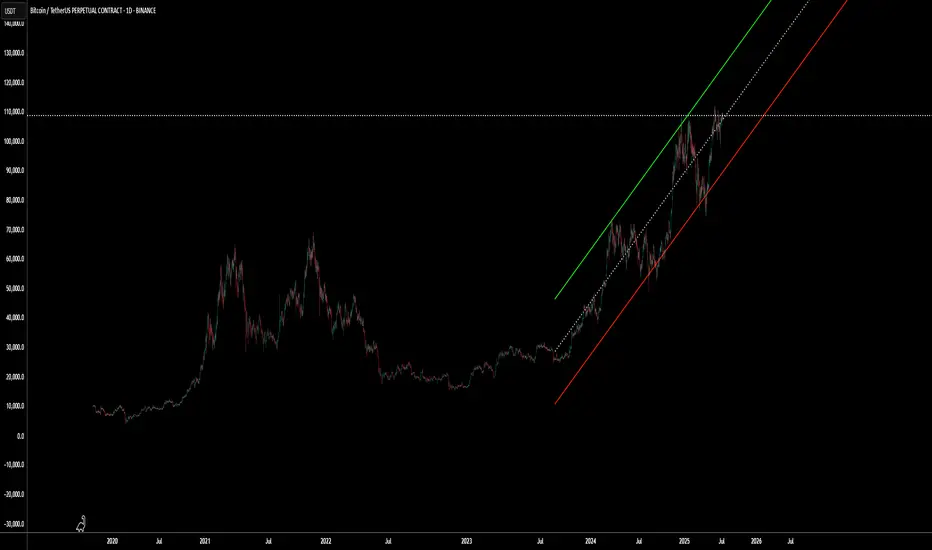
BTC Forming Second Diamond: New ATH Targeting $115K–$120KAfter topping out at the previous ATH, Bitcoin formed a classic diamond top pattern which triggered a drop to the $98,115 level. Now, Bitcoin appears to be forming a second diamond — but this time, the breakout structure suggests a bullish reversal rather than a top.
This second diamond formation indicates consolidation before a strong upward move, potentially driving BTC toward a new all-time high between $115K and $120K.
Watch for confirmation of the breakout. If price holds above key resistance levels post-pattern, the bullish scenario gains strength.

AVAX Tightening Into Apex — Will This Breakout Stick?AVAX has been forming higher lows while capping out at diagonal resistance, tightening into a symmetrical triangle. Stochastic RSI is nearing the top, suggesting an explosive move could be near.
🟢 Scenario 1 – Bullish:
Breakout above the triangle + 50 EMA ($19.30) could push price toward $22–$24. Look for strong volume confirmation.
🔴 Scenario 2 – Bearish:
Failure to break out may lead to a rejection and revisit of major support around $15.50. Watch for loss of ascending structure as a warning sign.
This post is not financial advice.

ETH/BTCPrice is following an AMD structure with a liquidity sweep to the downside. For full confirmation of the setup, a daily FVG inversion is required.
Watching closely — confirmation will unlock further directional bias.

BTC PRICE PREDICTION
According to my personal analysis, Bitcoin has the potential to reach between $112,000 and $120,000.
Everyone should hold onto their coins confidently and avoid panic. The market is expected to move upward. Stay focused and trust the process.

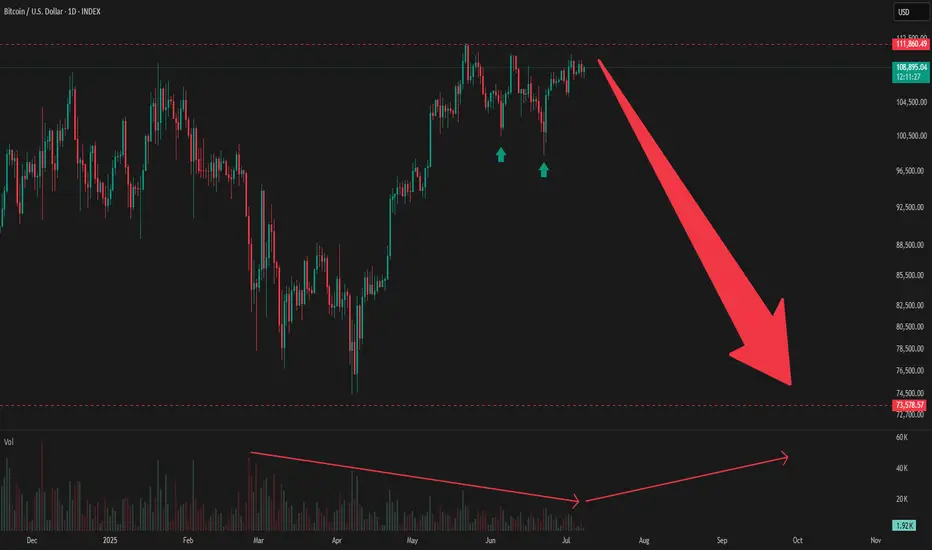
On the Short-Term Future Direction of BitcoinBitcoin is currently failing to sustain its upward momentum from its recent high, and trading volume is on the decline.
I would cautiously predict that it is preparing for a downward move.
An increase in trading volume accompanying a price drop is anticipated.
Buy limit Ape -Reteste trendline red
-fakeout trendline green
- last impuls respects fib 0.6 going for completion

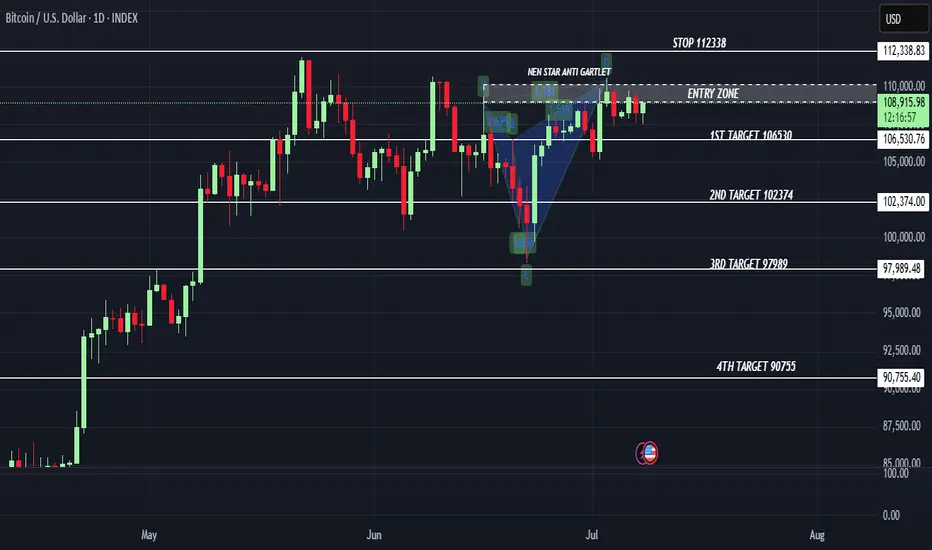
NEN STAR ANTI GARTLEY+ TRIPLE TOP FORMATION ON BTC A very clear bearish structure forming on BTCUSD daily chart with triple top and anti gartley pattern showing potential down side movement in coming sessions if BTCUSD crosses 112000 and sustains above then we may see further upside and the whole bearish setup becomes invalid, targets for downside are mentioned in the chart along with entry zone

BTCUSDT 4H Analysis | Apex Decision ZoneStructure & Price Action
BTC is consolidating within a symmetrical triangle (red trendlines).
Price is squeezing near the apex, suggesting an imminent breakout.
Strong defense at ascending channel support (~108K zone) + green trendline.
Lower highs indicate sellers still active, but higher lows reflect buyer strength too.
Price bounced from previous demand block (green box), now pushing toward resistance.
📊 Indicator Confluence
RSI: Curling up from mid-range (~52–55), no divergence, neutral-to-bullish tilt.
DMI/ADX: ADX rising slightly, -DI weakening vs +DI → potential trend shift brewing.
MACD: Histogram flat; momentum hasn't confirmed either side yet.
Wave Trend: Bouncing from mid-line, bullish cross may form if price breaks triangle.
Volume: Gradual decline = typical pre-breakout compression. Watch for spike.
Stochastic: Flipped bullish from oversold — early bullish bias.
🎯 Summary & Probabilities:
BTC is coiling near triangle apex — breakout likely soon.
🔼 Break above 109.4K with volume → 60% chance of move to 110.5K–111.5K.
🔽 Drop below 107.9K → 40% chance of fall to 106.3K–104.4K.
Bias: Neutral-to-bullish — confirmation needed.
buy entry algoContinuation of upwards movement:
-Trendine retest Red
-Trendline Fakeout Green
-Fib completion to the upper side (last impuls respected 0.6fib)

Is the Fear & Greed Index Becoming a Victim of Its Own Success?I’ve noticed something about the Fear & Greed Index that rarely gets discussed:
Its reputation as a “contrarian indicator” may actually dampen market declines. When everyone sees “Extreme Fear” and believes it’s time to buy, the panic doesn’t deepen as it might have in the past—potentially muting major market lows.
This creates a feedback loop:
The index signals “buy the fear,”
Enough traders pile in,
The market stabilizes before real capitulation sets in.
When a widely-followed counter-indicator becomes common knowledge, it can lose its edge. In today’s markets, these signals may serve more as social safety nets than as true predictors of sentiment extremes.
Bottom line: If the “fear” signal stops working, or stops triggering buying, it could be a warning that the market’s safety net is gone. I wonder, is the VIX subject to the same mitigating effect?
The Fear & Greed Index has never been truly tested during a long term bear market.
But then it may partly be why we have not had one in so long.
Would love to hear your thoughts—has anyone else noticed this effect?
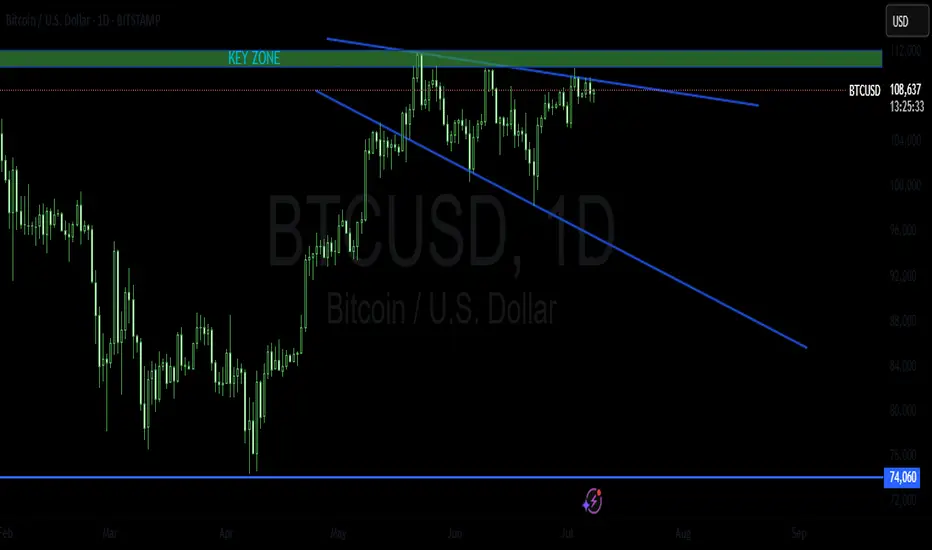
BTCUSD LONG TRADE PLANFollowing a classic technical view. The instrument has been trading in a global bull trend. Recently, it formed a descending expanding wedge pattern next to a key zone which I view as an accumulation.
When to buy ? In my view, I will only buy if breakout of this pattern and break above the key zone.
Please do your own analysis before placing any trades.
Cheers and Happy Trading !!!!
SEI | Waiting for a Higher LowSEI/USDT is currently setting up for a potential higher low formation, but confirmation is still pending. The price action shows promise but requires patience for the setup to materialize.
Current Situation:
Price is testing the orange ascending trendline support around $0.21
Waiting for a confirmed bounce to establish the higher low
The projected path (pink arrow) outlines the anticipated bullish trajectory
Key Levels to Watch:
Critical Support: Orange trendline around $0.21 (must hold)
Confirmation Level: Clean bounce above $0.22-0.23
Target: $0.33 resistance zone if higher low confirms
What's Needed:
Strong rejection from current support levels
Volume increase on any bounce attempt
RSI showing bullish divergence signals
Risk Factors:
Break below orange trendline would invalidate the setup
Failure to establish higher low could lead to further downside
Market conditions may impact the pattern's success
This is a wait-and-see scenario where patience is key. The higher low formation will only be confirmed once price demonstrates clear rejection from support and begins moving higher.

XRPUSD – From Breakout to BacktrackXRP staged a sharp breakout above $2.34 before completely unwinding that move back into $2.25. It’s now showing signs of recovery, pushing into $2.28–$2.29, but the prior high remains untested. Watch for bullish continuation only above $2.30, otherwise we stay inside a lower-high structure.
