ABC Flat correction? Verifiably had Elliot wave impulse wave that reach completion. Going sideways was the correction. There’s either gonna be a breakout, which is likely, Or a correction to the downside.
Since it is Fourth of July weekend, There’s plenty of room for global markets to greatly impact weekend trading. We’ll know by Monday, what Trump has said, what Elon has done, And with the wars results are.
Hold on tight.
Any correction to the downside is opportunity for institutions to further increase their anchor hold greater chunks of market liquidity.
That’s all for today.
Welcome back,
Sincerely yours
Paul Dorz
Crypto market

AWEUSDT Forming Bullish TrendAWEUSDT is gaining momentum among traders as it shows signs of a promising breakout from its recent consolidation zone. The chart highlights how the price has tested a key support zone multiple times and has now begun to push upward with increasing volume, suggesting that accumulation is taking place. This healthy volume is often the first sign that smart money is entering the market, laying the groundwork for a sustained rally.
Currently, technical indicators point towards a short-term bullish trend with a potential gain of 30% to 35%+. Such a move could be fueled by the break above the highlighted accumulation area, which has acted as a solid base for this possible upside. Traders looking for opportunities in altcoins with clear risk-to-reward setups will find AWEUSDT’s structure attractive as it shows a balance of stability and momentum.
Adding to the optimism is the fact that more investors are showing interest in this project, hinting at improving sentiment and stronger fundamentals. As the market sentiment improves, coins like AWEUSDT with good liquidity and technical patterns often lead the way for short but impactful moves. It’s a setup worth monitoring closely for swing traders who thrive on these breakout opportunities.
✅ Show your support by hitting the like button and
✅ Leaving a comment below! (What is You opinion about this Coin)
Your feedback and engagement keep me inspired to share more insightful market analysis with you!

ETHUSD broke the Resistance level 2550.00 range 👀Possible scenario:
Ethereum (ETH) jumped to $2,600, its highest in three weeks, following a 6% surge as firms explore THE for treasury reserves. Despite a 24% YTD drop, analysts see a setup for a breakout to $7,000.
Related stocks rallied: BitMine rose 20%, Bit Digital 6%, and Sharplink Gaming soared 28% after adding $2M in ETH—now holding $485M, per Arkham Intelligence. Ethereum ETFs saw $40 Min inflows, and its backbone role in stablecoins like USDT and USDC boosts long-term appeal. Tokenization growth and Robin hood's tokenized stock rollout add further support.
✅Support and Resistance Levels
Support levels is now located at 2,400.00.
Now, the resistance level is located at 2,620.00.

BONK/USDT Reaches Critical Juncture-Will it Rise?Bonk bulls prevented an excessive price plunge and triggered a rebound from $0.00001152, surging by over 50%. Currently, the memecoin has risen above a pivotal resistance zone, and a daily close above the levels may validate the start of a bullish trend. However, the bears are extracting the profit, which may cause prices to drop slightly.
The conversion and base lines of the Ichimoku Cloud have undergone a bullish crossover, suggesting a short-term upswing, while the Lead span A also displays a bullish divergence, which hints towards a long-term potential upswing. However, the price remains below the cloud, which suggests the bears are still in play.
The Chainkin Mony Flow, or CMF, underwent a steep upswing and surged above 0, hinting towards the growing strength in the market. Besides, this is complemented with a rise in the price, pointing towards a bullish continuation
Therefore, the BONK price is required to rise above $0.00001971 before the weekly close, which may secure a strong bullish trend for the upcoming days
Targets
Resistance 1: $0.00001971
Resistance 2: $0.00002206
Resistance 3: $0.00002500
Support 1: $0.00001449
Support 2: $0.00001302
Support 3: $0.00001147

Bitcoin BTCUSD 4H Chart Analysis – Potential Breakout Incoming!Bitcoin is currently consolidating after a strong bullish recovery from the $96,000 zone, holding above $107,000. Price is forming a tight range — a breakout is imminent.
⚡ If BTC breaks above $107,500 with momentum, expect price to target $110,000 and $112,000 short-term.
⚡ If price rejects $107,500 and breaks below $106,500, we could see downside towards $104,000.
⚠️ Watch for volume confirmation before entries. No FOMO.
🚀 Stay ready — breakout traders, your setup is building.
#Bitcoin #BTCUSD #Crypto #TradingView #BTC #Breakout #CryptoTrading

Bitcoin Between Strength and Suspension Tactical Inflow Anomaly.⊣
⟁ BTC/USD – BINANCE - (CHART: 1H) – (Jul 03, 2025).
◇ Analysis Price: $109,716.55.
⊣
⨀ I. Temporal Axis – Strategic Interval – (1H):
▦ EMA 9 – ($109,510.76):
∴ Price remains above EMA9, sustaining the short-term bullish impulse;
∴ The EMA 9 is ascending with consistent candle-body support across recent sessions.
✴ Conclusion: Tactical momentum persists as long as price holds above EMA9 on closing basis.
⊢
▦ EMA 21 – ($109,064.37):
∴ EMA 21 serves as dynamic support, unbroken since the July 2nd surge;
∴ Distance between EMA9 and EMA21 confirms preserved trend integrity.
✴ Conclusion: No structural weakness observed; trend foundation remains intact under current volatility.
⊢
▦ Volume – (Visual estimation, TradingView):
∴ Volume surged during July 2 rally; subsequent bars show diminishing interest;
∴ Last high-volume candle aligns with recent local top attempt.
✴ Conclusion: Buyer aggression is fading. Volume must return for any continuation to be credible.
⊢
▦ Bollinger Bands (20, 2.0) – (Upper: $110,050.15 / Lower: $108,545.25):
∴ Price recently tapped upper band and pulled back slightly without breakdown;
∴ Bands are widening after expansion, indicating active volatility but no climax.
✴ Conclusion: System operates in elevated volatility regime, with breakout potential still valid if supported.
⊢
▦ Price Action (66, 6, 5) – (Visual structure, local range):
∴ Price formed a clean higher low and higher high sequence starting July 2nd, confirming bullish microstructure;
∴ Current candles show upper wick formation at ~$110,050, indicating rejection and absorption at resistance.
✴ Conclusion: Uptrend structure is valid but approaching short-term exhaustion. If support holds at $109,100–108,900, continuation remains viable.
⊢
▦ RSI + EMA9 – (RSI: 62.69 / EMA: 63.27):
∴ RSI dipped below its own EMA9, indicating weakening strength in recent hours;
∴ RSI remains above 60, preserving bullish territory but signaling caution.
✴ Conclusion: Early-stage exhaustion detected. Zone of hesitation active.
⊢
▦ ATR (14, RMA) – (447.69):
∴ Average volatility is still elevated relative to June baseline;
∴ Slight decline in ATR may suggest slowing force behind directional moves.
✴ Conclusion: Tactical volatility is active but not expanding. Suitable for traps or distribution setups.
⊢
🜎 Strategic Insight – Technical Oracle:
∴ The structural setup holds a bullish bias with dynamic supports (EMA9/EMA21) intact;
∴ Bollinger expansion and RSI positioning signal a zone of heightened interest, but the fading volume and early RSI crossover inject caution;
∴ This is a tactically suspended state where continuation is possible but dependent on incoming confirmation volume.
⊢
⟁ II. ARCANVM SIGNAL - (Bitcoin Inflow +5,000):
∴ Current Hourly Inflow: 20,788.10 BTC;
∴ Structural Threshold (30EMA): ~3,200 BTC;
∴ Trigger Threshold: ≥ 5,000 BTC.
✴ Conclusion and Interpretation: This event constitutes a critical liquidity anomaly under the Silent Sentinel Protocol. While it does not inherently dictate trend direction, its magnitude-6.5x above the structural average-configures:
∴ A probable institutional move for redistribution or liquidity unlocking;
∴ Elevated risk for short-term distortion events, particularly across the H1–H4 timeframes;
∴ An urgent need to monitor subsequent Netflow, to confirm whether real outflow pressure follows.
⊢
∫ III. On-Chain Intelligence – (Source: CryptoQuant):
▦ Exchange Netflow Total - (All Exchanges):
∴ Current: +555 Bitcoin net inflow;
∴ The ARCANVM inflow (+20,788 Bitcoin) has not been fully absorbed or reversed.
✴ Conclusion: Some liquidity remains inside exchanges. Potential for redistribution or silent preparation.
⊢
▦ Exchange Reserve - (All Exchanges):
∴ Continuously declining; current: ~2.44M Bitcoin;
∴ The inflow did not shift the macro trend of reserve depletion.
✴ Conclusion: Structural scarcity preserved. Inflow likely tactical and non-systemic.
⊢
▦ Futures Perpetual Funding Rate 7D-SMA - (All Exchanges):
∴ Holding near 0.01% – neutral bias;
∴ No evidence of directional crowding in perpetuals.
✴ Conclusion: Perpetual markets in tactical balance. Spot-driven price action dominates.
⊢
🜎 Strategic Insight – On-Chain Oracle:
∴ Despite the aggressive ARCANVM signal, the absence of structural reversals in reserves and neutral derivatives positioning confirms the move is non-structural.
∴ Markets remain in equilibrium.
∴ No emergent directional force-just silent posture-shifting.
⊢
⧈ Codicillus Silentii – Strategic Note:
∴ This is a state of tactical ambiguity. Breakout or failure depends on external triggers, as neither volume nor derivatives offer decisive guidance.
∴ The structure listens, not speaks.
⊢
▦ Tactical Range Caution:
∴ Resistance Watch Level: $110,050;
∴ Tactical Support: $109,100;
∴ Structural Alert Level: $108,400.
⊢
𓂀 Stoic-Structural Interpretation:
∴ Structurally Bullish – Tactically Suspended;
⊢
⧉
⚜️ Magister Arcanvm – Vox Primordialis!
𓂀 Wisdom begins in silence. Precision unfolds in strategy.
⧉
⊢

#DYM Dymension's Falling Wedge#DYM
The price is moving within a descending channel on the 1-hour frame, adhering well to it, and is on its way to breaking it strongly upwards and retesting it.
We have a bounce from the lower boundary of the descending channel. This support is at 0.2130.
We have a downtrend on the RSI indicator that is about to break and retest, supporting the upside.
There is a major support area in green at 0.2100, which represents a strong basis for the upside.
Don't forget a simple thing: ease and capital.
When you reach the first target, save some money and then change your stop-loss order to an entry order.
For inquiries, please leave a comment.
We have a trend to hold above the 100 Moving Average.
Entry price: 0.2220
First target: 0.2276
Second target: 0.2340
Third target: 0.2427
Don't forget a simple thing: ease and capital.
When you reach the first target, save some money and then change your stop-loss order to an entry order.
For inquiries, please leave a comment.
Thank you.

#PEOPLE Breakout in Action!#PEOPLE
The price is moving within a descending channel on the 1-hour frame, adhering well to it, and is poised to break it strongly upwards and retest it.
We have a bounce from the lower boundary of the descending channel. This support is at 0.01717.
We have a downtrend on the RSI indicator that is about to break and retest, supporting the upward move.
There is a key support area (in green) at 0.01650, which represents a strong basis for the upward move.
Don't forget one simple thing: ease and capital.
When you reach the first target, save some money and then change your stop-loss order to an entry order.
For inquiries, please leave a comment.
We have a trend of stability above the Moving Average 100.
Entry price: 0.01764
First target: 0.01807
Second target: 0.01855
Third target: 0.01916
Don't forget one simple thing: ease and capital.
When you reach the first target, save some money and then change your stop-loss order to an entry order.
For inquiries, please leave a comment.
Thank you.

#MYRO/USDT myro road map (Daily)#MYRO
The price is moving within a descending channel on the 1-hour frame, adhering well to it, and is poised to break it strongly upwards and retest it.
We have a bounce from the lower boundary of the descending channel. This support is at 0.01679.
We have a downtrend on the RSI indicator that is about to break and retest, supporting the upward move.
There is a key support area in green at 0.01592, which represents a strong basis for the upward move.
Don't forget one simple thing: ease and capital.
When you reach the first target, save some money and then change your stop-loss order to an entry order.
For inquiries, please leave a comment.
We have a trend of stability above the Moving Average 100.
Entry price: 0.01708
First target: 0.01712
Second target: 0.01830
Third target: 0.01945
Don't forget one simple thing: ease and capital.
When you reach the first target, save some money and then change your stop-loss order to an entry order.
For inquiries, please leave a comment.
Thank you.

#ONDO bounce from POINT OF CONTROL, targeting RANGE HIGHONDO found support at it's POC on the daily. if BTC.D lets it, it will want to head towards it. range high. (also VAH)
This isn't ondo specific, rather a case of BTC loses 108500 or also finds support there and invalidates its lower high pattern, to head towards ath.

#INJ/USDT#INJ
The price is moving within a descending channel on the 1-hour frame and is expected to break and continue upward.
We have a trend to stabilize above the 100 moving average once again.
We have a downtrend on the RSI indicator that supports the upward move with a breakout.
We have a support area at the lower limit of the channel at 0.04263, acting as strong support from which the price can rebound.
Entry price: 10.70
First target: 11.11
Second target: 11.43
Third target: 11.86

Bitcoin Robust Bullish Structure, Key Entries at 105k & 100k__________________________________________________________________________________
Technical Overview – Summary Points
__________________________________________________________________________________
Bullish momentum confirmed across all timeframes : Structure remains healthy, no behavioral anomalies detected.
Key supports: Main HTF pivot around $98,000–$100,000; first intermediate support zone at $105,000.
Major resistances: Critical area between $109,000 and $112,000, dense pivot and volume profile confluence.
Volumes: Normal to very high depending on TF, no speculative excess; gradual rise hints at possible expansion phase.
Risk On / Risk Off Indicator : Strong Buy from daily to 1H, shifting to neutral on shorter timeframes (30min–15min).
ISPD DIV/Mason's line: Predominantly neutral histogram, no overheat or capitulation detected.
Multi-timeframe behavior: Robust underlying structure, increased volatility but no massive selling stress.
__________________________________________________________________________________
Strategic Summary
__________________________________________________________________________________
Global bias: Bullish dominance as long as $98k–$100k holds.
Opportunity zones: Buy on pullback to $105k, swing confirm above $111k with volume/ISPD validation.
Risk / Invalidation: Stop loss below $98k; extra caution on macro/Fed events.
Macro catalysts: Fed/NFP-US (July 2–4), monitor behavior via ISPD DIV (blue to red).
Action plan: Structured and tactical long bias, “no trade” zone before major US releases, immediate stop on support break.
__________________________________________________________________________________
Multi-Timeframe Analysis
__________________________________________________________________________________
1D: Bullish momentum, no overheat. Pivot 98–100k = strategic fallback.
12H–6H: Signs remain bullish, no anomalies, intermediate supports at 105–107k.
4H–2H: Positive consolidation, rising volumes; possible accumulation on 105k dips.
1H–30min: Multiple resistances under 110–112k, very high volumes, maintain vigilance for sudden spikes.
15min: Extreme volatility, but no clear seller excess; watch for “trap” formation.
Risk On / Risk Off Indicator : Strong Buy on main timeframes, shifting to neutral/buy on 30min/15min (breather zone).
ISPD DIV/Mason's line: No buyer capitulation, overall neutral histogram.
Summary: Bullish cross-timeframe alignment, only macro events may trigger a break.
Key economic calendar
- 07/02: Powell speech – Potential added risk-on boost.
- 07/02: US tariff updates – Possible volatility.
- 07/04: NFP, ISM... High expected volatility.
Action : Heightened caution pre-announcements, validate through volume/ISPD.
On-chain: Dominant HODLing, no dumping, stable institutional volume.
Macro: Fed, inflation, geopolitics under watch.
Tactical: Spot any warning via ISPD or volume cluster.
__________________________________________________________________________________
Conclusion & risk management
__________________________________________________________________________________
Strong bullish bias as long as $98k–$100k holds .
Optimal buy on $105k/$100k dips, swing confirm on $111k break .
Outside of US events: strict tactical discipline required .
Absolute invalidation zone: break below $98k (HTF + STH cost-basis) .
Remain vigilant for ISPD red + volume spike / macro headlines .
__________________________________________________________________________________
#INIT/USDT Potential Bullish Reversal After Down Channel Break #INIT
The price is moving within a descending channel on the 1-hour frame and is expected to break and continue upward.
We have a trend to stabilize above the 100 moving average once again.
We have a downtrend on the RSI indicator that supports the upward break.
We have a support area at the lower limit of the channel at 0.3800, acting as strong support from which the price can rebound.
Entry price: 0.4664
First target: 0.5115
Second target: 0.5579
Third target: 0.6248
To manage risk, don't forget stop loss and capital management.
When you reach the first target, save some profits and then change the stop order to an entry order.
For inquiries, please comment.
Thank you.

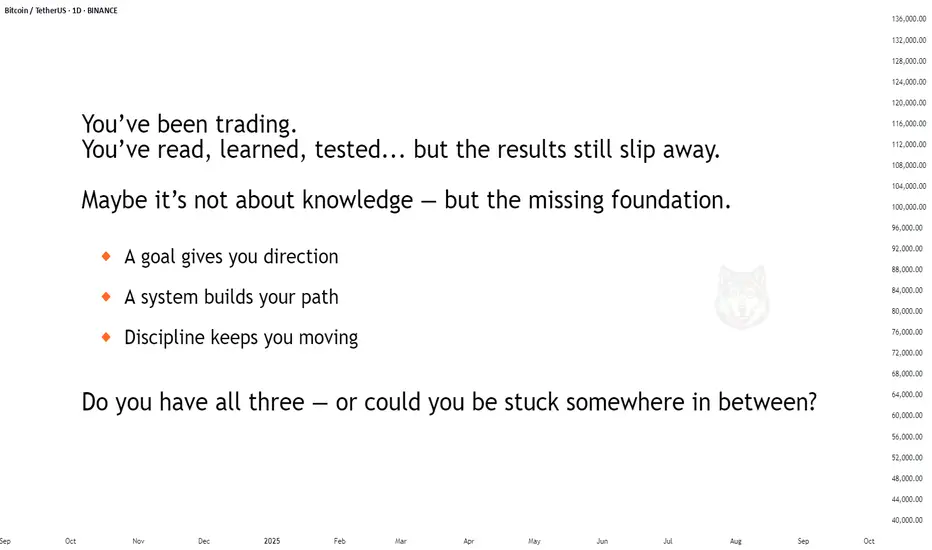
You trade. You learn. You test. But results still slip. Why? Sometimes you feel like you know it all. You've tried dozens of strategies. Studied with the best. But in your head — there’s no clarity, in your trades — chaos, and in the end — you’re stuck in the same place. I’ve been there too. If this sounds familiar — keep reading.
Every day, thousands of traders enter the market and do everything "by the book": they open their terminal, draw levels, learn from the pros, read the analysis. Yet years later, they’re still in the same spot. Their results are random, unstable, or negative. Why?
🔹 Not because you didn’t study enough.
🔹 Not because you can’t read a chart.
💡 Most likely, your system isn’t fully built — or your goal is still unclear.
A goal is not a wish. "I want to make money" is not a goal. A real goal sounds like: to consistently earn $1,000 a month, spending 3 hours a day on trading. Or: to live off trading income and leave my job.
Different goals require different systems: daily routines, trade evaluation criteria, analysis frequency, and risk approaches.
Here are some examples of goals and the systems they require:
Goal: Consistent side income $1,000 a month with 3 hours of trading a day → You need a system with a clear schedule, ready-made analysis templates, minimal manual effort, asset/time priorities, clear trade filters, trade logging, and weekly/monthly feedback loops (what works, what doesn’t).
Goal: Passive income through investments (e.g. 15% annual return on capital) → You need a system that includes regular fundamental analysis, long-term trend evaluation, clear rules for portfolio formation and rebalancing, risk limits per asset, profit/loss realization strategies, trade logging, and quarterly feedback reviews.
Goal: Full-time trading income, consistently earning $10,000 per month → You need a system with strict risk control, a daily trading rhythm, emotional stability support, trade tracking, and daily/weekly feedback (what’s working, what’s not).
What happens without a goal and system?
The trader opens a chart and starts "looking for an opportunity." Today it’s scalping, tomorrow swing, the next day — "I’m just observing."
📉 They don’t know what to focus on.
📉 They lose concentration.
📉 They jump into trades because "something must be done."
📉 They burn out. Because there’s no sense of progress.
Without a goal, you can’t build the system you need. A goal sets the direction and evaluation criteria.
Without a system, you can’t reach the goal: you might have knowledge, actions, and effort — but they don’t add up to results. Just noise, fatigue, and the feeling of being out of sync with the market.
A system is what connects your goal and actions. It gives you stability, filters out distractions, keeps you focused, and reduces impulsive behavior.
If this feels familiar — it’s a signal. Your system and goal need an upgrade. Many start with a random mix of actions hoping for results. Few take the step toward clarifying their goal and building their system. You can be one of them — if you have a map and a direction.
Everything starts with a clear personal goal — not a generic one, but truly yours.
You can use 3 practices to help you:
Goal — what you truly want from trading, specifically in numbers and timelines.
Sub-goals — how to break the path into clear steps based on your resources.
Hypothesis — what exactly you’re testing right now to stay focused.
Each of these is a practical step that brings clarity and direction.
📌 Define your goal — and keep it.
It’s your starting point. It marks the transition from reactive trader to conscious professional.
See you in Part Two — where we’ll build the system that brings you to that goal.
Let your chosen goal inspire and support you on the journey.
Value every step and your own effort.
Take care — and trust your path.
SHIB AnalysisAlthough price has been recovering for the last couple of weeks, I still don´t see clear reversal indications.
We have yet to see a higher high / higher low, or bullish RSI divergence. These are key to consider a reversal.
The green resistance zone is a key level to be broken for a bullish bias.
Meanwhile, I´ll still be looking for downside reversals in smaller timeframes targeting the June low at 0...1004

ZETAUSDT.PWaiting for the price to come at our level and only enter if we some bullish momentum.
The setup has been marked.
DYOR

Btcudt techinical analysis.Btcusdt techinical analysis next move posibale at h1 time frame.not finchinal advice.

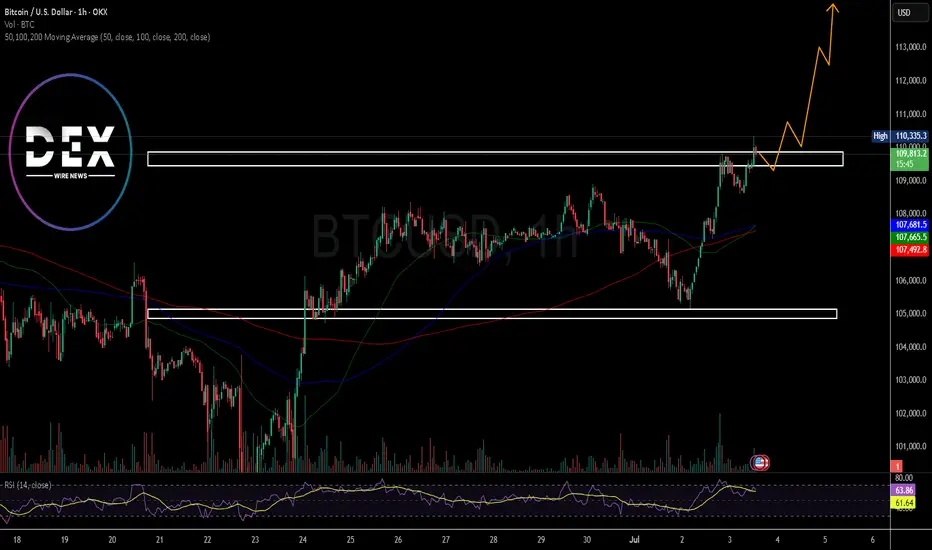
Breaking: Bitcoin Just Broke the $110k Resistant Next Top $115kThe price of the first crypto currency ever created saw a noteworthy uptick to reclaim the $110k price point however, the move was short-lived as the asset retraced to $109k mark but present price chart depicts a move to the $115k resistant point in the short term.
With the Relative strength index (RSI) at 63, Bitcoin might be inches away from claiming the $115k pivot amidst build up momentum and institutional adoption. further bullish metrics include the asset trading above the 50, 100 and 200-day Moving Averages (MA) respectfully.
Btcusdt techinical analysis.Btcusdt techinical analysis target successfully achived at h1 time frame.
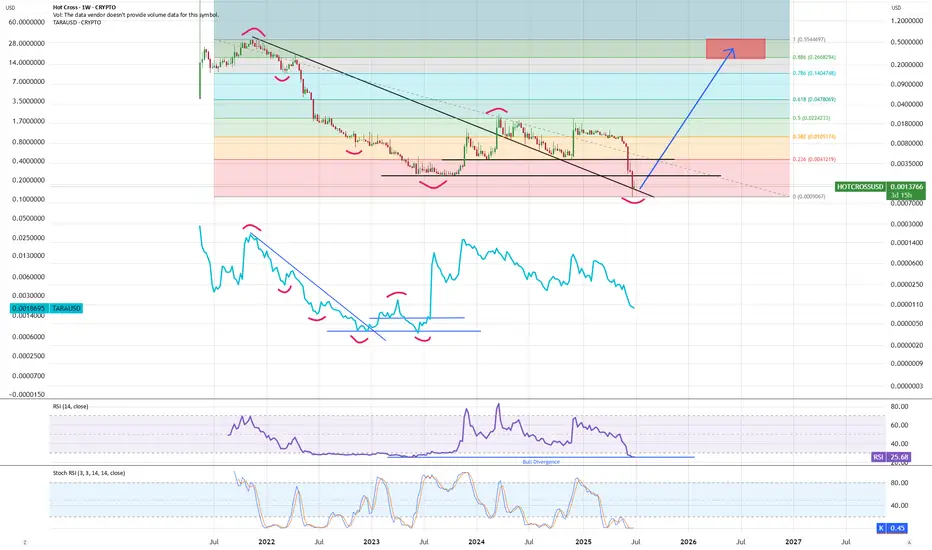
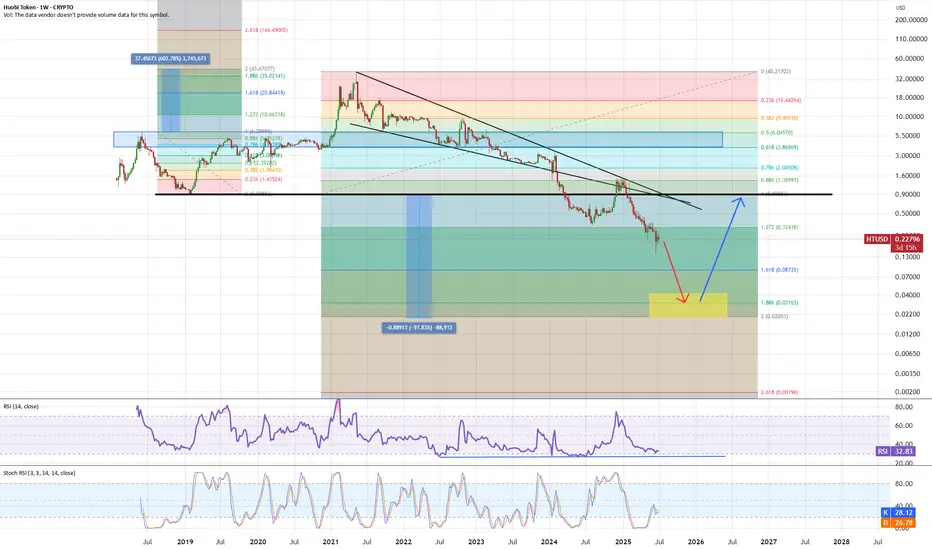
HT - more dump to come?HT lost support range and lacked power to climb back above it thus opening path to lower targets. In 2019 we did reverse move which lead to break up to 1:1 target, this time we have 1:1 target to downside so I expect one more dump to come (note we are already developing bullish divergence). Once we get a bounce I expect test of lost support at 0.90$.
XRP Consolidates as Volatility Drops — A Breakout LoomsXRP is showing signs of tightening price action as its Average True Range (ATR) continues to decline, now sitting at 0.107. This downtrend in ATR reflects waning volatility and increasing indecision among market participants.
The ATR measures price movement intensity. A falling ATR like this signals consolidation — price is moving less and volatility is drying up.
If bearish pressure builds, XRP might fall to $2.22. On the other hand, if demand soars, the token's price could reach $2.35.

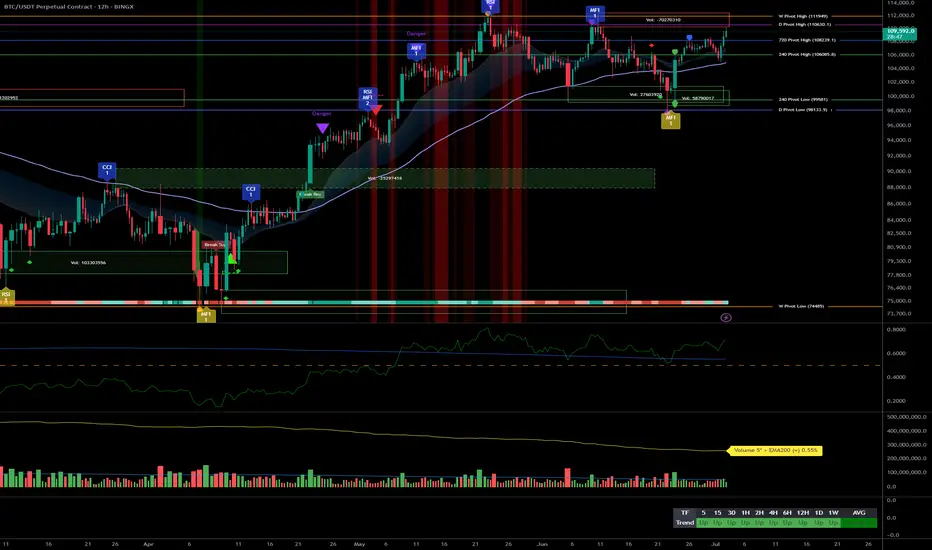
July 1 Bitcoin Bybit chart analysis
Hello
This is Bitcoin Guide.
If you "follow"
You can receive real-time movement paths and comment notifications on major sections.
If my analysis was helpful,
Please click the booster button at the bottom.
Here is the Bitcoin 30-minute chart.
Shortly later at 10:30 PM and 11:00 PM, there will be a NASDAQ index announcement.
On the left, with a purple finger,
I connected the long position entry point of $106,775.9, which I entered yesterday, to today's strategy.
Since the rebound was not strong yesterday,
the 12-hour chart -> daily chart MACD dead cross is currently under pressure.
Depending on the situation, it can drop strongly to the 3rd section at the bottom,
and since there may be some people who are maintaining long positions yesterday,
I will explain in detail the operating method such as the loss cut price,
so please check it carefully.
*When the blue finger moves,
Bidirectional neutral
Short->Long switching strategy
1. 107,300.3 dollars short position entry section / stop loss price when orange resistance line is broken
2. 106,222.2 dollars long position switching / stop loss price when section 2 is touched
3. Top section long position 1st target -> Good 2nd target
It is important until 9 o'clock when the 12-hour candle is created.
After 9 o'clock, the blue finger 106,222.2 dollars at the bottom
Becomes the main support line
If it comes down from the current position, section 2
The main support line is divided.
In terms of the pattern, it is section 6+12.
If section 2 is touched right away,
There is a high possibility of a strong drop today,
So you should be careful.
- Those who are maintaining a long position
If you touch the 2nd section before 9 PM without touching the short position entry point at the top
You should operate at a loss cut price.
I think it would be good to adjust it according to leverage.
If it falls after touching the 1st section at the top
It becomes a vertical decline condition.
From the bottom, from the 3rd
Maximum Bollinger Band daily chart support line section
Please note that it can be pushed up to 100,685.5 dollars.
I have never changed my perspective suddenly or irresponsibly after leaving an analysis article.
I did my best until the end today.
Please use my analysis article so far only for reference and use
I hope you operate safely with principle trading and loss cut prices.
Thank you.

HOTCROSS - bounce now or never....HOTCROSS has same pattern as TARA before it reversed. It is also oversold with bullish divergence. It's now or never moment - we must bounce back to fibb 0.236 range from here to keep following TARA algo. Do that and we open path to test pivot at 0.50$ range.