Crypto market

$purr long ideaCSE:PURR 🔥 Daily & Weekly Frame, everything else is noise!
Hyperliquid.
Check out my #PURRUSD

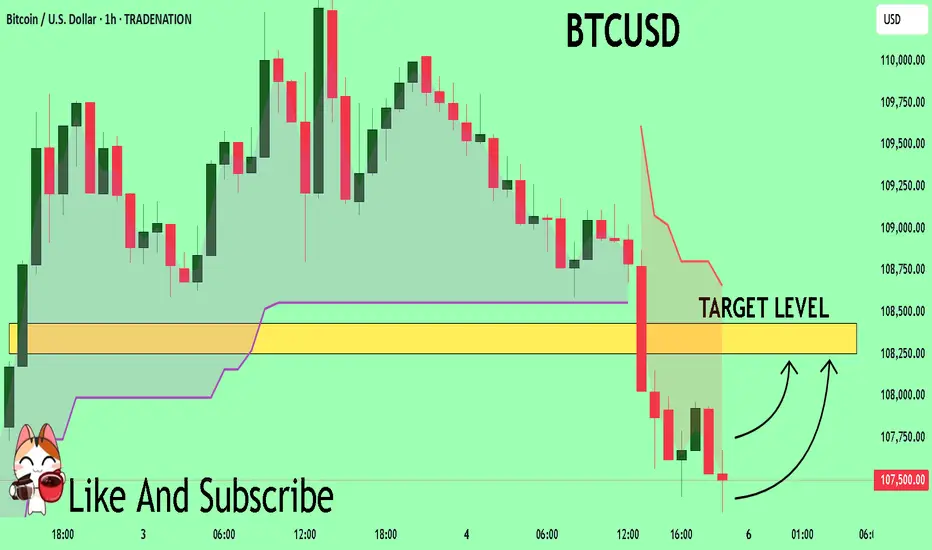
BTCUSD What Next? BUY!
My dear subscribers,
My technical analysis for BTCUSD is below:
The price is coiling around a solid key level - 10750
Bias - Bullish
Technical Indicators: Pivot Points Low anticipates a potential price reversal.
Super trend shows a clear buy, giving a perfect indicators' convergence.
Goal - 10825
About Used Indicators:
By the very nature of the supertrend indicator, it offers firm support and resistance levels for traders to enter and exit trades. Additionally, it also provides signals for setting stop losses
Disclosure: I am part of Trade Nation's Influencer program and receive a monthly fee for using their TradingView charts in my analysis.
———————————
WISH YOU ALL LUCK
CHESS/USDT Re-accumulatingCHESS has been accumulating for the past 66 days in a tight range between $0.070 – $0.085, forming a solid base.
Price is now coiling near the top of the range, suggesting a potential breakout is imminent. A confirmed breakout above $0.085 could trigger a parabolic move as liquidity and momentum kick in.
Target Zones
• TP1: $0.095
• TP2: $0.101
• TP3: $0.125
🔻 Stop Loss: Below $0.069

My Long term BTC-USDTP PLANmy long term plan or the rest of the year leading into April im working on.. still needs a little more confirmation but today pull was very significant indeed

HolderStat┆HYPEUSD forming the triangleKUCOIN:HYPEUSDT has entered a narrowing triangle formation with a bullish trajectory, forming higher lows from the 33 USDT base. Price is nearing resistance around 40 USDT, and if breached, the pattern projects continuation toward the 43.5 USDT level.

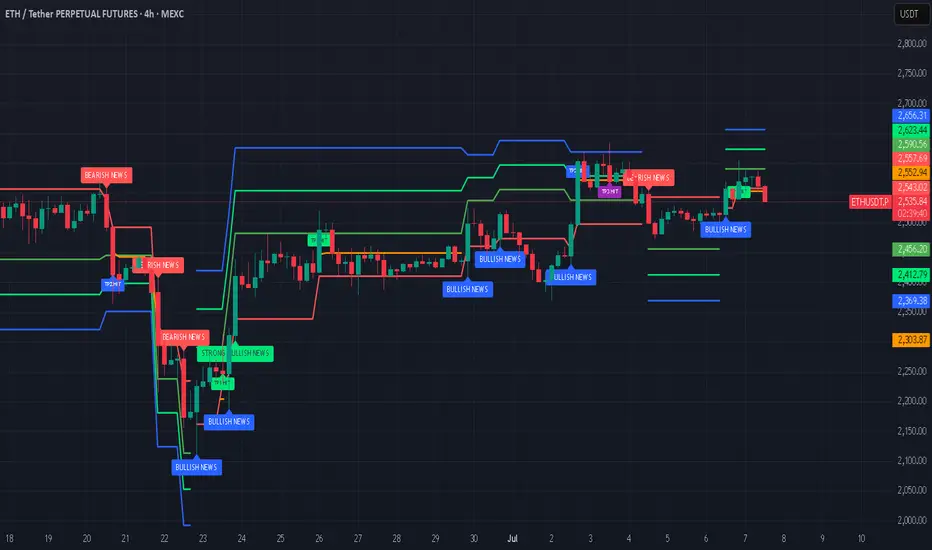
ETH - Should I go long?Ethereum (ETH) is currently positioned at a critical juncture, with multiple technical and fundamental indicators suggesting the potential for a significant move ahead.
Current Price and Momentum: As of the latest real-time data, ETH is trading at $2,549.97, having recently started a fresh increase above the $2,520 zone. The price is above both the $2,550 level and the 100-hourly Simple Moving Average, indicating short-term bullish momentum.
Key Resistance Levels: The immediate resistance is near $2,600, followed by $2,620 and a major barrier at $2,650. A decisive break above $2,650 could open the path toward $2,720 and potentially $2,800 in the near term.
Support Levels: On the downside, $2,520 is a key support zone. A sustained drop below this could trigger declines toward $2,500 or even $2,420, but as long as ETH holds above $2,520, the bullish structure remains intact.
On-Chain and Institutional Signals: Long-term holders have been accumulating ETH, and institutional inflows have surged, with over $750 million invested recently. This accumulation, alongside strong ETF inflows and rising staking activity, points to growing confidence and could act as a catalyst for a major price move.
Technical Patterns: ETH is consolidating above critical moving averages and within bullish chart formations (such as ascending triangles and coiling structures). These patterns often precede significant breakouts, especially when accompanied by increasing trading volumes and improving momentum indicators.
Market Sentiment: While short-term indicators show some cooling, the broader trend remains bullish. Analysts note that if ETH can break above the current resistance cluster, it could ignite a new wave of bullish momentum and set the stage for a broader breakout.
In summary: Ethereum is at a pivotal resistance zone. If it can break and hold above $2,600–$2,650, analysts expect a strong move higher, with targets at $2,800. Institutional inflows, strong on-chain accumulation, and bullish technical setups all support the case for a significant upside move in the coming weeks or months, provided key support levels are maintained.
Note that a possible correction of Bitcoin (which essentially will result in a drop of the entire crypto market) is possible in the next weeks.
#crypto #eth #btc #bitcoin #ethereum #analysis #trading #portfolio #long #algorithm #buysellsignals #tradingsignals #bullrun
LTC- Litecoin Entered Short Reading the chart this is the story:
1. We had Significant Fib location where we found sellers visible at the top- the reaction after the up wave a large down wave.
2. Placed AVWAP at the beginning of the up-wave and waited for the price to cross downwards and the pull back so that AVWAP will act as resistance.
3. Pull Back to AVWAP came after some time
4. Price never breaks AVWAP upwards and it has hard time to move up - Abnormal SI of 4.9
5. Finally waited for a Plutus short signal and in this case it was a PRS.
Stop above AVWAP center line target at least 1:1.5
Enjoy!

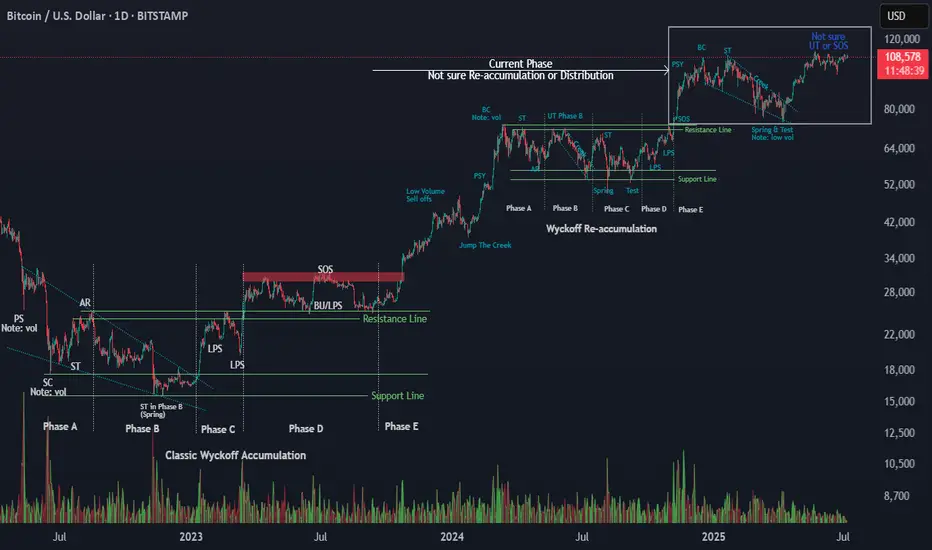
Wyckoff Logic – Test PhaseI won’t say much — the chart speaks for itself.
Based on my ongoing study of Wyckoff methodology, it appears that Bitcoin is currently in the Test phase within a re-accumulation structure. This suggests the Mark-Up phase is not yet complete, and we may still have room for price expansion before the next major distribution.
This is not a prediction, but a reference for structural context using classical Wyckoff logic.
As always, price confirmation and volume behavior will be the key to validate the next move.
Observations:
Strong support zone holding after Spring/Test
Price respecting higher lows
Volume profile supports continuation
Feel free to share your perspective below 👇
#Wyckoff #Bitcoin #BTC #Reaccumulation #MarketStructure #PriceAction #TradingView #CryptoTA
Bitcoin is ready to fill the biggest gap and the largest liquidiBitcoin is ready to fill the big gap and the biggest liquidity, the range of 25,000 and 19,000 can be a good time to buy Bitcoin.
🤪🤪🤪

BTC/USDT Technical Analysis, 2025-07-07 11:30 UTC📊 BTC/USDT Technical Analysis, 2025-07-07 11:30 UTC
🕒 Binance Spot
📆 July 7, 2025 | 11:30 GMT Candle Observations
───────────────
💡 Price: 108712.97 USDT
📉 EMA200 (Dynamic): 108938.31
🟩 Support Watch: 107512.97
🟦 Resistance Target: 109782.97
───────────────
🔍 We're observing price action developing below EMA200, with a recent Piercing Line formation at a noted dip zone. This setup may suggest buyers are attempting to reclaim short-term control.
⚠️ Key tactical support remains near 107512.97, where historical reaction zones and liquidity zones intersect.
📈 A move toward 109782.97 is being monitored as a potential resistance test, in line with local OBV divergence and recovering bid pressure.
📌 Market Microstructure Notes:
• Order Book Imbalance leaning toward bids (+0.45)
• OBV Trend: +10.17% vs 5-period MA
• Thunder Engine Volume Acceleration: ⚡ Observed
• Whale Ask Cluster: ~640k USDT near top of range
📉 No guarantees of breakout or reversal watching how price reacts around key levels. Maintain cautious positioning near support/resistance pivots.

Bitcoin: The night before the plunge? →104,000?
Bitcoin fell under pressure from highs, with short-term bearishness but strong long-term fundamental support.
1. Market fundamentals
Institutional holdings continue to grow
BlackRock Bitcoin ETF (IBIT) exceeds $72 billion in size, dominating the market
MicroStrategy holdings increased to 597,000 BTC (about $63 billion), continuing to increase holdings on dips
Global Bitcoin ETF Net inflow of $4 billion in June shows strong demand for institutional allocation
Policy and regulatory progress
The U.S. Treasury Department plans to include Bitcoin in the "strategic reserve assets" to enhance its legal status
The SEC will make a ruling on spot ETF option transactions on July 15, which may bring new liquidity
The Trump administration plans to impose a 60% tariff on China, and market risk aversion may heat up again
On-chain data changes
A 14-year dormant address recently transferred 80,009 BTC (about $8.69 billion), triggering concerns about selling
The lightning network capacity exceeded 5,000 BTC, and Tether (USDT) completed the lightning network integration
II. Technical depth Degree analysis
(1) Medium-term trend structure (4-hour level)
Rising channel break: After the price peaked at $112,000, it continued to fall below the rising trend line support
Range oscillation formation: Currently, $98,000-110,700 constitutes the main trading range, and the middle track support is $104,000
Volume change: The recent decline is accompanied by an increase in trading volume, indicating that the short-term momentum is increasing
(2) Short-term trading signals (1-hour level)
Double top pattern confirmation: $110,700 was tested twice without breaking, forming a typical reversal structure
Moving average system short arrangement: EMA5/10/30 formed a death cross, suppressing price rebound
Key support level:
▶ First support: $106,500 (Fibonacci 38.2%)
▶ Second support: $104,000 (psychological barrier + previous low)
▶ Strong support: $98,000 (lower track of the range)
III. Trading strategy suggestions
1. Aggressive short position layout
Entry range: $109,000-109,500
Stop loss setting: $111,000 (above the previous high)
Target: $106,500→$104,000
Technical basis: downward trend line suppression + RSI top divergence
2. Steady retracement of short positions
Entry signal: 108,000-108,500 rebound encountered resistance
Stop loss setting: $110,000 integer barrier
Target: $104,000 (break down to see 98,000)
3. Long defense area
Key observation position: 104,000 US dollars (if there is a large volume to stop the decline, you can try long with a light position)
Breakthrough signal: Stabilizing 110,700 US dollars will restart the upward trend
IV. Multi-dimensional market outlook
Short-term (1-2 weeks):
Affected by technical suppression and whale movements, it is expected to maintain 104,000-110,700 range fluctuations
Focus on the effectiveness of 106,500 support, breaking down will accelerate the test of the lower track of the range
Medium-term (Q3 quarter):
Institutional continued holdings + Fed rate cut expectations constitute long-term support
If it breaks through 112,000 US dollars, it will open up to 120,000-125,000 upside space
Risk warning:
The SEC option trading ruling on July 15 may cause violent fluctuations
Global macroeconomic data (especially CPI) will affect market risk preferences
V. Professional trading suggestions
▶ Currently, the "rebound short" strategy is preferred, and stop loss is strictly set
▶ Long-term investors can arrange in batches in the range of 98000-104000
▶ Pay close attention to:
Daily ETF fund flows, changes in on-chain whale addresses (glassnode alert system), US CPI data (released on July 12)
Conclusion: Although the short-term technical side is bearish, the long-term fundamental support of Bitcoin remains solid. It is recommended that traders seize the opportunity of range fluctuations, operate flexibly at key support/resistance levels, and wait for new trend signals to be confirmed.

July 7 Bitcoin Bybit chart analysisHello
This is Bitcoin Guide.
If you "follow"
You can receive real-time movement paths and comment notifications on major sections.
If my analysis was helpful,
Please click the booster button at the bottom.
Here is the Bitcoin 30-minute chart.
There is no separate Nasdaq indicator announcement today.
I think the Nasdaq lower gap section retracement will be the focus.
Recently, sideways movement or adjustments have been coming out before the trend,
So I proceeded safely in preparation for variables.
*When the blue finger moves
Bidirectional neutral
Short->long switching or 2nd section long waiting strategy
1. $109,380 short position entry section / cut-off price when orange resistance line is broken
2. $108,997.8 long position switching / cut-off price when purple support line is broken
3. $109,610.9 long position 1st target -> Top 2nd target -> Good 3rd target
It seems important whether the purple support line is broken from the current position. If the first section at the top touches 108,997.8 dollars and comes down,
it may become a vertical decline section.
If it comes down right away, it is a long-waiting strategy in the final second section,
and if it deviates from the bottom section today
(6+12 pattern)
because it is a full candle when the gap section is touched,
it may fall to 107,484 dollars indicated at the very bottom.
I have important work to do tomorrow,
so I will take a day off and come back on Wednesday.
Please use my analysis so far for reference and
I hope you operate safely with principle trading and stop loss prices.
Thank you.

How to Trade Smart Money Concepts (SMC)\ How to Trade Smart Money Concepts (SMC)\
\ This article explores the foundation, key tools, and practical insights of Smart Money Concepts — and why it’s worth your attention.\
In today's fast-changing financial landscape, Smart Money Concepts (SMC) has become a popular strategy among modern traders. But what is SMC exactly, and how can it improve your trading decisions? This article breaks it down in a simple, professional way for traders at all levels.
---
\ What Are Smart Money Concepts?\
SMC is a trading approach based on the belief that large institutions ("smart money") like banks and hedge funds control most of the market's movements. These institutions often move the market in ways that confuse or trap retail traders. The goal of SMC is to understand and follow the footsteps of these big players.
Instead of relying on simple patterns or indicators, SMC focuses on:
\ - Market structure\
\ - Supply and demand zones\
\ - Liquidity pools\
By aligning your trades with the behavior of smart money, you can position yourself more strategically in the market.
---
\ Key SMC Concepts Explained\
\ Order Blocks\
Order blocks are zones on the chart where large institutions have placed significant buy or sell orders. These zones often lead to strong price reactions and act as hidden support or resistance levels. Order blocks are considered more precise than traditional supply and demand areas.
Example: ()
\ Fair Value Gap (FVG)\
A Fair Value Gap occurs when price moves sharply in one direction, leaving a gap or imbalance in the price action. These areas often get filled later and can act as magnets for price.
In a bearish move, the FVG is the gap between the low of the previous candle and the high of the next one. In a bullish move, it's the reverse.
Example: ()
\ Timeframe Consideration\
If you can’t monitor charts during the day, avoid relying on 5–30 minute setups. Consider 4H or daily timeframes for clearer signals and more manageable trading decisions.
\ Liquidity\
Liquidity refers to price zones where lots of pending orders exist. These are usually at obvious highs, lows, or trendlines. Smart money often targets these areas to trigger stop-losses and generate movement.
One common tool to identify liquidity is a "pivot point," which is a candle with a lower low or higher high than its neighbors.
Example: ()
\ Break of Structure (BOS)\
BOS occurs when price breaks above or below a previous high or low, signaling a possible trend continuation.
Example: ()
\ Change of Character (ChoCH)\
ChoCH happens when the market changes direction. For example, if price breaks a higher low in an uptrend, it may signal a reversal.
Example: ()
Combined with BOS: ()
---
\ How SMC Compares to Wyckoff\
The idea of "smart money" isn't new. Richard D. Wyckoff, a pioneer in technical analysis, laid the foundation for understanding market cycles driven by institutions. His price cycle theory includes four phases:
\ 1. Accumulation\
Smart money buys while the public is unaware.
\ 2. Markup\
Price rises as smart money pushes the market.
\ 3. Distribution\
Smart money sells into public buying.
\ 4. Markdown\
Price falls as the cycle completes.
SMC borrows from this logic but focuses more on structure and liquidity zones. Still, the core idea is the same: understand what big players are doing, and follow them.
\ For deeper insights into Wyckoff, explore additional resources focused on accumulation/distribution cycles.\
---
\ Summary\
Smart Money Concepts give traders a deeper look into market mechanics. By focusing on order blocks, fair value gaps, liquidity, and structure breaks, SMC helps identify high-probability trade setups based on institutional behavior.
It may seem complex at first, but once you understand the basics, SMC can become a powerful tool in your trading strategy. Whether you’re new or experienced, aligning with smart money can improve your edge in the market.

IDEXUSDT in a downtrendhi traders.
Today, Binance extended the Monitoring tag to include IDEX.
This token's price has been in a major downtrend for a very long time.
I don't expect it to change with the bad news that came out today for IDEX.
The bounce will be an opportunity to enter a short position.
See the setup on the chart.
Good luck

BAKE ready to restart the uptrendhi traders,
Let's have a look at BAKEUSDT on the monthly time frame.
To be honest, there are not many altcoins that look as good as BAKE on the monthly.
Multiple months of the reaccumulation.
Support holds strong.
I can't see it to fail.
First target: 0,90
Second target: 1,62
BAKE is a low market-cap altcoin so I won't be surprised if the pump is fast and after that we will get a deep pullback again.
Good luck

Continuation Idea for COQJust a continuation idea for COQUSDT Short position.
Since my rsi m5 and m15 is around 45 area and stochastic and rsi are printing bear signals. I decided to have a tp2 around 0.004428. Our macd on m30 is already in the sellzone and were just waiting for momentum in h4 for macd curling down

INIT | Bullish DivergenceThe INIT/USDT daily chart shows a compelling bullish divergence setup that could signal a potential reversal from the current downtrend.
Bullish Divergence Pattern:
Price has made lower lows while RSI shows higher lows
This divergence often precedes trend reversals
Price is currently testing the descending trendline support
Technical Setup:
Current price around $0.41 near key support level
RSI approaching oversold territory but showing resilience
The projected path (red arrow) suggests a potential move toward the resistance zones
Price Targets:
First resistance: $0.70-0.75 zone (pink box)
Second resistance: $1.12-1.21 zone (upper pink box)
Risk Considerations:
A break below current support could invalidate the divergence
Volume confirmation needed for sustainable reversal
Crypto markets remain volatile with external factors affecting sentiment

Bitcoin Bullish Continuation in Progress🔵 Bitcoin Weekly structure confirms higher highs & higher lows, reinforcing the bullish trend.
📈 As long as CRYPTO:BTCUSD holds above key support near $106K, the next leg could target $127K–$143K within the coming 2 months.

Ethereum (ETH): Still Cheap Don't You Think? | $2800 NextEthereum is still cheap compared to what is about to happen. Now saying "about to happen" is a little broad, saying as it might be weeks or months until we see the full potential of ETH but we are bullish for sure.
Bitcoin had its moment of money inflow and now money has to flow somewhere else, which should be ETH. This is the next stage for the bull market and that's what we are looking for.
Targeting currently $2800, but overall we want to see at least $4000.
Swallow Academy

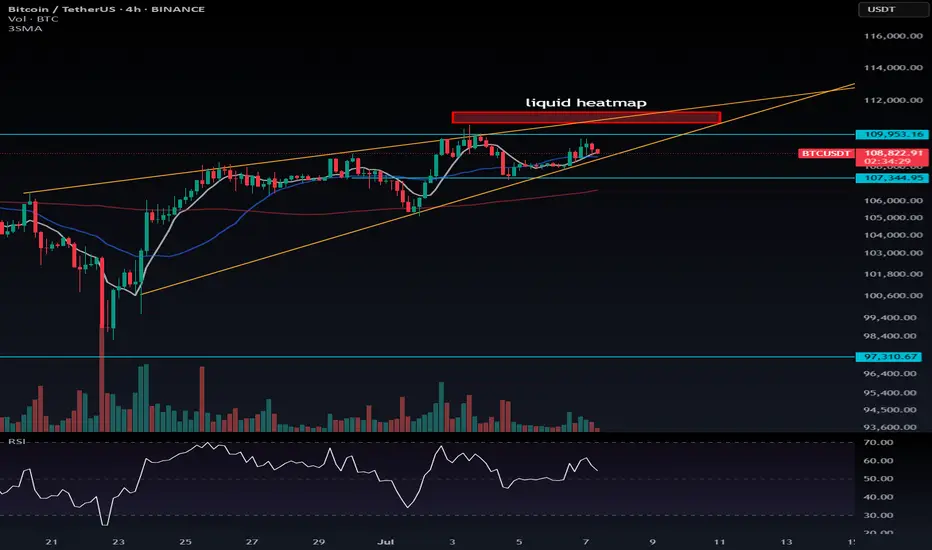
BTC Forming Higher Highs & Lows | Watch the Wedge Breakout📈 BTC Forming Higher Highs & Lows | Watch the Wedge Breakout 📉
In the uptrend that started around $100K, Bitcoin is forming higher highs and higher lows on the 4H timeframe, which is in line with Dow Theory. Based on the orange lines I’ve drawn, it seems we are moving inside a rising wedge pattern.
🟠 Key Observations:
Breakout from either side of the wedge can trigger a trade, but I personally won’t enter based solely on the wedge.
If BTC breaks upwards, I’ll hold my existing long, not looking to short — because the mid and long-term trend is still bullish.
📌 New Trigger Level: The previously important level of $110,246.8 is now less relevant for me. The market has already rejected from $109,953.16, so that’s my new key level.
👉 I’ve placed a stop-buy order at $109,953.16 based on the 1H chart.
💣 Short Liquidation Zone (Updated):
Now ranges between $110,640 to $111,320
If you're looking to trade momentum:
RSI above 70 on 4H, or
Above 76.23 on 1H = potential trigger for long entries
👉 I'm planning to open a long position above $109,953.16 using a stop-buy order, with the help of the order book in the exchange.
⚠️ Currently, I don’t have a high-confidence stop-loss level — I’ll update as I see clearer price action.
🧠 Pro Tip:
Do everything you can to catch a BTC long position. If you understand risk management and position sizing, don’t be afraid of stop-losses — they’re part of the game.
If you're unsure what proper risk/money management is, go learn it now, or you will definitely get liquidated someday.
MNT | At SupportMNTUSDT has reached a critical support zone around $0.5742, presenting a potential buying opportunity. The price is testing the green support area that has held multiple times historically, suggesting this level remains significant for buyers.
Key Technical Observations:
Price currently testing major support zone (green box)
RSI showing oversold conditions around 40, indicating potential for bounce
Previous support levels in this range have generated strong reversals
Downtrend from recent highs appears to be losing momentum
Potential Trade Setup:
Entry: Current levels around $0.5742 support zone
Target 1: $0.7000 (previous resistance area)
Target 2: $0.8500 (higher resistance zone)
Stop Loss: Below $0.5000 to manage downside risk
Risk Factors:
Broader market conditions could pressure the support further
Break below $0.5000 would invalidate the bullish scenario
Volume confirmation needed for sustainable bounce
The risk-to-reward ratio appears favorable at current levels, but traders should monitor for volume confirmation and overall market sentiment.
