XRP Consolidates as Volatility Drops — A Breakout LoomsXRP is showing signs of tightening price action as its Average True Range (ATR) continues to decline, now sitting at 0.107. This downtrend in ATR reflects waning volatility and increasing indecision among market participants.
The ATR measures price movement intensity. A falling ATR like this signals consolidation — price is moving less and volatility is drying up.
If bearish pressure builds, XRP might fall to $2.22. On the other hand, if demand soars, the token's price could reach $2.35.
Crypto market

110k soon , best time to buy altcoins Btc still didnt complete main wave 5 , btc for last time touch 98k but this time price will attack 110k and then we will have NATH.

July 1 Bitcoin Bybit chart analysis
Hello
This is Bitcoin Guide.
If you "follow"
You can receive real-time movement paths and comment notifications on major sections.
If my analysis was helpful,
Please click the booster button at the bottom.
Here is the Bitcoin 30-minute chart.
Shortly later at 10:30 PM and 11:00 PM, there will be a NASDAQ index announcement.
On the left, with a purple finger,
I connected the long position entry point of $106,775.9, which I entered yesterday, to today's strategy.
Since the rebound was not strong yesterday,
the 12-hour chart -> daily chart MACD dead cross is currently under pressure.
Depending on the situation, it can drop strongly to the 3rd section at the bottom,
and since there may be some people who are maintaining long positions yesterday,
I will explain in detail the operating method such as the loss cut price,
so please check it carefully.
*When the blue finger moves,
Bidirectional neutral
Short->Long switching strategy
1. 107,300.3 dollars short position entry section / stop loss price when orange resistance line is broken
2. 106,222.2 dollars long position switching / stop loss price when section 2 is touched
3. Top section long position 1st target -> Good 2nd target
It is important until 9 o'clock when the 12-hour candle is created.
After 9 o'clock, the blue finger 106,222.2 dollars at the bottom
Becomes the main support line
If it comes down from the current position, section 2
The main support line is divided.
In terms of the pattern, it is section 6+12.
If section 2 is touched right away,
There is a high possibility of a strong drop today,
So you should be careful.
- Those who are maintaining a long position
If you touch the 2nd section before 9 PM without touching the short position entry point at the top
You should operate at a loss cut price.
I think it would be good to adjust it according to leverage.
If it falls after touching the 1st section at the top
It becomes a vertical decline condition.
From the bottom, from the 3rd
Maximum Bollinger Band daily chart support line section
Please note that it can be pushed up to 100,685.5 dollars.
I have never changed my perspective suddenly or irresponsibly after leaving an analysis article.
I did my best until the end today.
Please use my analysis article so far only for reference and use
I hope you operate safely with principle trading and loss cut prices.
Thank you.

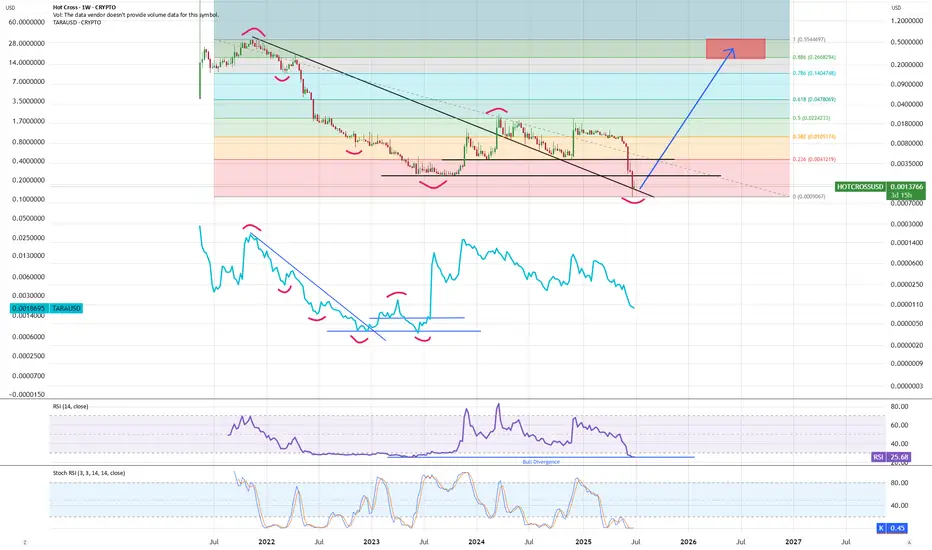
HOTCROSS - bounce now or never....HOTCROSS has same pattern as TARA before it reversed. It is also oversold with bullish divergence. It's now or never moment - we must bounce back to fibb 0.236 range from here to keep following TARA algo. Do that and we open path to test pivot at 0.50$ range.
Fallihg Wedge on AeroUSDT Reason to buy:
1. There's a falling wedge pattern in daily timeframe
2. Good volume
3. Stochastic oversold
4. Risk reward ok

HORD - is bottom in?HORD finally started bouncing but note that on local level we are oversold (stoch RSI) and have bearish divergence so some ranging at the bottom, maybe even quick wick to new lows would not surprise me. On larger timeframe we see pattern similar to AIOZ where we are now in endphase of correction and soon I expect strong push up. Once we break diagonal resistance line move will speed up toward pivot at fibb 0.786 range.

HEART - time to leave accumulation range?HEART still ranging at the bottom of accumulation range, and has done similar pattern to XRP before it reversed and went for new ATH.
We are currently oversold, sitting at RSI support line and have also bullish divergence on local level. I am expecting soon bounce up to try get back into rising channel pattern - do that and we open path for bigger run leading to test of ATH range.

HAI reversal time?HAI is oversold and is doing same pattern as XRP did before it blasted up to ATH range. If we are to continue following XRP algo then we must bounce up here, create higher low to initiate impulse leading to new ATH. Expected targets are fibb 1.272 and fibb 1.618 ranges.

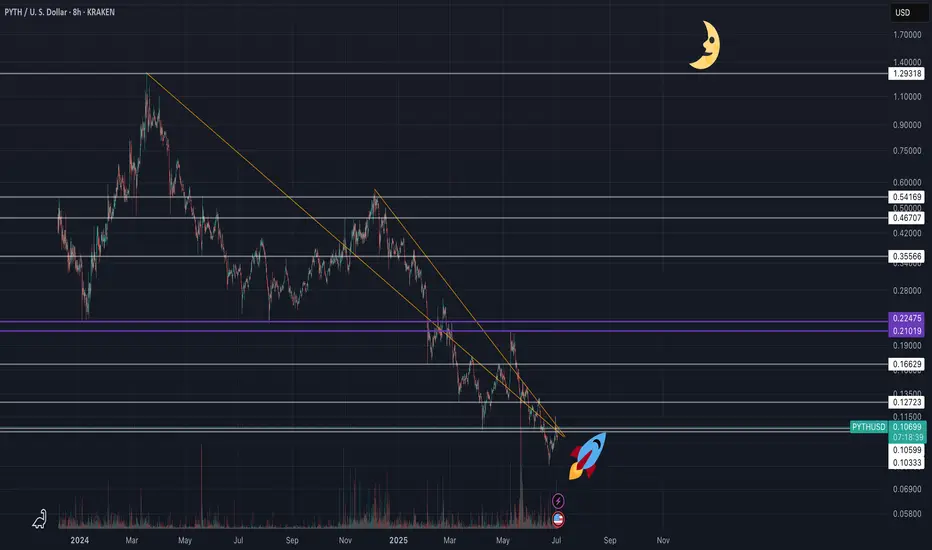
PYTH NETWORK (PYTHUSD) - (10X - 50X Potential)Pyth Network is an oracle protocol originally built for Solana, optimized for ultra-low latency and first-party data directly from exchanges and market makers. Unlike Chainlink’s node-aggregator model, Pyth enables real-time price feeds (as fast as 400ms) sourced directly from over 100 institutional providers, including Binance and Cboe.
🧩 Why Pyth?
DeFi apps need fast, accurate pricing to avoid exploits and ensure fair trading. Pyth delivers high-frequency, high-integrity data, especially valuable for derivatives, perpetuals, and high-speed DeFi protocols.
🌐 Massive Expansion
What started on Solana now powers 100+ blockchains, including Ethereum L2s, Cosmos, Sui, Aptos, TON, and more. As of 2025, over 420 protocols integrate Pyth, with over $48B+ monthly trading volume secured. It has become the #2 oracle in DeFi by usage, dominating ecosystems like Solana, Sui, and Injective.
📊 Tokenomics & Unlocks
Max supply: 10B PYTH
Circulating: ~5.75B (mid-2025)
Next major unlock: May 2026 (~2.1B tokens)
Utility: Governance, staking, publisher rewards, and oracle integrity
Pyth’s decentralized governance is growing, with a DAO now guiding key protocol parameters. It’s also expanding beyond price feeds, launching products like randomness (Entropy) and MEV mitigation tools (Express Relay).
Disclaimer: This is not financial advice. Always do your own research before making investment decisions.
$BTC Weekly Continues to follow the script!BTC appears to have completed a shallow wave 2 retracement showing investor excitement and demand - They just can't wait to buy some!
New all time highs are expected this week (perhaps today) once the High Volume Node resistance we are currently at is overcome (obviously).
Wave 3 has an expected target of the R3 pivot $190k but i am expecting price to overextend this cycle to at least the R4 pivot at $233k.
Safe trading

BTCUSD Trade Setup Idea on 1D Timeframe - Bullish MomentumBitcoin (BTCUSD) is currently trading at $109,348, showing strong bullish momentum on the 1H chart. The recent breakout from consolidation signals potential continuation, provided key resistance levels are breached and held.
Must Consider Analysis Timeframe : 1Day.
Strictly follow the trading rules for Entry..... only on Retracement.
SL on Previous or Close swing low.
🔍 Key Levels to Watch:
Bullish Continuation Confirmation: If price sustains above 112,150, we expect bullish momentum to accelerate.
Target 1 (TP1): 112,150 – Key breakout level that may act as support once reclaimed.
Target 2 (TP2 - Major): 121,128 – Long-term resistance and major profit-taking zone.
📊 Trade Logic:
A confirmed breakout and hold above 112,150 indicates strong buyer interest and could drive price toward 116,572 and 121,128.
The trend remains bullish as long as price holds above the breakout structure.
REMEMBER:- RESPECT THE LEVELS, LELEVLS RESPECT YOU THEN.
💡 Strategy: Monitor for retests and bullish candle confirmations above 112,150 to add or enter long positions with proper risk management.
! Disclaimer & Important Note:
This analysis is for educational and informational purposes only. It does not constitute financial advice or a recommendation to buy or sell any financial instrument. All trading involves risk. We are not responsible for any kind of loss incurred, whether financial, emotional, or otherwise. Always do your own research and consult with a licensed financial advisor before making any trading decisions.
Trading involves significant risk, and you should never invest more than you can afford to lose. Past performance is not indicative of future results.
The trade idea shared above reflects personal market interpretation and is subject to change based on new market conditions.
Posted by: THEPATELCRYPTO, 45Degree
Stay safe. Trade smart.
Follow for more ideas!
📍Posted by: THEPATELCRYPTO, 45Degree
📈 Stay safe. Trade smart.
🔔 Follow for more ideas!

TOTAL2 – Battling MA Resistance
TOTAL2 on the daily found support at the 0.382 Fib level on June 22. Since then, it has been moving upward.
Now it’s fighting the 50MA and 200MA resistance zone.
If this resistance is cleared, the 0.236 Fib level could be the next target.
Always take profits and manage risk.
Interaction is welcome.

Litecoin Encounters Resistance After Sharp RallyLitecoin climbed from $82.4 and is testing the bearish fair value gap at $90.4. With Stochastic showing short-term overbought conditions at 87.0, consolidation is expected.
LTC may retest $89.0 and then dip toward support at $86.9, which aligns with a volume point of interest. The bullish view holds above $82.4; below it, the outlook weakens.

Gold & $3400Gold is under the resistance at $3400 for a long time, and if can not break that then downside movement will come.

AAVE Daily – 0.618 Fib Reclaimed
AAVE on the daily has reclaimed the 0.618 Fib level after dropping below it and retesting the 200MA.
MLR > SMA > BB center — structure looks constructive.
If price holds this Fib level, there’s a good chance of targeting the 0.5 Fib around $350.
Always take profits and manage risk.
Interaction is welcome.

80% win rate strategy with TiqGPTul 3, 2025 7:59 AM
1h1h Chart
15m15m Chart
5m5m Chart
1m1m Chart
Buy Opportunity
Bullish Setup
Buy: ** Buy limit order at $109,340.36 following a retest of the consolidation zone confirming continued buying interest.
Entry: $109,340.36
Strategies: Multi-timeframe bullish order flow analysis, liquidity targeting above current levels.
Confidence: Medium
Risk/Reward: Calculated as follows:
Timeframe: The 1-hour chart shows a strong bullish impulse followed by a consolidation phase, indicating a potential accumulation by institutions. The price is currently testing a minor consolidation zone around $109,340, which could act as a temporary resistance.
Disclaimer: The information provided by this app is for educational and informational purposes only and does not constitute financial advice. Always do your own research before making any trading decisions. TiqGPT is not a licensed financial advisor.
Mark as Successful
Mark as Failed
T
Jul 3, 2025 8:00 AM
MARKET NARRATIVE:
1H Timeframe: The 1-hour chart shows a strong bullish impulse followed by a consolidation phase, indicating a potential accumulation by institutions. The price is currently testing a minor consolidation zone around $109,340, which could act as a temporary resistance.
15M Timeframe: The 15-minute chart reveals more granularity within the bullish structure, showing a series of higher lows and higher highs. This is indicative of continued buying interest and a lack of significant selling pressure at these levels.
5M Timeframe: On the 5-minute chart, the bullish momentum is more pronounced with a clear impulsive move upwards. The recent pullbacks are shallow, suggesting that the market is not ready to reverse but rather is gathering strength for further upward movement.
1M Timeframe: The 1-minute chart provides a detailed view of the buying pressure. The price action is making higher highs and higher lows, confirming the bullish sentiment observed in higher timeframes.
INSTITUTIONAL THESIS:
Institutions appear to be in an accumulation phase, likely targeting higher liquidity zones above the current price level. The consistent higher highs and higher lows across timeframes suggest a coordinated effort to push prices upward, possibly aiming for a significant liquidity pool above the $110,000 mark.
LEARNING POINT:
"Multi-timeframe confluence of bullish order flow and shallow pullbacks indicating strong buying interest."
SIGNAL: BUY
SYMBOL: BTC/USDT ENTRY PRICE: $109,340.36 STOP LOSS: $109,000.00 (just below the recent minor consolidation zone on the 1H chart) TARGET PRICE: $110,000.00 (next psychological and liquidity-rich level) CONDITION: Buy limit order at $109,340.36 following a retest of the consolidation zone confirming continued buying interest. RATIONALE: The trade is based on the alignment of bullish signals across multiple timeframes, shallow pullbacks indicating strong buying interest, and the targeting of higher liquidity zones. STRATEGIES USED: Multi-timeframe bullish order flow analysis, liquidity targeting above current levels. URGENCY: MEDIUM TIMEFRAME: Short-term CONFIDENCE SCORE: 85% RISK/REWARD RATIO: Calculated as follows:
Risk: $109,340.36 - $109,000.00 = $340.36
Reward: $110,000.00 - $109,340.36 = $659.64
Ratio: $659.64 / $340.36 ≈ 1.94:1
FINAL RECOMMENDATION:
WAIT - Although the bullish setup is strong, the risk/reward ratio of approximately 1.94:1 does not meet the minimum requirement of 2:1. It is advisable to wait for a better entry point that offers a higher potential reward relative to the risk or for the market to provide a deeper pullback to improve the risk/reward ratio.
Jul 3, 2025 8:01 AM
1h1h Chart
15m15m Chart
5m5m Chart
1m1m Chart
Hold - Waiting for Setup
Wait for Confirmation
Wait: Immediate market order based on current momentum.
Entry: $155.85
Stop Loss: $152.00
Target: $160.00
Strategies: Multi-timeframe BOS confirmation, Institutional Accumulation Phase
Confidence: 90%
Risk/Reward: Risk=$3.85, Reward=$4.15, Ratio=1:1.1 (Below 2:1 minimum)
Timeframe: Short-term
Disclaimer: The information provided by this app is for educational and informational purposes only and does not constitute financial advice. Always do your own research before making any trading decisions. TiqGPT is not a licensed financial advisor.
Mark as Successful
Mark as Failed
T
Jul 3, 2025 8:01 AM
MARKET NARRATIVE: The analysis across the four timeframes (1h, 15m, 5m, 1m) for SOL/USDT shows a consistent upward trend with a series of higher highs and higher lows, indicating a strong bullish momentum. The price action on the 1-hour chart shows a clear break of structure (BOS) above previous highs around $152, suggesting institutional buying pressure. This BOS is confirmed across the 15-minute and 5-minute charts, where we see continued bullish candles without significant retracement, indicating a lack of selling interest and potential accumulation by institutions. The 1-minute chart provides a more granular view of the buying pressure, showing tight consolidations followed by upward thrusts, typical of institutional demand in lower timeframes.
INSTITUTIONAL THESIS: Institutions appear to be in an accumulation phase, targeting higher prices. The consistent demand and absence of deep pullbacks suggest a strategy to absorb sell orders and push prices higher, likely aiming for liquidity above recent highs.
LEARNING POINT: The observed price action across multiple timeframes demonstrates a classic accumulation phase with a strong bullish momentum, indicating that institutions are supporting the upward move.
SIGNAL: WAIT SYMBOL: SOL/USDT ENTRY PRICE: $155.85 STOP LOSS: $152.00 (just below the recent structural break) TARGET PRICE: $160.00 (next psychological round number and potential liquidity area) CONDITION: Immediate market order based on current momentum. RATIONALE: Calculated risk/reward ratio of 1:1.1 (Risk=$3.85, Reward=$4.15) does not meet minimum 2:1 requirement. Waiting for better institutional setup with improved risk parameters. STRATEGIES USED: Multi-timeframe BOS confirmation, Institutional Accumulation Phase URGENCY: HIGH TIMEFRAME: Short-term CONFIDENCE SCORE: 90% (based on strong bullish signals across all observed timeframes) RISK/REWARD RATIO: Risk=$3.85, Reward=$4.15, Ratio=1:1.1 (Below 2:1 minimum)
RISK/REWARD CALCULATION: Risk = Entry Price - Stop Loss = $155.85 - $152.00 = $3.85 Reward = Target Price - Entry Price = $160.00 - $155.85 = $4.15 Ratio = Reward ÷ Risk = $4.15 ÷ $3.85 ≈ 1.08
Given that the calculated risk/reward ratio is less than 2:1, the recommendation is to WAIT for a better entry point or a more favorable risk/reward setup. The current market conditions are bullish, but the trade does not meet the strict institutional criteria for a minimum 2:1 risk/reward ratio.
Jul 3, 2025 8:04 AM
1h1h Chart
15m15m Chart
5m5m Chart
1m1m Chart
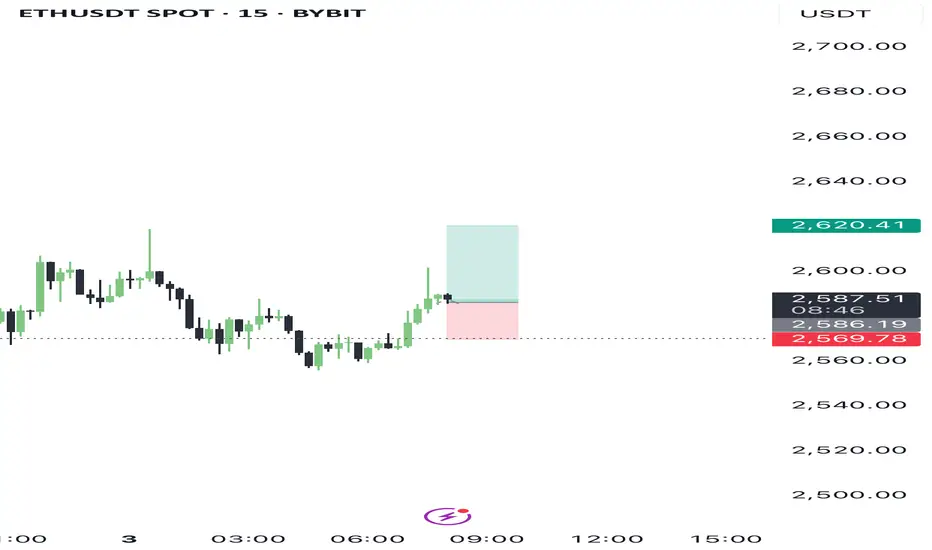
Buy Opportunity
Bullish Setup
Buy: Buy limit order at current market price with confirmation of continued buying pressure and no break of recent higher lows.
Entry: $2586.00
Stop Loss: $2570.00
Target: $2620.00
Confidence: 85%
Risk/Reward: Risk=$16.00, Reward=$34.00, Ratio=1:2.1
Timeframe: Short-term
Disclaimer: The information provided by this app is for educational and informational purposes only and does not constitute financial advice. Always do your own research before making any trading decisions. TiqGPT is not a licensed financial advisor.
Mark as Successful
Mark as Failed
T
Jul 3, 2025 8:04 AM
MARKET NARRATIVE:
Analyzing the ETHUSD pair across multiple timeframes (1H, 15M, 5M, 1M), we observe a consistent pattern of upward momentum followed by consolidation, suggesting a phase of accumulation and potential preparation for a further upward move. The 1H chart shows a strong impulsive move followed by a tight consolidation, indicating strong buying interest and limited selling pressure. The 15M and 5M charts display similar characteristics with price making higher lows, a sign of sustained buying pressure. The 1M chart, while more granular, shows some pullback, which could be interpreted as a liquidity hunt within a bullish structure.
INSTITUTIONAL THESIS:
Institutions appear to be in an accumulation phase, using smaller timeframes to engineer liquidity sweeps (collecting stop losses below minor swing lows) before potentially driving the price higher. The consistent higher lows across timeframes support this thesis, suggesting an underlying strength in buying pressure.
LEARNING POINT:
The current setup exemplifies "Institutional Accumulation with Liquidity Sweeps" where smart money uses minor pullbacks to gather more positions favorably, anticipating a continuation of the trend.
SIGNAL: BUY
SYMBOL: ETHUSD
ENTRY PRICE: $2586.00
STOP LOSS: $2570.00
TARGET PRICE: $2620.00
CONDITION: Buy limit order at current market price with confirmation of continued buying pressure and no break of recent higher lows.
RATIONALE:
Market Structure: Higher lows on 15M and 5M charts indicate sustained buying interest.
Order Flow: Accumulation evident from tight consolidations and quick recoveries from dips.
Liquidity: Recent pullbacks likely served as liquidity hunts, setting the stage for a potential upward continuation.
Strategies Used: Multi-timeframe analysis confirms institutional buying pressure and accumulation phase.
ethusdt.1hETH/USDT analysis on the hourly time frame, based on trend analysis, support and resistance.

BTC inverted head n shoulder to 120kBTC inverted head n shoulder to 120k. I'm sure everybody has seen this set up but I just wanted to document it for myself.
A break and re-test of 109500 could get us to the measured move of 120k.
I'm laddering in.

BTCUSDT Daily – Bullish Engulfing = Big Move?Whenever we've seen a bullish engulfing candle on the daily timeframe, it’s often followed by a strong upward move. This pattern has repeated consistently throughout the current cycle.
🔹 The recent daily close shows a clean bullish engulfing right off the 50 EMA support.
🔹 Previous purple zones also highlight areas where similar engulfing candles led to sharp rallies.
🔹 Price is once again reclaiming momentum after a liquidity sweep — a classic accumulation signal.
📈 If history repeats, we could be eyeing another leg higher toward the $112K–$115K zone.
Pattern Psychology:
"This bullish engulfing isn’t just a candle — it's a sentiment shift, where buyers overpower sellers completely in one session."
🔹EMA Bounce Strategy:
"Price is using the 50 EMA as a trampoline — a typical smart money support zone."
🔹 Rejection of Breakdown Narrative:
"The fakeout below 100,582 support could be a classic bear trap, setting up for a liquidity-driven rally."
🔹 Pivot Zone Reaction:
"Immediate pivot zone (102,292) reclaimed — price now in a favorable position to target next R1 around 110,000."
🔹 Historical Context:
"This setup mirrors the March bounce, where similar structure and RSI/MACD confluence led to a 12% surge."
⚠️ Disclaimer:
This is not financial advice or a buy/sell recommendation. Analysis is for educational purposes only.
All chart markings and interpretations are original.

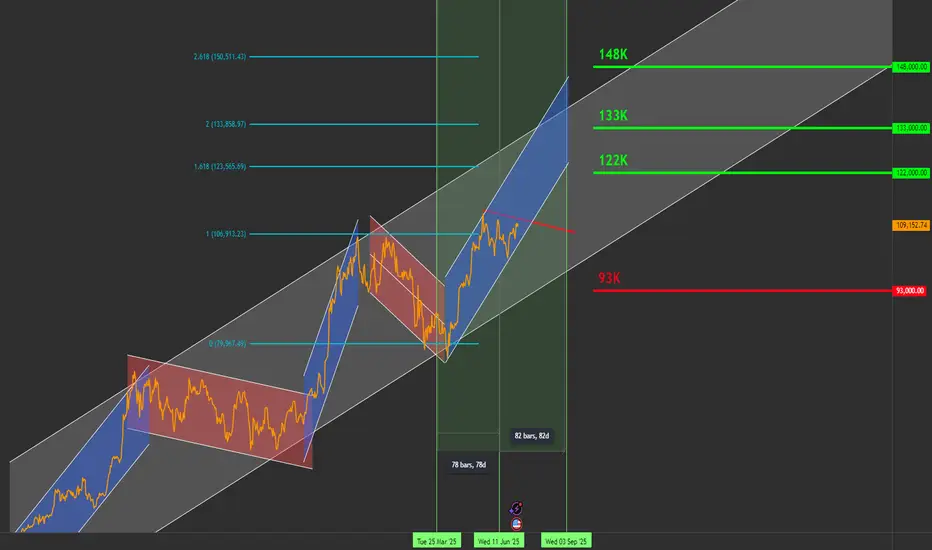
Bitcoin Roadmap to $144K by September – Daily Chart Breakout SetHello traders,
I'm sharing my current outlook on Bitcoin using the daily timeframe. Price is ~109K below a key descending trendline (in red), which has defined the structure since 21 May.
🔍 Key Levels to Watch:
Resistance: $111,000
Support: $91,000
Current Price: ~$109,000
⚡ Breakout Scenario:
If Bitcoin closes above $111K on the daily chart, backed by strong volume (ideally 30% above the 20-day average), I expect the next targets to unfold as:
✅ $122,000
✅ $133,000
✅ $144,000
🗓️ Target date for $144K: Around 22 September 2025
This projection is based on a pivot structure I’m tracking:
🟢 25 March 2025: Pivot low at ~$84K
🔴 12 June 2025: Pivot high
🟡 Expected pivot high: ~4 September 2025 (if symmetry holds)
This pattern suggests a 1-2-3 formation that could lead to a breakout move.
🧯 Failure Scenario:
If BTC fails to break out, I’m watching for a pullback toward the $91K support zone.
🛑 Current Stance:
I’m not in a position yet. Waiting for a daily candle close above $111K with volume confirmation and momentum indicators.
📣 Stay Updated
I’ll be sharing daily updates as the price action evolves.
Follow me here on TradingView, and feel free to share your analysis or ask questions in the comments!
🏷️ Hashtags:
#BTCUSD #BitcoinAnalysis #CryptoTrading #BTC #TechnicalAnalysis #SwingTrade #BreakoutSetup
Let me know your comments.
Bitcoin’s not done dropping. Selling pressure’s still on!Welcome aboard ✌️
In order for Bitcoin to climb higher, we first need a deeper correction.
Right now, price is stuck inside a channel — and it’ll take stronger momentum to break out.
🔻 So for now, I’m expecting further downside. Stick with me and don’t miss this bearish wave!
BINANCE:BTCUSD OANDA:BTCUSD

All Time Schiff Pitchfork: ETH to $26k this cycleEthereum’s All-Time Schiff Pitchfork Points to $26,000 Top This Cycle
What if I told you Ethereum’s long-term trajectory already contains the roadmap to its next parabolic peak—and it's hiding in plain sight?
By applying an all-time Schiff Pitchfork to ETH’s historical price action, we uncover a channel of truth that has guided Ethereum’s macro moves since its inception. And according to this structure, the upper bound this cycle sits around $26,000.
Yes, $26K ETH is not only possible—it’s technically aligned.
🧭 Schiff Pitchfork: A Forgotten Tool With Powerful Insight
While traditional pitchforks center around initial anchor points, the Schiff Pitchfork adjusts the median line to better reflect price momentum and curvature over time. For Ethereum, it captures macro cycles and logarithmic price evolution with eerie accuracy.
We anchor the pitchfork as follows:
Point A: March 2020 COVID bottom (~$90)
Point B: May 2021 cycle top (~$4,400)
Point C: June 2022 bottom (~$880)
This sets a median growth trajectory with upper and lower bounds that have so far contained all of Ethereum’s major rallies and retracements.
📈 The Pitchfork Speaks: $26K = Upper Rail This Cycle
The upper boundary of the pitchfork intersects around $26,000–$27,000 between November 2025 and January 2026
This aligns with:
Cycle timing: Ethereum typically peaks ~8 months after Bitcoin
Macro window: Projected end of global liquidity expansion before potential recession
ETF catalyst: BlackRock’s staking ETF + TradFi inflows could supercharge final leg
ETH/BTC breakout zone: Suggests ETH will outperform BTC in the late stage of the cycle
If Ethereum follows the historical path set by prior cycles (2017, 2021), and this channel remains valid, then $26K ETH becomes a technical magnet, not a fantasy.
🧠 Why $26K Isn’t Just a Chart Target
Let’s break down what would justify that kind of valuation:
Factor Supporting Insight
🟢 Staking ETF Institutional demand + ETH supply removed from float
🔥 Deflationary Tokenomics Post-1559 burn + staking = net negative issuance
⚙️ L2 Ecosystem Maturity Rollups, zkEVMs, and restaking create multi-chain ETH demand
🌐 Global Liquidity Window Fed cuts + soft macro conditions = floodgates open
📈 ETH/BTC Ratio Inversion Signals capital rotation to high beta assets
🛑 Risks to the $26K Scenario
Regulatory delays on staking ETF
Broader market crash or macro liquidity crunch
ETH/BTC fails to break out, Bitcoin dominance remains too high
Ethereum scaling and L2 fragmentation cannibalizes fee market faster than expected
🎯 Price Zones on the Schiff Pitchfork
Zone Price Range Interpretation
Lower Bound $3,000–$4,000 Final dip buy zone (if macro spooks)
Median Line $10,000–$14,000 Base case target with ETF flows
Upper Rail $25,000–$26,500 Max cycle top (Q4 2025–Q1 2026)
🧬 Conclusion: The Channel Has Spoken
The Schiff Pitchfork isn’t a magic wand—it’s a map. But Ethereum has respected this structure since 2020, and it’s now approaching the most important confluence zone in its history.
With ETFs, L2 scaling, deflationary supply, and a maturing institutional narrative, ETH has the fundamental firepower to make $26K real—not just chart art.
This may be the final cycle where ETH 4-digit prices are possible.
📊 Follow for more Ethereum macro cycle analysis, ETH/BTC tracking, and altseason models.
📍 Chart available on request—drop a comment if you'd like the TradingView link with Pitchfork drawn
#Ethereum #ETHUSD #PitchforkAnalysis #SchiffPitchfork #CryptoCycles #ETHPrediction #Altseason #ETHChart #ETH26K

TAO July 2025 Long High probNext Tao entry from a good risk to reward long position. Waiting for a sweep and close back in the consolidation range, looking for higher prices.
Bring stops to break even quickly when in profit
