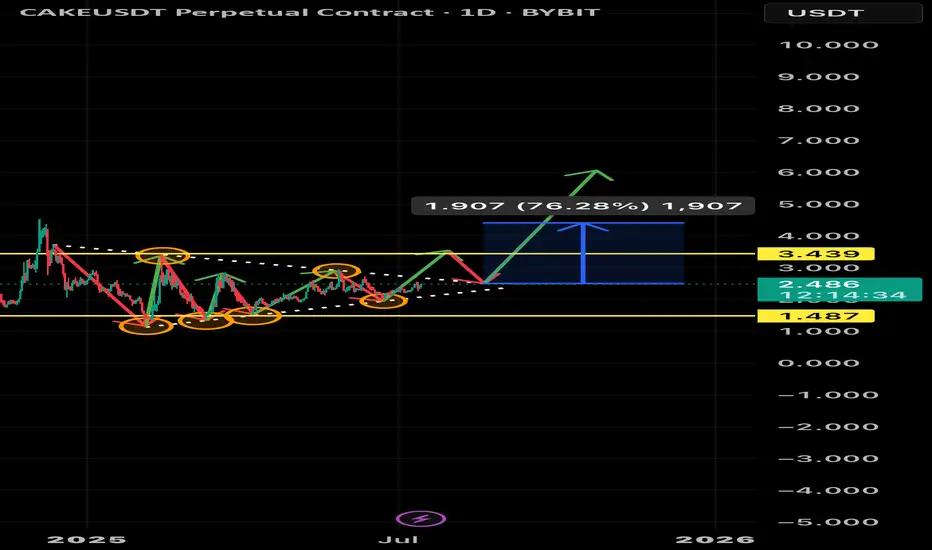
CAKEUSDT – Symmetrical Triangle Breakout Potential (1D Chart)The CAKE/USDT pair is currently consolidating inside a symmetrical triangle, showing signs of reduced volatility and building pressure. Multiple price reactions at both the upper and lower trendlines (highlighted with orange circles) confirm the triangle’s validity.
A breakout scenario appears likely, with a potential upward move of around 76%, targeting the $4.38 region. A key resistance level sits at $3.439, which may act as a pullback zone before continuation.
The support zone is well-defined near $1.487, and price has respected this level consistently.
If bulls manage to push through the triangle’s resistance, this could signal the beginning of a significant bullish leg in the coming weeks.
⚠️ As always, wait for confirmation before entering a trade and manage your risk accordingly.
#CAKE #Crypto #Breakout #TechnicalAnalysis #Altcoins #TradingView
Crypto market
Balla is still Bullish on BITCOIN. Cup & Handle pattern. The trend is still our friend.
I still see bullish developments in the price action.
We must have patience.
Dips still must be bought.
The plan hasn't changed.
We still aiming for that time period of 9 -15 months post #BTC Halving.
We are only one month down :)

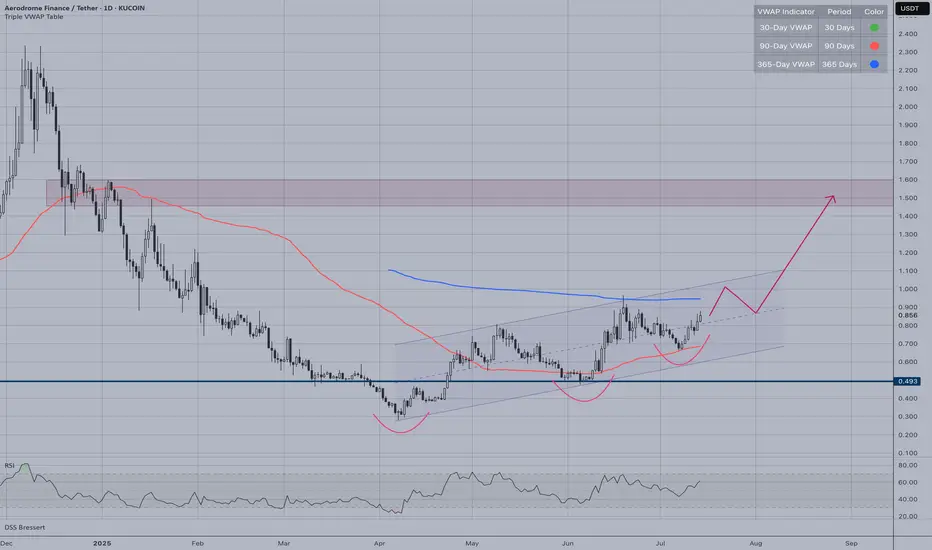
AERO | Potential Coinbase IntegrationCoinbase is integrating DEX trading into its main app. The integration will use the Base blockchain. For now, it's unclear which DEX they will use, but I think Aerodrome, as the biggest one, has a good chance.
Technically, AERO demonstrates strong bullish momentum with a clear pattern of higher lows since the June bottom around $0.30. The token has successfully broken above multiple resistance levels and is currently testing the critical $0.848 zone.
Key Technical Observations:
Bullish Structure: Clear ascending channel with consistent higher lows
Momentum: RSI showing healthy levels without being overbought
Risk Considerations:
Overall crypto market sentiment remains crucial
Integration news may already be priced in
The combination of technical strength and potential fundamental catalyst creates a compelling bullish setup for AERO in the near term.
#AGLD/USDT Alert! Imminent Rise#AGLD
The price is moving within a descending channel on the 1-hour frame, adhering well to it, and is heading for a strong breakout and retest.
We have a bounce from the lower boundary of the descending channel. This support is at 0.685.
We have a downtrend on the RSI indicator that is about to be broken and retested, supporting the upside.
There is a major support area in green at 0.680, which represents a strong basis for the upside.
Don't forget a simple thing: ease and capital.
When you reach the first target, save some money and then change your stop-loss order to an entry order.
For inquiries, please leave a comment.
We have a trend to hold above the 100 Moving Average.
Entry price: 0.0695
First target: 0.700
Second target: 0.718
Third target: 0.734
Don't forget a simple thing: ease and capital.
When you reach the first target, save some money and then change your stop-loss order to an entry order.
For inquiries, please leave a comment.
Thank you.

SellTrend Line Break
Previous Day Volume
Rejection Point
Untapped Order Point
London Session
High Structure Swing
#MORE/USDT A quick100 % return#MORE
The price is moving within a descending channel on the 1-hour frame, adhering well to it, and is on its way to breaking it strongly upwards and retesting it.
We have a bounce from the lower boundary of the descending channel. This support is at 0.02844.
We have a downtrend on the RSI indicator that is about to break and retest, supporting the upward move.
There is a key support area in green at 0.02720, which represents a strong basis for the upward move.
Don't forget one simple thing: ease and capital.
When you reach the first target, save some money and then change your stop-loss order to an entry order.
For inquiries, please leave a comment.
We have a trend of stability above the Moving Average 100.
Entry price: 0.02998
First target: 0.03140
Second target: 0.03334
Third target: 0.03582
Don't forget one simple thing: ease and capital.
When you reach the first target, save some money and then change your stop-loss order to an entry order.
For inquiries, please leave a comment.
Thank you.

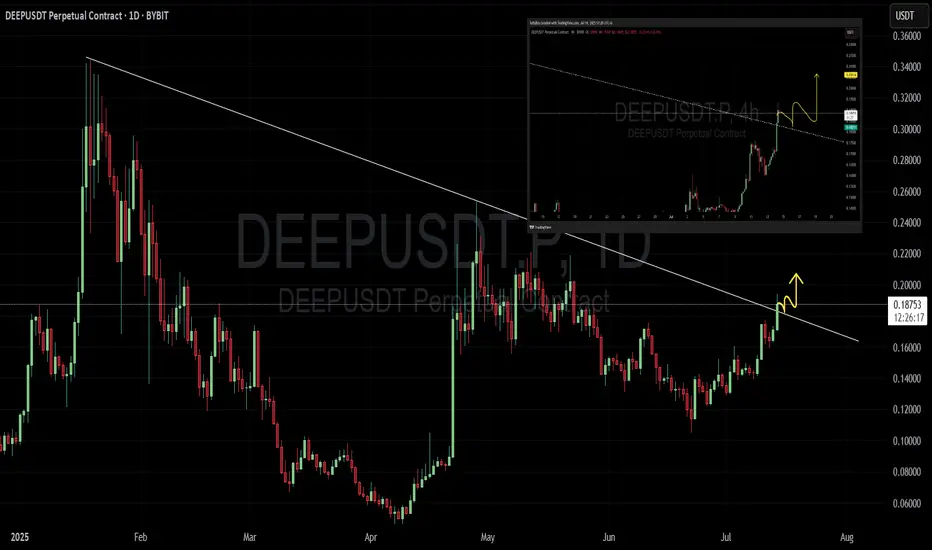
DEEP !! how deep will you retrace ?🚨 DEEPUSDT BREAKOUT ALERT 🚨
🔥 Price has broken the long-term downtrend on the 1D chart
🟢 Retesting the trendline near 0.182
📈 If it holds — we may see a strong pump ahead!
Chart shows strong momentum — watch for retest and ride the wave 🌊
— TuffyCalls Team ✅
Ethereum Breaks $3,000: Hype Meets UtilityEthereum (ETH) has surged above $3,000, driven by a wave of retail and institutional momentum following the presale success of Little Pepe (LILPEPE), a meme coin built on a new Ethereum-compatible Layer 2 network. With over $5 million raised during the presale, the appetite for meme-coin ecosystems continues to fuel Ethereum’s utility narrative, giving it both technical and psychological strength.
Key Levels to Watch:
• Short-term Structure (H4 Chart): ETH is currently forming a bullish flag pattern, a continuation structure that often precedes further upside.
• Upside Scenario: A confirmed breakout above $3,100 could extend the rally to $3,200, and potentially test $3,300, a level of major historical resistance.
• Downside Risk: Failure to hold current levels may see ETH retrace back toward $2,900, with the 50% Fibonacci retracement at $2,600 acting as the next support zone.
If sentiment in the broader crypto market remains elevated and Bitcoin holds firm near all-time highs, Ethereum’s bullish setup may have further room to run.

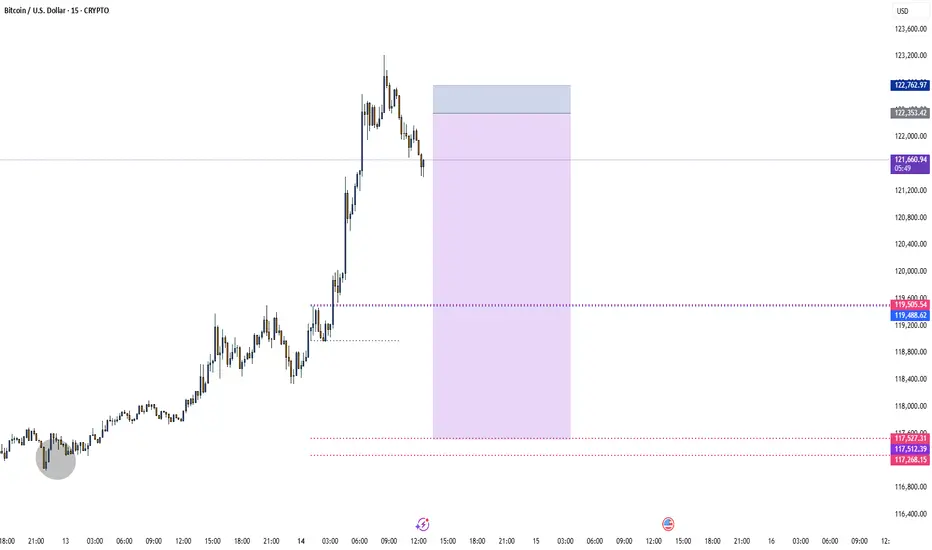
BTC CME Bearish GAPA gap to be filled in the Bitcoin CME Future at 114,000
Break of 120500 will open the door for 118,000 then 114,000 next.
I reckon buyers will pop-in near 114,000

#WLD/USDT Builds Pressure Inside Long-Term Range#WLD
The price is moving within a descending channel on the 1-hour frame and is expected to break and continue upward.
We have a trend to stabilize above the 100 moving average once again.
We have a downtrend on the RSI indicator that supports the upward break.
We have a support area at the lower boundary of the channel at 0.992, acting as strong support from which the price can rebound.
We have a major support area in green that pushed the price upward at 0.930.
Entry price: 1.00
First target: 1.036
Second target: 1.073
Third target: 1.111
To manage risk, don't forget stop loss and capital management.
When you reach the first target, save some profits and then change your stop order to an entry order.
For inquiries, please comment.
Thank you.

#PEOPLE/USDT trading opportunity#PEOPLE
The price is moving within a descending channel on the 1-hour frame and is expected to break and continue upward.
We have a trend to stabilize above the 100 moving average once again.
We have a downtrend on the RSI indicator that supports the upward break.
We have a support area at the lower boundary of the channel at 0.2030, acting as strong support from which the price can rebound.
We have a major support area in green that pushed the price upward at 0.02000.
Entry price: 0.02070
First target: 0.02140
Second target: 0.02210
Third target: 0.02288
To manage risk, don't forget stop loss and capital management.
When you reach the first target, save some profits and then change the stop order to an entry order.
For inquiries, please comment.
Thank you.

#MYRO/USDT myro road map ( 1 H )#MYRO
The price is moving within a descending channel on the 1-hour frame and is expected to break and continue upward.
We have a trend to stabilize above the 100 moving average once again.
We have a downtrend on the RSI indicator that supports the upward break.
We have a support area at the lower boundary of the channel at 0.02040, acting as a strong support from which the price can rebound.
We have a major support area in green that pushed the price upward at 0.01900.
Entry price: 0.02087
First target: 0.02178
Second target: 0.02278
Third target: 0.02373
To manage risk, don't forget stop loss and capital management.
When you reach the first target, save some profits and then change the stop order to an entry order.
For inquiries, please comment.
Thank you.

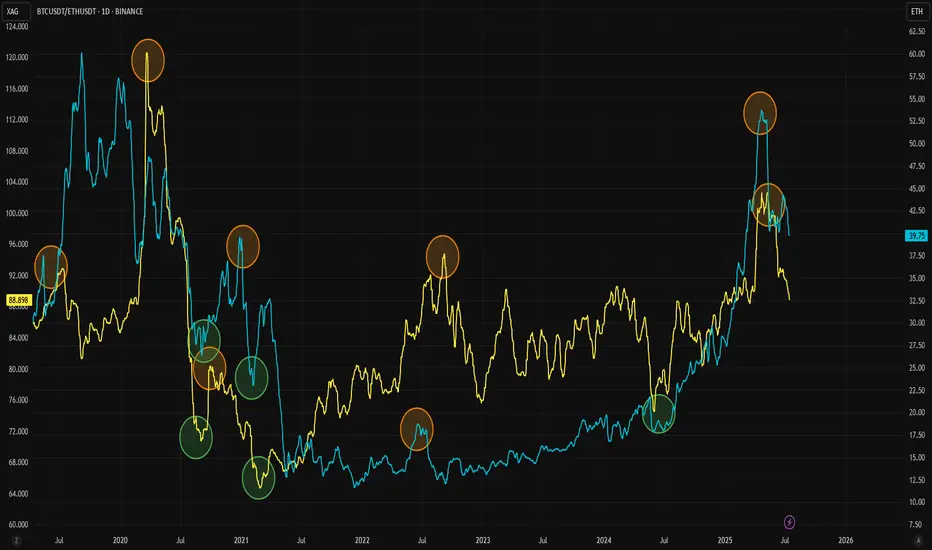
Want to Know What Happens in Crypto? Check Silver InsteadThe Gold/Silver ratio is one of the key indicators that highlights major turning points in modern economic history. Similarly, the ETH/BTC ratio is widely followed as a gauge of strength in the crypto market and the beginning of altcoin seasons. Interestingly, these two ratios also appear to correlate well with each other.
As adoption of both Ethereum and Bitcoin has grown, the Gold/Silver and BTC/ETH ratios have started to move more closely together. They often follow similar patterns, with tops and bottoms forming one after the other. For clarity, this analysis uses the BTC/ETH ratio rather than ETH/BTC.
Historically, BTC/ETH tends to lead during market tops, followed by a similar move in the Gold/Silver ratio. This pattern has been observed repeatedly since 2020. When it comes to bottoms, the timing between the two ratios is usually tighter, as seen during the 2020, 2021, and 2024 lows.
The latest signal came from a top in the BTC/ETH ratio, and the Gold/Silver ratio now appears to be following that move. Given the cyclical nature of crypto markets, both ETH and silver could be at the early stages of new upward trends. For a potential trend reversal, it may be wise to keep a closer eye on silver in the coming weeks.
Buy Trade Strategy for ONDO: Bridging Traditional FinanceDescription:
This trading idea focuses on ONDO, a cryptocurrency that sits at the intersection of traditional finance and decentralized finance (DeFi). As the native token of Ondo Finance, ONDO powers a platform that aims to bring real-world assets—such as bonds and treasuries—onto the blockchain, enabling institutional-grade investment access for a broader audience. With increasing regulatory clarity around tokenized securities and rising demand for stable yield-generating products, ONDO is well-positioned to benefit from the convergence of conventional finance and DeFi innovation.
The project’s focus on compliance, transparency, and sustainable yield sets it apart in a crowded market. However, the crypto space remains volatile, and ONDO’s value is influenced by broader market conditions, regulatory dynamics, and investor sentiment.
Disclaimer:
This trading idea is for educational purposes only and should not be considered financial advice. Trading or investing in cryptocurrencies like ONDO carries significant risks, including the possibility of total capital loss. Always conduct your own due diligence, consider your personal financial situation, and consult a financial advisor before making any investment decisions. Past performance is not a reliable indicator of future results.

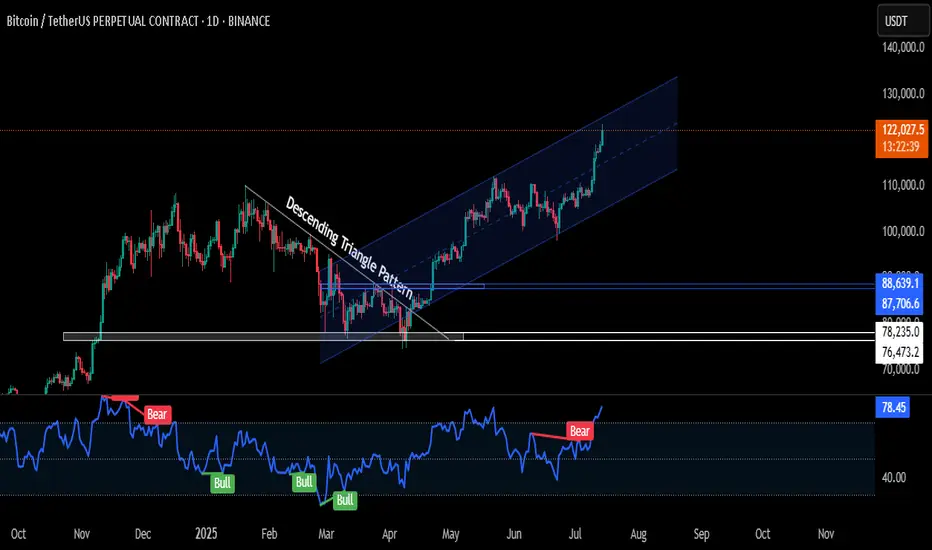
BTC Hits Channel Ceiling – Smart Money Taking ProfitsBINANCE:BTCUSDT.P
🚨 BTC has cleanly broken above $120K, tagging $123,300 today (ATH) — pushing the top boundary of a well-respected rising channel that’s been in play since April.
🔍 Analysis:
Structure & Trend:
Price broke out of a Descending Triangle back in March — that move initiated a trend, not just a spike. Since then, BTC has followed an ascending channel, showing institutional-style demand: controlled, aggressive, and layered.
Current Price Action:
We’re at the upper edge of the rising channel, where many traders either:
- Exit early out of fear of reversal,
or
- Chase breakout longs, often just before a shakeout.
Smart trading now = discipline, not FOMO
If BTC fails to hold above $120K, expect a cool-off to the channel midline around ($111K–$112K) or even lower.
🧠 What to Do as a Trader:
Already in from Lower?
This is your TP zone or trailing stop region. Don't get greedy.
Protect capital. Re-enter on retest or new setup.
Looking to Enter Now?
Not ideal. Let the chart either break and retest cleanly OR
pull back to mid-channel ($112K area) for a high-R:R setup.
📌 Summary
BTC is bullish — no denial. But this is the zone where pros reduce risk and wait for confirmation, while most retail enters blindly.
Don’t be the liquidity.
✅ Follow for more real-time updates
🔁 Share it with your fellow traders
🚀 And hit that Boost button to support the work!
Let’s trade smart, not emotionally. 💯
#CMPInsights
ETH/BTC AT 200 MA RESISTANCEQuick update on ETH/BTC. As discussed, ETH is finding strong resistance at the daily 200 MA, riding it down for 5 days. On the ETH/USD chart, the 50 and 200 MAs are in the rearview. A break above the 200 MA on the daily chart vs. BTC could signal a major move in altcoins.

PENGUUSDT 50%-150% potentialBINANCE:PENGUUSDT is showing a classic cup and handle breakout on the daily chart, supported by a strong upward move and a bullish structure. Price has successfully broken out of key resistance around 0.0173, and volume is picking up. If momentum continues, the projected target points toward the $0.045 level, suggesting a potential upside of 50%-150%. The setup remains valid as long as price stays above the handle low around 0.0141.
Regards
HExa

Buy Trade Strategy for POL: Backing the Future of Web3 GovernancDescription:
This trading idea highlights POL, the new token powering the next evolution of the Polygon ecosystem, which is shifting toward a more robust and scalable multichain architecture. Designed to eventually replace MATIC, POL introduces advanced staking and governance capabilities that aim to unify and secure various Layer 2 solutions under one interoperable umbrella. Its core function is to support validators across multiple Polygon chains, making it an essential asset for the future of decentralized Web3 infrastructure.
The migration to POL is more than a technical upgrade—it's a strategic move to strengthen long-term network sustainability and user empowerment. As adoption of Polygon’s technology continues to grow across DeFi, gaming, and enterprise solutions, POL is positioned to become a fundamental component of the next generation of blockchain governance.
Disclaimer:
This trading idea is for educational purposes only and is not to be considered financial advice. Investing in cryptocurrencies, including POL, carries a high level of risk and may result in the complete loss of capital. Always conduct your own due diligence, evaluate your personal financial situation, and consult a licensed financial advisor before making investment decisions. Past performance is not indicative of future results.

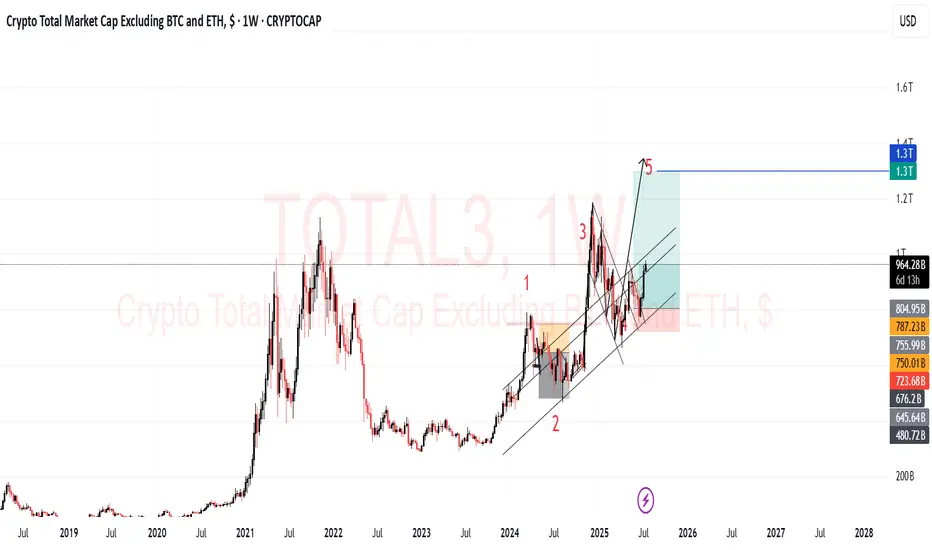
BITCOIN BREAKS YEARS LONG ASCENDING TRENDLINE RESISTANCEThe recent surge in the price of Bitcoin has led to the break of years long ascending trendline resistance as can be seen on Weekly BTC chart.
The price of BTC can soar higher above this resistance level and can take support from this level to mark a successful breakout.
Breakouts like this does create FOMO among traders but trading such breakouts must be done with caution as the price can still fall under the resistance level.
Best of Luck!!

$ETH LONG POSISI I see potential In CRYPTOCAP:ETH Hi break high , i will take hi for retectment area and order block .
If u want entry area see on chart

Rally! : My Target in Sight, and It’s Only a Matter of TimeInverted Head&Shouldres -- Breakout -- Double top -- Retest Neckline -- BOOM !!

BAKEUSDT Approaching Breakout from Falling WedgeBAKEUSDT is currently trading near the upper resistance of a falling wedge pattern , often seen as a bullish reversal setup. With increasing volume and tighter price action, the market may be gearing up for a breakout. If confirmed, this could mark the beginning of a new upward trend. Traders should stay alert and wait for a clear breakout above resistance to validate the move.
