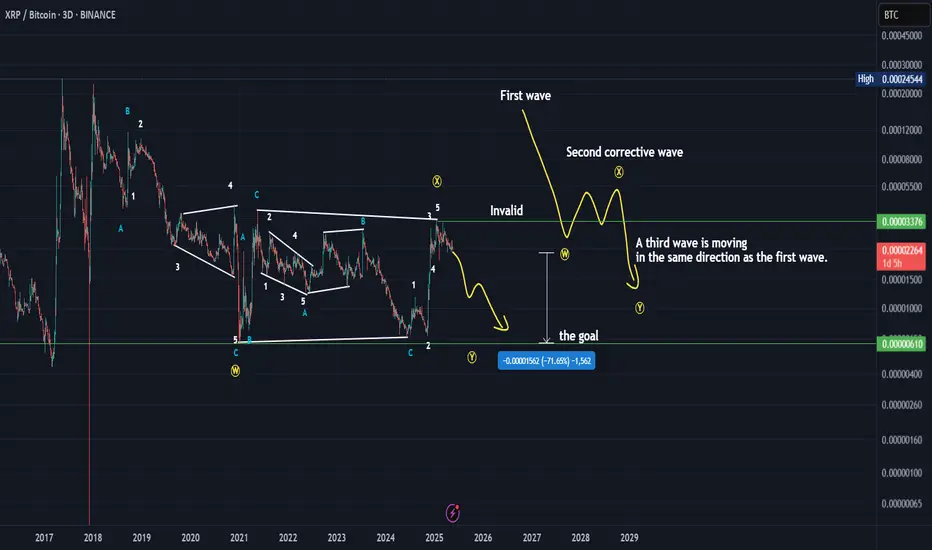
Map Of FillIt has been moving sideways for more than two years and a head and shoulders pattern has been formed on a large monthly fact first glance at the chart, we find that it has been moving sideways for more than two years, forming a head and shoulders pattern, which indicates a further decline. On the other hand, a sideways wave has been formed, which is an X wave, and we are preparing for a large bearish W wave to come.rame, so it is expected to fall again strongly to one of the two areas specified below.
Note: There is a previous analysis of this currency on my page and all its legacies were explained before.
*In principle, I am not a supporter of any direction, but I am only giving my point of view, which may be right or wrong. If the analysis helps you, then this is for you. If you do not like this analysis, there is no problem. Just ignore it. My goal is to spread the benefit. I am not one of the founders of the currency.
Crypto market

Next goalFrom a general view of the chart, we find, according to the analysis, that this rise is not a motive, but rather a correction, and this indicates that there is another strong decline coming soon unless it breaks the analysis failure area specified above.
*In principle, I am not a supporter of any direction, but I am only giving my point of view, which may be right or wrong. If the analysis helps you, then this is for you. If you do not like this analysis, there is no problem. Just ignore it. My goal is to spread the benefit. I am not one of the founders of the currency.

Chart history XRPThis analysis will take a lot of time because it is medium-term and the failure point is close and only when it is broken does the analysis fail. Other than that, it is in a downward trend and all the data is explained on the chart.
*In principle, I am not a supporter of any direction, but I am only giving my point of view, which may be right or wrong. If the analysis helps you, then this is for you. If you do not like this analysis, there is no problem. Just ignore it. My goal is to spread the benefit. I am not one of the founders of the currency.
ETHBTCTick tock
This is the most unlooked at chart in crypto because there is nothing bullish about it but eths fundamentals are insanely bullish
I'm a huge eth bull and hate looking at this chart
It will run it back at some point but its clearly not in a rush and lesser understood on the institutional finance side of the market.

BTC massive sell BTC massive sell is about to begin
Wait for confirmation
Buyers are active in the supply zone
Watch out for potential turning points
To the down or upside.
Proper risk management is advised
Happy trading.

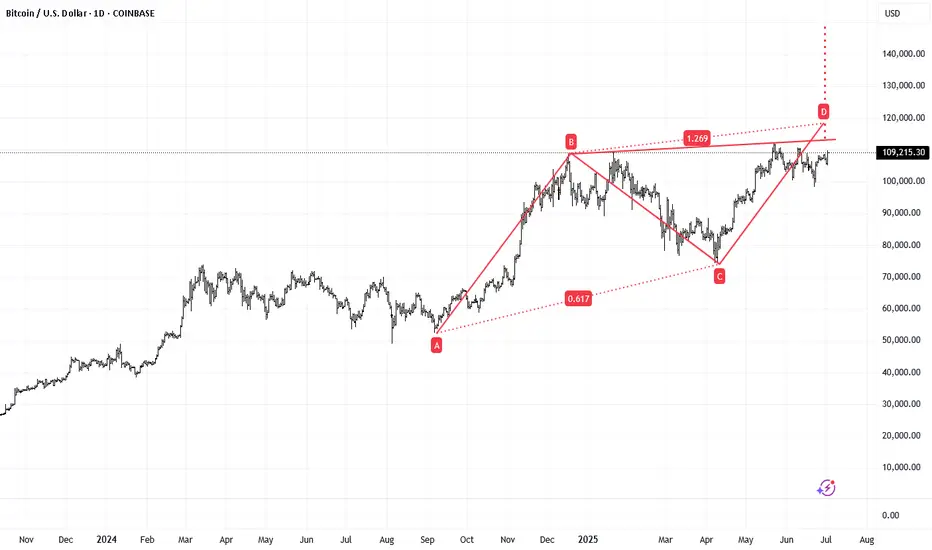
BTC — Harmonic Parabolic Scenario 1. Rise to 110–111k by July 4–5
2. Drop into July 9–10
3. Parabolic move after July 10
4. TP: ATH+
5. Stop: scenario invalid if no breakout

BITCOIN STRONG RESISTANCE AHEAD|SHORT|
✅BITCOIN is going up now
But a strong resistance level is ahead at 112,000$
Which is also an All-Time-High
Thus I am expecting a pullback
And a move down towards the target of 107,300$
SHORT🔥
✅Like and subscribe to never miss a new idea!✅
Disclosure: I am part of Trade Nation's Influencer program and receive a monthly fee for using their TradingView charts in my analysis.

BTCUSD Bullish Medium-termBTCUSD is about to start the bull run.
Break of 113000 will target 118,000 before 150,000 in the coming 4 months.
Head and Shoulders Head and shoulders at the bottom of a downtrend.
Closed below neckline and rejected the neckline on the uptrend.
Heigh of head to neckline (price difference) x 2 = price target.
needs to close above the right shoulder to invalidate.
Always set a SL

#5572025 | BTCUSD Supply Zone 1:10BTCUSD Supply Zone Appears in D1 Time Frame Looking Price Action for Long Term Sell
Risk and Reward Ratio is 1:10
After 50 pips Profit Set SL Entry Level
"DISCLAIMER" Trading & investing business is "Very Profitable" as well as risky, so any trading or investment decision should be made after Consultation with Certified & Regulated Investment Advisors, by Carefully Considering your Financial Situation.

Pudgy Penguins PENGU price analysis🪙 It seems that #PENGU is being sold off, and the price of OKX:PENGUUSDT has been stuck in consolidation at conditional highs for several days now, where positions are likely being redistributed.
Nevertheless, if at the beginning of the year, after listing, the price of the #PudgyPenguins token was released into not even “free float,” but simply into “free fall,” now, for several months, it has been “held” in a controlled manner.
🐻 If our assumption is correct, then the price of #PENGUUSDT should adjust to $0.01 or, in the worst case, to $0.0065-0.0070
📈 And if we are wrong, then the price of #PENGU has every chance of breaking out through to $0.02 in the coming days. With a global target of $0.03
⁉️ What is your opinion
Is this a fundamental project that is doomed to grow, or just a manipulative memecoin toy?
_____________________
Did you like our analysis? Leave a comment, like, and follow to get more

SPX6900 — Dream Scenario1. Wait for price to sweep EQ lows (buy zone)
2. Enter long only after SFP / bullish confirmation
3. Target: 2.13+
4. Stop: below buy zone
If no sweep — no trade!

ETH | Long | 3 Hrs | Target: 2,540This technical analysis is for informational and educational purposes only. It does not constitute financial advice. Remember to always research and consult with a professional before making investment decisions. Good luck! 📈💼🚀

Pyth Big long to $0.1155Just recently opened a long trade on pyth. Aiming for $0.1116 to $0.1155
Beautiful setup.
Market is bullish and seems the correction have come to an end on the 1hr tf. Anticipating strong push soon.
Not much to be said here, the price action is clean and the idea is clear, trade with the trend.
Whales are also loading up.
DTT setup


TON/USDT : Are you Bullish or Bearish? Let's Talk!By analyzing the #Toncoin chart on the 3-day timeframe, we observe that the price is still within the demand zone between $2.40 and $3.00.
If the price manages to break above the $3.10 level and hold within the next 7 days, we can expect further growth from this cryptocurrency.
The expected returns are approximately 20% in the short term, 40% to 55% in the mid-term, and up to 110% in the long term.
Please support me with your likes and comments to motivate me to share more analysis with you and share your opinion about the possible trend of this chart with me !
Best Regards , Arman Shaban

ETHERIUM LONG FOR TARGET 3000ETH has fallen from its recent high of 2879 to present levels of 2184 it has formed an anti butterfly pattern this is a good demand zone we can expect an up move from here targets and stop loss mentioned on the chart

ETH/USDT : Gearing Up for a Major Breakout? (READ)By analyzing the Ethereum chart on the weekly timeframe, we can see that the price has started rising just as expected and is now approaching the first target. For now, ETH faces major resistance in the $2,600–$2,900 zone.
If price breaks above this key area, I expect a strong bullish move from Ethereum!
Based on the main analysis, the short-term targets are $2,700 and $2,890, while the mid-term targets are $3,100 and $4,100.
Please support me with your likes and comments to motivate me to share more analysis with you and share your opinion about the possible trend of this chart with me !
Best Regards , Arman Shaban

Lingrid | ETHUSDT Price Compression and Expansion PhasesBINANCE:ETHUSDT is struggling to hold gains after a rejection from the top of the range, with price retracing back toward the breakout point and key trendline support. The structure remains intact above 2,363, where bulls may attempt another rebound. A sustained move above the blue ascending trendline would open the way toward the 2,650 target, completing the projected rebound path.
📈 Key Levels
Buy zone: 2,363–2,400
Sell trigger: breakdown below 2,363
Target: 2,650
Buy trigger: breakout and retest of 2,475–2,500 with volume
💡 Risks
Failure to hold the trendline could push price toward 2,159
Weak follow-through may stall near 2,550
Bearish engulfing from current range top can trap early buyers
If this idea resonates with you or you have your own opinion, traders, hit the comments. I’m excited to read your thoughts!

AVA/USDT – Long-Term Bullish Reversal in PlayAVA has been trading within a well-defined downward channel for weeks, making consistent lower highs and lower lows. However, price has now broken above the upper boundary of the channel with strong volume and momentum, signaling a potential trend reversal.
Technical Analysis:
Channel Breakout:
Price has successfully closed above the descending trendline (channel top), confirming breakout and bullish intent.
RSI Surge:
RSI has shot past 80, a sign of strong bullish momentum. Short-term pullbacks may occur, but long-term sentiment is shifting.
Higher Lows Forming:
Structure is starting to shift from bearish to bullish, especially with current candle body closings above $0.03016.
Volume Spike:
Notable increase in buying volume, often seen before trend flips in micro caps or small altcoins.
Key Levels to Watch:
Support Zones:
$0.03016 – Key breakout level; should act as support now
$0.02440 – Historical accumulation zone
$0.02100 – Long-term base support
Resistance / Target Zones:
T1: $0.04026 – Local structure and previous consolidation
T2: $0.05550 – Psychological and technical resistance
T3: $0.07971 – Major reversal zone
T4: $0.10185 – Long-term target from macro high
Stoploss:
$0.02400 (close below re-enters channel and invalidates breakout)
Entry Idea:
Accumulation Zone: $0.029–$0.031
This is the ideal area for positioning with minimal risk and a good reward ratio.
Not Financial Advice | DYOR Always

ADA/USDT : Get Ready for another Bullrun (READ THE CAPTION)By analyzing the #Cardano chart on the 3-day timeframe, we can see that the price is currently trading around $0.59. After sweeping the liquidity below $0.51, our bullish outlook for the next upward wave has strengthened significantly.
I'm now expecting a strong move from ADA, with short-term targets at $0.61 and $0.76, and longer-term targets at $0.93, $1.05, and $1.33!
Please support me with your likes and comments to motivate me to share more analysis with you and share your opinion about the possible trend of this chart with me !
Best Regards , Arman Shaban

Bullish confirmation today on both the daily and 4hrly.Bullish confirmation today on both the daily and 4hrly.
4hrly Chart:
Caught the dip?

XRP Army - prepare for a 72% crash to 0.6 USD! (lifetime chance)The current price of XRP is 2.19 USD, and I predict a big crash in 2025/2026 to 0.6 USD. Yes, I know you may think that that's completely impossible, especially if you are high on your XRP holdings, but I can assure you that this is going to happen! What can you do?
If you are a hodler, then you need to prepare for your portfolio to drop by 72%. Can you really handle this situation? If not, you need to take some action.
If you are a trader and you still speculate on the price increase, you can consider exiting your position. If you bought before the huge pump, take your profit now.
If you are a trader and you bought after the pump, that means at the TOP, you basically FOMOed-IN. It's time to take a small loss or exit your position at break-even. If you found yourself in one of the situations above, you have some work to do. And you need to do the work as soon as possible, before XRP starts crashing, which can be any day now. Otherwise, I strongly recommend entering a short position on futures on a strong resistance if you want to make money on XRP.
Now, importantly, why do I think XRP will crash? Technically, XRP is in a big range and has been in a range since 2017. Nothing changed at all after the pump; the price is still inside this ascending triangle. After the huge pump, the price created a big FVG (Fair Value GAP), and historically this has been a big issue for XRP because we went down each time and wiped out the GAPs. Don't forget that XRP is something like a bitch coin, it's doing weird moves, and it's always ranging and taking liquidity from traders, like a casino. Smart traders can take advantage of it and trade it, but you need to have a strategy. Right now it's obvious that XRP is going to go down in the next months!
Write a comment with your altcoin + hit the like button, and I will make an analysis for you in response. Trading is not hard if you have a good coach! This is not a trade setup, as there is no stop-loss or profit target. I share my trades privately. Thank you, and I wish you successful trades!
