Bullish confirmation today on both the daily and 4hrly.Bullish confirmation today on both the daily and 4hrly.
4hrly Chart:
Caught the dip?
Crypto market

XRP Army - prepare for a 72% crash to 0.6 USD! (lifetime chance)The current price of XRP is 2.19 USD, and I predict a big crash in 2025/2026 to 0.6 USD. Yes, I know you may think that that's completely impossible, especially if you are high on your XRP holdings, but I can assure you that this is going to happen! What can you do?
If you are a hodler, then you need to prepare for your portfolio to drop by 72%. Can you really handle this situation? If not, you need to take some action.
If you are a trader and you still speculate on the price increase, you can consider exiting your position. If you bought before the huge pump, take your profit now.
If you are a trader and you bought after the pump, that means at the TOP, you basically FOMOed-IN. It's time to take a small loss or exit your position at break-even. If you found yourself in one of the situations above, you have some work to do. And you need to do the work as soon as possible, before XRP starts crashing, which can be any day now. Otherwise, I strongly recommend entering a short position on futures on a strong resistance if you want to make money on XRP.
Now, importantly, why do I think XRP will crash? Technically, XRP is in a big range and has been in a range since 2017. Nothing changed at all after the pump; the price is still inside this ascending triangle. After the huge pump, the price created a big FVG (Fair Value GAP), and historically this has been a big issue for XRP because we went down each time and wiped out the GAPs. Don't forget that XRP is something like a bitch coin, it's doing weird moves, and it's always ranging and taking liquidity from traders, like a casino. Smart traders can take advantage of it and trade it, but you need to have a strategy. Right now it's obvious that XRP is going to go down in the next months!
Write a comment with your altcoin + hit the like button, and I will make an analysis for you in response. Trading is not hard if you have a good coach! This is not a trade setup, as there is no stop-loss or profit target. I share my trades privately. Thank you, and I wish you successful trades!

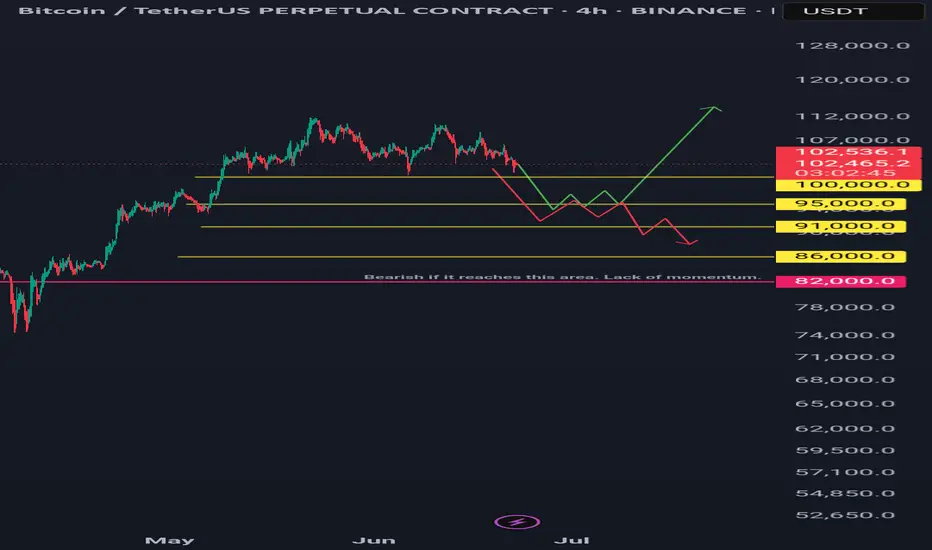
Btcusdt 4hr tf scenarios.Two scenarios: green and red lines.
Green Line: A bounce and sustained recovery above the 100-day and 200-day daily moving averages is bullish.
Red Line: A bounce followed by a lack of momentum and a break below a previous low is bearish.
Long Horizontal Red Line: If the price reaches this area, it could signal the start of a downtrend unless new bullish fundamentals emerge.
My Point of View (POV): I am bearish, primarily due to the ongoing war, similar to the conflict that began between two other countries a year ago.
However, it's important to note that every crisis and recession has historically presented a buying opportunity for institutions and 'whales.' Therefore, be prepared with funds for dollar-cost averaging (DCA), then simply hold and forget. It is recommended to conduct backtesting and research to identify optimal buying areas. DCA is key. Only invest money you can afford to lose.
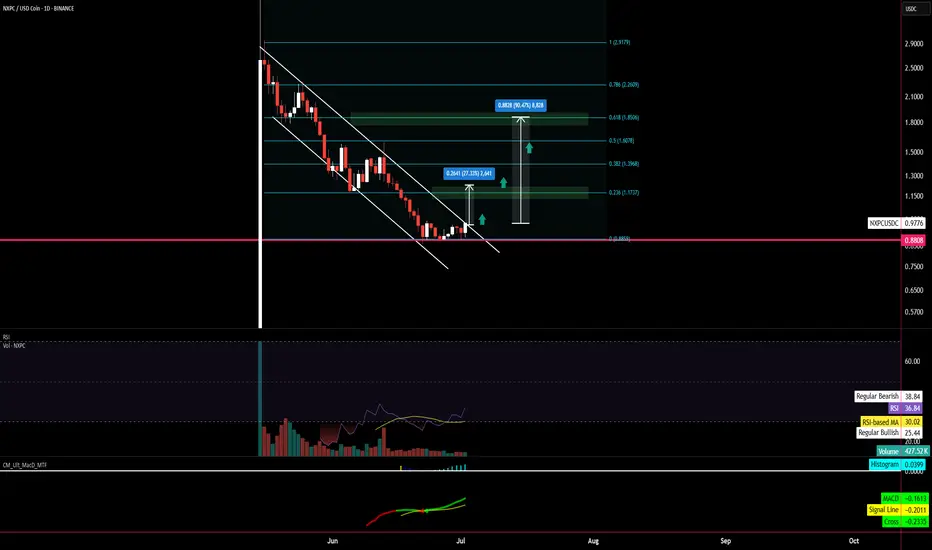
[NXPC] Between 30 to 100% gain to take?Hello all!
Looks like NXPC is ready to break the long-term downtrend since its listing on Binance. Selling volumes are decreasing and it seems like the 0.88-0.90 support is holding strong.
I expect a pump to 0.236 (minimum) fib retracement level, but could go even higher to the 0.618 level if attention drastically increases onto this project.
Let's see how it goes in the next couple of days!
Not a financidal advice, dyor! :)
Xrpusdt 4hr tf bearishA bearish head and shoulders pattern is forming.
If it closes below 2.0811 on the 4-hour timeframe, the pattern may be activated.
Targets are 1.95, 1.80, and 1.65.
Invalidation occurs if the high of the right shoulder (2.3355) is broken.

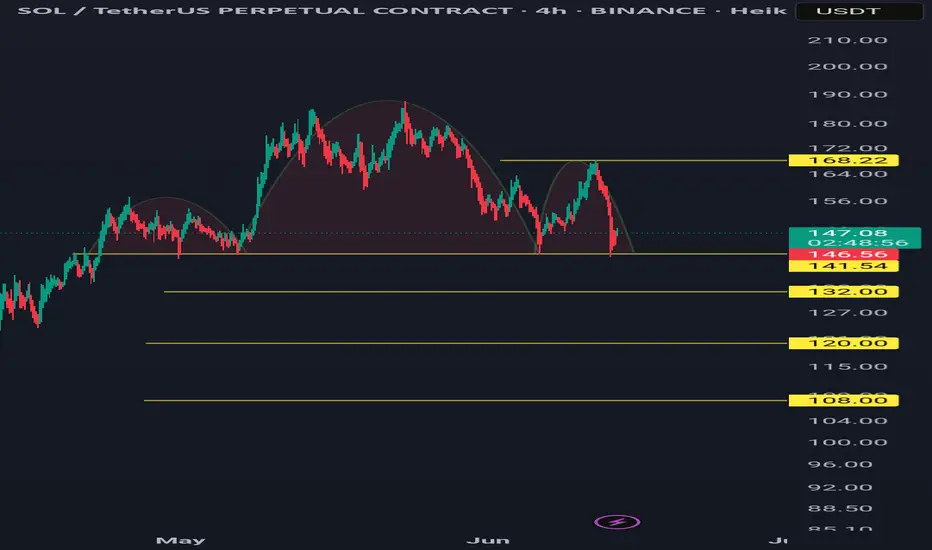
Solusdt 4hr tf bearishA bearish head and shoulders pattern is forming.
If it closes below 141.54 on the 4-hour timeframe, the pattern may be activated.
Targets are 132, 120, and 108.
Invalidation occurs if the high of the right shoulder (168.22) is broken.
BTC Just Breakout! Are we ready for new ATH? BTC just breakout from 4h trendline and anticipate for any retracement soon before sky rocket into new ATH, historically saying my target will be on $148k.
NFA!!
DYOR!!

XLMUSDT bearish 4hr time frameBTC is still in an uptrend but in a consolidation phase. However, many altcoins appear to be outliers and are significantly weaker when BTC is in a pullback phase. One of them is XLM/USDT, which is trading below the 100 and 200 MA on the daily timeframe.
A close below 0.25267 on the 4-hour timeframe may activate the pattern.
Targets are 0.215 and 0.195.
Invalidation: If it closes above 0.286.

BTC LONG TP:110,000 30-06-2025Still riding the bullish pattern 🚀
Looking for an entry between 106,200 – 106,700, targeting 109,500 – 110,500, with a clean 4 RR average.
🕓 Timeframe: 4H
⏳ Duration: 40–50 hours
Context: This is all about catching a manipulative wick — small entry now, stack more if price hits the suggested levels later.
If the move doesn’t happen within the estimated time, the trade is invalid.
We don’t use indicators, we’re not out here drawing lines or cute little shapes — I just give you a clean trade.

BTC short squeeze in the makingMany people believe that BTC is running "too hot," and we're seeing what appears to be a short squeeze. We all know what's next. No one in their right mind will buy at the top, esp. given it's volatility. Some economic events are right around the corner over the next 1-2 weeks which could impact BTC and S&P. Typically, market rallies are short lived, esp. when the fundamentals are out of whack. Unemployment is cooling (remember is a lagging indicator), high # of bankruptcies, housing unaffordability highest in decades, high interest rates, student loans will start making a dent soon...the list goes on. Don't let the Champagne effect fool you! Berkshire stocking up on cash for a reason.
Best of luck and always do your own DD! Staying positive, with a healthy dose of keeping things real.

Bitcoin - Flag pattern is brokenBitcoin had been consolidating within a flag pattern for the past three months. That pattern has now officially broken to the upside, with the price surging to $109K — a strong bullish signal fueled by encouraging news around institutional adoption.
Based on both the technical flag breakout and ongoing fundamental momentum, the next target for Bitcoin is $145K. Any move beyond that would be considered a bonus in this current bull cycle.
Stay tuned for more updates.
Cheers,
GreenCrypto

bitcoin target 500,00099% still don’t get it.
Bitcoin is just 10–12 years old.
It hit $100k without global adoption.
Now imagine the next 10 years…
As the world wakes up.
Buy @ $109,445 | Target $500,000
#Bitcoin #BTC #Crypto #BullRun

Btcusdt 4hr timeframe, bullish iH&S patternComming from shorters take profit area, formed a bullish ih&s pattern. If closes above 108725 in 4hr time, may activate the pattern.
Targets are 111500, 115000 and 120000
Invalidation if closes below 105k

BTC H2 2025 - H2 2026My analysis:
We either chop or I think we go up til mid July (115k-120k), have a correction (105k-110k), then road to 145k, correction to 110k, then off to 220k-230k, then we are done and bear market to 60k in H2 2026

BTC BULLISH FLAG AND POLE PATTERN 135,000$ TARGETAs seen in the charts, BTC is currently forming a flag and pole pattern.
Expect price to cover one last liquidity sweep before pumping to the 135-140k price range.
ESH.

BTC USDT 150,000$ TARGET . BULLISH FLAG AND POLE
Perfect bullish flag and pole pattern on the daily chart for BTC.
A successful breakout from the current channel will pump the price to the range of 145-150k $.

$ETHUSDT: Uptrend signal in the daily timeframeEthereum is ready to move higher, as I anticipated when the BINANCE:ETHBTC signal flashed...
Best of luck lads!
Cheers,
Ivan Labrie.

HOOK/USDT – Successful Retest of BreakoutHOOK has successfully retested its downtrend breakout zone and is now attempting a fresh leg up, signaling renewed bullish strength. The previous resistance is now acting as solid support.
Analysis Highlights:
Breakout from multi-week downtrend line
Sharp pullback → clean retest of the breakout line
Buyers are stepping back in from the $0.095 zone
Support Levels:
$0.0950 – Immediate support (trendline retest zone)
$0.0996 – Strong horizontal support
$0.0890 – Key invalidation level (SL zone)
Resistance / Targets:
$0.1063 – First target
$0.1234 – Mid-term resistance
$0.1508 – Extended bullish target
Stoploss: Below $0.0890 (close below trendline)
Structure looks bullish for continuation if HOOK holds above $0.0950 and breaks $0.1063 with volume.
DYOR
Not Financial Advice

THEUSDT longTook a long position on #THEusdt
Aiming for $0.2712-0.2766 daily HH area
Time sensitive
Stop is at $0.2564

BTC Weekly Analysis : Rise or Fall ? Let's SeeBy analyzing the #Bitcoin chart on the weekly timeframe, we can see that last week’s candle closed at $108,350, and BTC is currently trading around $107,500. If the price manages to hold above $105,700, we could expect further upside momentum. The next potential bullish targets are $111,700, $124,000, and $131,800.
So far, this analysis has yielded over 9% return, and we’ll be sharing more updates soon from lower timeframes!
🎥 If you enjoyed this video analysis and found it helpful, please show your support with a LIKE and COMMENT below!
These video-style breakdowns take time and effort, and I’ll only continue them with your support 🙌
Your engagement is my biggest motivation to keep going 💛
Thanks for being part of the journey!

sei long again to $0.3Recently went long on sei, targeted the 4hr HH point. corrected a bit and went long again, this time targeting $0.3
Time sensitive. Still one can get Like 2RR + from it I think
stop could be tigher as well to around $0.2780

That's why everyone should have LINK⚡️ Hello, everyone! I decided to continue exploring fundamental altcoins. Next up is LINK. This is definitely a key project in terms of technology, and without it, the crypto ecosystem we know today would not exist. Their oracle technology is used by approximately 90% of ALL protocols.
So it's hard to underestimate its importance, but let's take a look from a technical point of view. How much trading potential does LINK have?
➡️ The token has been in correction for a long time, like practically the entire market. During the decline, it formed a GAP at the level of $25.65 - $20.55. And as we know, 95% of GAPs tend to close sooner or later.
Globally and locally, the token is currently in a flag pattern. Therefore, high volatility and a period of consolidation can be expected in the near future. During this period, the further direction of the token's movement will become clear.
⚙️ Metrics and Indicators:
Volume - a divergence with the price has formed. Throughout the correction, sales volumes have decreased. This signals the exhaustion of sellers.
Money Flow - harmony with the price. Liquidity continues to slowly decline, but at the same time, it does not form new lows, which means that demand for the token remains.
Support/Resistance - LINK has now reached a key level at $12.64, which could trigger a surge in buyer interest. However, if it cannot hold, the next strong support is at $10.09. At the same time, slightly higher, at $15.52, there is strong resistance, which is also a strong psychological resistance (round number).
📌 Conclusion:
LINK certainly still has potential for decline. It is quite undervalued, even with Bitcoin being so expensive. But if Bitcoin falls, LINK will fall even lower, as will the entire market.
And at times like these, everyone's attention turns first to fundamental assets that are truly valuable and currently too cheap. No one is rushing to buy HarryPotterObamaSonicInu10 because no one knows its true value.
🔥 So be patient, LINK is definitely a fundamental asset, and if you want to add it to your portfolio, now is definitely not the time.

A new BUY signal has emerged on the BTC/USDBUY Signal: Activated at 107168.37, following a rejection from demand and signs of bullish momentum building, suggesting a potential short-term reversal.
TP Zones:
TP1: 108458.10
TP2: 109747.83
Final TP: 111037.56
This setup offers a potential profit range of approximately +1,290 to +3,869 pips from entry.
Market Structure:
Price broke downward structure previously but has since reacted strongly from the demand zone, forming a new higher low and showing signs of reclaiming premium imbalance zones. The signal aligns with a possible shift toward bullish continuation, with targets set within the overhead supply area.
Remember to manage your trades carefully and ensure this setup fits your overall strategy. Stay sharp and trade responsibly!
