AAVE Breakdown Could Trigger Major DropYello Paradisers — did you spot the bearish setup forming on AAVEUSDT? If not, you might already be a step behind, but there’s still a high-risk-reward opportunity on the table — if you approach it with discipline.
💎Currently, AAVEUSDT is looking increasingly bearish. The asset has confirmed a bearish Change of Character (CHoCH), broken down from a rising wedge pattern, and is showing clear bearish divergence on the chart. These combined signals suggest that the probability of further downside is increasing.
💎From here, there are two main scenarios we’re monitoring. First, AAVE could attempt a pullback to fill the Fair Value Gap (FVG) above, which would offer a clean short-entry zone with strong risk-reward potential. Alternatively, price could reject directly from the nearby Bearish Order Block (OB), offering another chance for well-structured entries. Both setups depend on confirmation and timing, so patience is key.
💎However, if AAVE breaks and closes decisively above the current resistance zone, the bearish thesis becomes invalid. In that case, the best move is to wait on the sidelines and allow new, higher-quality price action to form before re-engaging.
💎This market demands patience and discipline. You don’t need to catch every move — just the right ones. Stay sharp, stay focused, and let the market come to you.
Strive for consistency, not quick profits. Treat the market as a businessman, not as a gambler.
MyCryptoParadise
iFeel the success🌴
Crypto market

#BCHBTC #1W (Binance) Big falling wedge breakoutCRYPTOCAP:BCH just regained 50MA weekly support in sats, performing better than CRYPTOCAP:BTC
Seems likely to continue bullish towards 200MA resistance, probably after a pull-back.
⚡️⚡️ #BCH/BTC ⚡️⚡️
Exchanges: Binance
Signal Type: Regular (Long)
Amount: 7.0%
Current Price:
0.004885
Entry Targets:
1) 0.004657
Take-Profit Targets:
1) 0.006329
Stop Targets:
1) 0.003987
Published By: @Zblaba
CRYPTOCAP:BCH BINANCE:BCHBTC #BitcoinCash #PoW bitcoincash.org
Risk/Reward= 1:2.5
Expected Profit= +35.9%
Possible Loss= -14.4%
Estimated Gaintime= 4-7 months

Btc Usd IH&SHi all. BTC is in an IH&S on top of a larger IH&S pattern it seems. Pullback to 96K possible. But looking good for longer term trades. I'm sure this will pump, not 70K as most are saying, 90K is the lowest for now imo. Not financial advice. Please do your own research. Please leave a like, some motivation for an update. Good luck with your next trade.
long bitcoin from 106160ALL trading ideas have entry point + stop loss + take profit + Risk level.
hello Traders, here is the full analysis for this pair, let me know in the comment section below if you have any questions, the entry will be taken only if all rules of the strategies will be satisfied. I suggest you keep this pair on your watchlist and see if the rules of your strategy are satisfied. Please also refer to the Important Risk Notice linked below.
Disclaimer

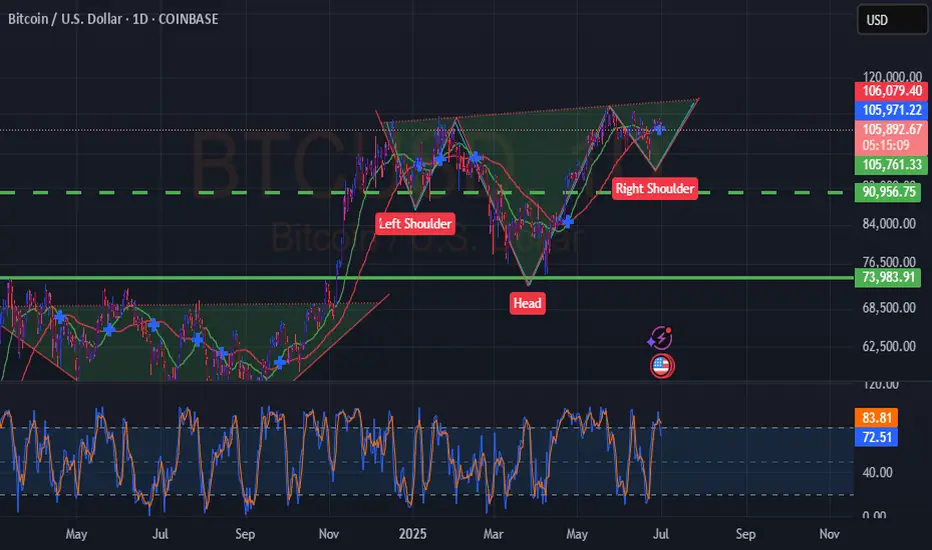
also looks a bit like inverted head and shouldersbitcoin wouldnt be bitcoin , if from time to time a more or less head and shoulders pattern comes along.
in this case it looks a bit like the right inverted shoulder is being made. but the bearish div is also present.
it might be possible , a sharp move up to new highs around 135 k , followed by a drop below 100k .

bearish divergence on the weekly , pullback seems to be comingafter a bullish run up , it looks like it is about time to cool down a bit . retrace to below 100k , and test support . bearish diversion is clearly showing on the bigger timeframes and can play out very soon.


ETH needs support now. ETH is holding up by a thread. There are signs of weakness in the market, and if the Ethereum price breaks below support, it is likely we will see follow-through.
Full TA: Link in the BIO
BTC/USDT 4H Outlook - Bearish Setup playing outAs expected, BTC is now moving toward the 4H liquidity zone.
❗Price is breaking structure from the Daily FVG resistance, showing bearish momentum.
🔍 Current confluences in play:
— Rejection from Daily FVG
— 4H structure shift
— Clean imbalance below
🎯 My next key zone is 104K (4H liquidity)
Reaction there will guide the next move.
Stay tuned for more updates

The Critical Blue Line – Will Bitcoin Soar or Sink
🔹 Bitcoin Technical Analysis – Key Blue Line, Bear Trap Possibility & Long-Term Scenario
On the Bitcoin chart, the blue horizontal level has acted multiple times as both support and resistance. The price has broken it several times but failed to sustain above, indicating high-volume decision-making zones by institutions and large players.
📉 Why this pattern keeps repeating:
Strong supply and demand concentration at this level.
Inability to break and hold shows market indecision.
Repeated fakeouts are likely used to shake out weak hands.
🔍 Important hidden scenario: Bear Trap Potential
If the price dips below the blue line but quickly reclaims it, it may form a bear trap, tricking short sellers into entering prematurely. This move could ignite strong bullish momentum from trapped sellers and renewed buyers.
🔮 If price holds above the blue line:
Signals market strength and potential bullish structure shift.
Targets:
109,800
117,200
120,000+ (Long-term)
📛 If support fails again:
Retracement toward the lower channel near 101,000 or lower is possible.
📊 Conclusion:
This zone is one of the most critical decision points in the current market. Traders should combine volume, candlestick behavior, and confirmation signals to avoid getting trapped by fake breaks

BTC - Daily Chart - Bull flag route 7/1/2025July 1st, 2025
BTC - Daily Chart
A bull flag route = Two Scenarios
1. Breakout - UP
- Retrace before the $105k area
- Consolidate
- Break out the top line
SL $104k
TP1 @ 108k
TP2 @ 111k
Final TP @ 113k NEW ATH
2. Fail support - DOWN
- 105k fail to support
- Aim for the button of the flag for support
SL $106k
TP @100k
Final TP @96k

The Yield Curve Just Turned Bullish, So Did $RAI’s Future🚀 The Yield Curve Just Turned Bullish — So Did $RAI’s Future
Why This AI Token Could Be the Biggest Beneficiary of the Bull Steepening Cycle
"When the curve steepens, capital doesn’t trickle — it floods into risk. And $RAI is perfectly positioned."
📈 Macro Setup: Bull Steepening Means Risk-On
The story starts with rates. Here's the shift:
Where we were: Bear steepening — long-end rates spiked on inflation fears while short-end stayed high. Liquidity was scarce. Risk was punished.
Where we are now: Bull steepening — short-end rates are falling faster than long-end rates rise. This signals reflation and the beginning of a capital rotation into growth and risk.
Historically, this phase fuels massive runs in:
Small caps (Russell 2000)
Narrative-driven tech
Crypto
And especially AI-powered, low-float tokens like $RAI
🤖 Why Reploy AI ($RAI)?
$RAI isn’t just an AI meme coin — it’s an infrastructure layer for decentralized AI inference. With only 10M tokens, it’s one of the most scarce, utility-based plays in Web3 AI.
And now, macro tailwinds + chart setup + capital rotation = asymmetric upside.
🎯 Updated Upside Targets
✅ Mini-Top: $10.61 by July 18
This target aligns with:
The top of the current regression band.
Mid-summer capital rotation.
Historical pre-breakout behavior from 2020/2021 AI-coins like NYSE:FET and $OCEAN.
🧮 From today’s ~$0.69: That’s a 15x move in ~3 weeks.
💥 Blow-Off Top: $114 to $1,012 by Dec 21
This is the big one — and your chart now reflects the most important extension:
A 5-week window from Nov 18 to Dec 21, aligning with prior cycle tops.
Price range between $114 and $1,012.
Implies a market cap of $1.14B to $10.12B (fully diluted) — still modest compared to likely peers if AI mania peaks.
Think BIST:LINK in 2021 or CRYPTOCAP:SOL in late 2020. $RAI has the same structure — now layered with macro rocket fuel.
🧠 Why It Matters
In bull steepening cycles, capital chases asymmetry. The whole framework flips:
Safe → Speculative
Yield → Growth
Real → Narrative
AI + Web3 sits at the intersection of the two hottest macro themes. $RAI is the leading microcap expression of both.
If you're looking to allocate based on macro structure + narrative rotation + price action, this chart is screaming.
📣 Summary for Readers:
We're in the early innings of a reflationary, risk-on regime shift. If the blow-off top hits by December as expected, tokens like $RAI could become the top performers of the entire cycle.
With a $0.69 entry price, the risk-to-reward is wildly asymmetric.
📈 Don’t just follow the trend. Front-run it.
💡 $RAI is where narrative, structure, and scarcity converge.

BTC/USDT – 4H Liquidity Sweep Likely Before Bullish ReactionBitcoin is showing signs of distribution within a daily FVG range. The recent failure to break above 107,000 with strength suggests a sweep of downside liquidity is likely.
🧩 Key Observations:
• Price is still respecting the daily FVG above (imbalance not fully filled).
• A visible liquidity pool is sitting below recent 4H lows near 104,000.
• Confluence with 4H support zone and lower daily FVG around 102,000.
🎯 What I Expect:
• Price to sweep 4H liquidity → tag 104K area
• Possible wick or reaction from there
• If momentum increases, price could tap into the deeper imbalance around 102K
📌 Setup Bias:
Short-term bearish (targeting liquidity grab), then reassessing for long setups near support + FVG convergence.
🧠 This setup is built on smart money principles — liquidity engineering, fair value gap fills, and mitigation.
⸻
Key Levels:
• 🔴 Resistance: 107,000–108,000 (Daily FVG top)
• ⚫ Target Zone: 104,000 (Liquidity + 4H support)
• 🟣 Potential Bounce Zone: 102,000 (Lower Daily FVG)

BTCUSDT – Multi-Timeframe Analysis | Demand Zone Sweep SetupAnalyzing BTCUSDT using 15m, 1h, 4h, and 1D timeframes.
Current structure shows a potential demand zone sweep followed by a reclaim setup.
Key confluences include:
RSI divergence forming on the 15m and 1h
Possible CHoCH on the 15m chart confirming bullish intent
Daily structure still intact as long as 106k holds
TP1, TP2, and SL levels are marked on the chart.
Monitoring closely for bullish confirmation before entry.
Trade what you see, not what you feel.

15 min diamond reversal15 minuet chart also confirms a reversal conformation to the v on previous published chart on btc

Lingrid | ETHUSDT Price Compression and Expansion PhasesBINANCE:ETHUSDT is struggling to hold gains after a rejection from the top of the range, with price retracing back toward the breakout point and key trendline support. The structure remains intact above 2,363, where bulls may attempt another rebound. A sustained move above the blue ascending trendline would open the way toward the 2,650 target, completing the projected rebound path.
📈 Key Levels
Buy zone: 2,363–2,400
Sell trigger: breakdown below 2,363
Target: 2,650
Buy trigger: breakout and retest of 2,475–2,500 with volume
💡 Risks
Failure to hold the trendline could push price toward 2,159
Weak follow-through may stall near 2,550
Bearish engulfing from current range top can trap early buyers
If this idea resonates with you or you have your own opinion, traders, hit the comments. I’m excited to read your thoughts!

HFTUSDT Forming Falling WedgeHFTUSDT is currently displaying a textbook Falling Wedge Pattern, a classic signal that often points to an upcoming bullish reversal. This pattern is one of the most reliable in technical analysis, as it indicates that sellers are gradually losing momentum and buyers could soon step in to push prices higher. With good volume backing up this setup, traders are growing more confident that a breakout is on the horizon, which could fuel a strong upward rally.
The potential gain for HFTUSDT based on this pattern is estimated between 90% to 100%+, making it an attractive opportunity for swing traders and investors looking for high-risk, high-reward plays. The steady uptick in volume suggests that smart money is already accumulating positions before the anticipated breakout. When combined with the bullish pattern, this sets the stage for a price surge once the resistance line of the wedge is convincingly broken.
This setup comes at a time when the crypto market sentiment is gradually improving, with traders seeking altcoins that can outperform in the next bullish wave. HFTUSDT’s clear technical structure and growing investor interest place it among the top coins to watch closely. A confirmed breakout with strong daily closes above the wedge resistance could open the door to quick gains, rewarding early entrants who position themselves strategically.
It’s always wise to monitor volume and price action carefully when trading a Falling Wedge Pattern like this. Waiting for a confirmed breakout with increased volume can help reduce the risk of false signals and maximize profit potential. Keep HFTUSDT on your radar if you’re aiming to catch a move with solid technical backing and high potential upside.
✅ Show your support by hitting the like button and
✅ Leaving a comment below! (What is You opinion about this Coin)
Your feedback and engagement keep me inspired to share more insightful market analysis with you!

do not SHORT Bitcoin with 20XA consolidation range happens when the market trades sideways, in a neutral capacity. This sideways trading is neither bearish nor bullish, thus neutral. The bearish or bullish tendencies can only be defined based on the broader market structure.
If the consolidation range develops coming from a major drop, you can say that the market is bearish and the consolidation a bearish consolidation even if the breakout happens to the upside. Once it happens to the upside we can say that a reversal developed but the tendencies were bearish nonetheless.
If the consolidation range develops coming from a major rise, you can easy say while being correct that the market is bullish and the consolidation phase a bullish one, because of the bigger structure, previous price action and the chart.
Bitcoin is consolidating with bullish tendencies but there is a boundary which we call resistance and another boundary which we call support, this is the trading range. When the market is ranging, this is when margin traders lose the most because the trend remains hidden and money tends to be made when the market is in a clear trend.
Whenever the upper boundary gets challenged we get a retrace and a test of support. Whenever the lower boundary gets tested prices recover and move back up. This process gets repeated for as long as it is needed to remove all the weak hands, most of the signals are pure noise.
This is the situation in which we find Bitcoin today. Ultra-bullish but sideways and anything can happen short-term. Do not SHORT Bitcoin with 20X. You might end up with some fast and easy profits.
Thank you for reading.
Namaste.

ARTY Launch: Play-and-Earn goes live June 30KUCOIN:ARTYUSDT Artyfact (ARTY) is approaching a major milestone, with its Play-and-Earn platform scheduled to launch on June 30. In anticipation, the token is already showing signs of strength, trading around $0.188 and gaining upward momentum. This move comes off a clear technical structure: a double-bottom reversal followed by a breakout above the descending trendline.
Price action is beginning to confirm the shift in sentiment as the official Play-and-Earn tournament kickoff draws near. With just days left until June 30, anticipation is building as the launch will mark a real turning point. Until then, the current pre-launch sentiment continues to lean optimistic, driven by growing community engagement, strong social media traction, and increasing excitement around what Artyfact is building.
The anticipation surrounding the June 30 launch could be creating strong momentum, as traders and early supporters position themselves ahead of what could be a key moment for the project.
From a broader market perspective, Bitcoin continues to lead the risk-on rotation. BTCUSD recently had an aggressive bullish rally and is poised to maintain upward momentum if macro conditions remain favorable.
Historically, Bitcoin strength has preceded major capital inflows into small-cap altcoins. As BTC resumes its bullish trajectory toward the $110,000 zone, it provides ideal conditions for undervalued projects to reprice aggressively. The rotation effect tends to flow from BTC → ETH → high-utility altcoins and ARTY is positioned to benefit from this dynamic.
Fundamentally, ARTY is deeply undervalued relative to its potential.
Low market cap: A micro-cap with asymmetric upside.
80%+ of total supply is in circulation, reducing inflation risk and encouraging organic demand.
Holder base is expanding, reflecting early-stage adoption and network growth.
Major catalysts ahead:
🎮 Launches on PlayStation, Xbox
📱 Releases on AppStore and Google Play
🧩 NFT integration and metaverse gameplay expansion
These milestones could drive exponential user growth, attracting both gamers and crypto enthusiasts to the ecosystem. When combined with the convergence of technical bottoming, bullish macro conditions, and strong fundamental catalysts, the setup supports the potential for a sustained move toward the $1.00 zone as momentum builds post-launch.
Traders should monitor for confirmation:
-Higher low formations
-Expansion in bullish volume
-Strong closes above interim resistances
With BTC strengthening and capital rotating down the risk curve, early entries in fundamentally sound projects like ARTY offer high risk-reward profiles.

Bitcoin Faces Resistance Rejection — Bearish Divergence Signals Bitcoin is showing signs of exhaustion as it stalls near a high-timeframe resistance level aligned with the value area high (VAH). Recent price action has formed multiple lower timeframe bearish divergences while testing dynamic resistance. This level has now capped further upside attempts and could trigger a market rotation lower if rejected again.
With price consolidating directly beneath this barrier, the probability of a pullback grows stronger, especially if no bullish confirmation breaks the current ceiling.
Key Technical Points:
- Bearish Divergence Developing: Price is holding below the VAH with a weakening momentum signature
- Converging Resistance Zone: Dynamic SR and VAH are aligned at $108,350, now acting as a ceiling
- Range-Based Rotation Setup: If rejected, price could rotate down to the point of control and value area low
Bitcoin’s current structure is classic range behavior, with price gravitating from low to high and back. At the moment, it’s stalled at the value area high, which represents the upper boundary of the most recent range. This level — around $108,350 — has been tested several times, and now a bearish divergence is forming across key momentum indicators like RSI and MACD.
In addition, price is showing multiple rejections against dynamic resistance, forming a pattern of lower highs on lower timeframes. The longer this resistance zone holds, the more likely price will revert to the point of control (POC) — the area with the highest traded volume in the range. If that level doesn’t hold either, a full rotation to the value area low becomes the next probable scenario based on market auction theory.
This rotation would represent a complete cycle from value area high acceptance back to value area low rejection, which is common when buying pressure fades and sellers regain control. For now, Bitcoin remains technically vulnerable as long as price stays capped beneath the $108,350 level.
Bitcoin’s next move hinges on whether it can reclaim the $108,350 resistance zone with volume. If not, expect a corrective phase that targets the POC first, followed by potential continuation down to the value area low. This bearish setup remains valid until price closes decisively above current resistance.

Altcoins Bull Market Confirmed —Fun TokenEvery time there is a strong rise immediately what follows is a correction, always, unless of course you are in a bull market. Here you have the most revealing signal of all: Price stability after a major rise, sideways rather than bearish.
Fun Token (FUNUSDT) produced a more than 340% bullish wave. What happens right after the peak? If you guessed a drop I don't blame you, that is what normally happens but here things are different. Since the market is growing and set to grow strong for long, after this major rise instead of a crash we have consolidation, sideways. This reveals that participants are not selling, they are not selling because they know the rise is not over, there will be additional growth.
Go back in time and look at 30-50 altcoins and see what happens after each strong bullish wave, a correction. Now, do the same but focus on a bull market; what happens after a strong bullish wave? Some consolidation followed by additional growth.
The altcoins bull market is already confirmed.
Thanks a lot for your continued support.
Namaste.

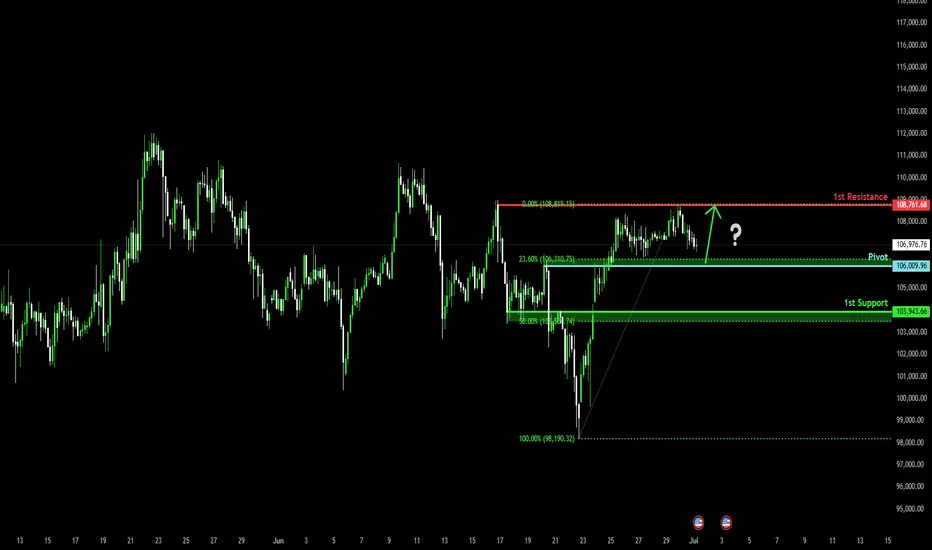
Bullish bounce?The Bitcoin (BTC/USD) is falling towards the pivot which acts as a pullback support and could bounce to the 1st resistance.
Pivot: 106,009.96
1st Support: 103.943.66
1st Resistance: 108,761.68
Risk Warning:
Trading Forex and CFDs carries a high level of risk to your capital and you should only trade with money you can afford to lose. Trading Forex and CFDs may not be suitable for all investors, so please ensure that you fully understand the risks involved and seek independent advice if necessary.
Disclaimer:
The above opinions given constitute general market commentary, and do not constitute the opinion or advice of IC Markets or any form of personal or investment advice.
Any opinions, news, research, analyses, prices, other information, or links to third-party sites contained on this website are provided on an "as-is" basis, are intended only to be informative, is not an advice nor a recommendation, nor research, or a record of our trading prices, or an offer of, or solicitation for a transaction in any financial instrument and thus should not be treated as such. The information provided does not involve any specific investment objectives, financial situation and needs of any specific person who may receive it. Please be aware, that past performance is not a reliable indicator of future performance and/or results. Past Performance or Forward-looking scenarios based upon the reasonable beliefs of the third-party provider are not a guarantee of future performance. Actual results may differ materially from those anticipated in forward-looking or past performance statements. IC Markets makes no representation or warranty and assumes no liability as to the accuracy or completeness of the information provided, nor any loss arising from any investment based on a recommendation, forecast or any information supplied by any third-party.